際際滷

際際滷Share a Scribd company logo
4 ~ manale mourdi ~ chapter 4 outstanding project math
Section 4.2: Graphing Linear
Functions page 272 #8
0 This will show you how to graph a linear equations given an
equation in y=mx+b format.
0 When an equation is in slope-intercept form the y is always on
one side by itself. There can not be more than one y either.
0 Graph the equation: y+5x=-5
0 If a line is not in slope-intercept form, then we must solve for y
to get it there.
0 Step 1: Solve the equation for y .You have to isolate the variable y.
0 y+5x=-5
-5x -5x subtract -5x to both sides and would get y =-5x-5
y= -5x-5
0 Now the equation is in y=mx+b format:
m is the slope which is -5, and b is the second fixed constant to appear
in an algebraic equation in this case is 5.
Section 4.2 (continued)
0 Step 2: Make a table,choose a
few values for
x. For now I will include three
values in the table :
A negative number, zero, and
a positive number. Then,
calculate the y values.
0 For my x values I will
choose -1, 0,and 1.
0 The y values I found were 0, -5
and -10.
INPUT
(X)
y= -5x-5 OUTPUT
(Y)
-1 y=-5(-1)-5
y=5-5
y=0
0
(also called
x
intercept)
0
(Also
called y
intercept)
y=-5(0)-5
y=0-5
y=-5
-5
1 y=-5(1)-5
y=-5-5
y=-10
-10
Section 4.2(continued)
0 Step 3:Plot the points on a graph made to scale . In this case I will use a
scale by twos. By making a table it gives me three points, in this case (-
1, 0) (0, -5) and (1, -10) to plot and draw the line. Remember when
plotting points you always start at the origin. Next you go left (if x-
coordinate is negative) or right (if x-coordinate is positive. Then you go
up (if y-coordinate is positive) or down (if y-coordinate is negative)
Step 4: Connect the points
by drawing a line through
Make sure your line covers the
graph and has arrows on both
ends. Be sure to use a
ruler.. Label the points too.
Step 5: Go take a break , youve
just learned how to
graph a linear function in slope
intercept form!!!
(-1,0)
(0,-5)
(-1,-10)
Section 4.3: Graph Using
Intercepts page 272 #12
0 You can use the fact that two points determine a line
to graph a linear equation. Two convenient points are
the points where the graph crosses the axes.
0 These two points are the x and y intercepts.
0 The x-intercept is the x-coordinate of a point where
the graph crosses the x-axis.
0 The y-intercept is the y-coordinate of a point where
the graph crosses the y-axis.
0 To find the x-intercept of the graph of a linear
equation, find the value of x when y=0. To find the y-
intercept of the graph, find the value of y when x=0.
Section 4.3(continued)
0 Graph the equation 4x+4y=-16 using the two intercepts.
0 You can find the intercepts using the original standard
form linear equation or by changing into slope intercept
form and taking it from there.
0 First find the y-intercept first.I will just use the standard
form equation.
0 4x+4y=-16 plug in 0 in the 束 x 損 value.
4(0)+4y=-16
4y=-16 all that is left is 4y=-16
We have to isolate the y so we divide by 4 on both sides:
4y=-16
4 4
It leaves us with : y = -4 , so the y intercept is (0,-4)
Section 4.3(continued)
0 Now, find the x-intercept.I will just use the method used in
the previous problem.It doesnt matter what order you find
the intercepts or what method you choose because the
answer remains the same.
0 4x+4y=-16 plug in 0 in the 束 y 損 value.
4x+4(0)=-16
4x=-16 all that is left is 4x=-16
We have to isolate the 束 x 損 so we divide by 4 on both sides:
4x=-16
4 4
It leaves us with : x = -4 , so the y intercept is (-4,0).
Section 4.3(continued)
0 Step 2 : Plot the points that correspond to the intercepts: y-
intercept is (0,-4) and y intercept is (-4,0).
Step 3: Connect the points
by drawing a line
t through them. Make sure
your line covers the graph
and has arrows on both
ends. Be sure to use a ruler.
Step 4: Go take a break ,
youve just learned how to
graph using intercepts!!
(0,-4)
(-4,0)
Section 4.4: Compute The
Slope page 273 #16
0 Slope is the ratio of the vertical rise to the horizontal
run between any two points on a line. Usually referred
to as the ratio of the rise(change in y) over
run(change in x).
0 The formula for finding slope is used when you know
two points of a line. The two points look like : 1st point
: (X1,Y1) , 2nd point : (X2,Y2). EQUATION is
SLOPE = RISE= Y2-Y1 (change in y)
RUN X2-X1 (change in x)
Section 4.4 (continued)
0 Step 1: Find the slope of the
line shown :
0 Let (x1,y1)=(-2,0) and
(x2,y2)=(4,9)
m(slope)=Y2-Y1 Step 2: write
X2-X1 formula
= 9-0 Step 3: plug in
4-(-2) values
= 9
6
0 Now the slope is 9/6 meaning
we go up 9 and to the right 6
because our slope is positive.
0 The line rises from left to right
so the slope is positive.
0 DONE !!
(4,9)
(-2,0)
Section 4.5: Graph Using Linear
Equations page 273 #18
0 Step 1:Make sure the equation is in slope-intercept form.In this
case the equation is : 4x-y=3 The equation isnt in slope
intercept form, it is in standard form so we have to rewrite it:
0 Move all terms containing y to the left, all other terms to the
right.
0 Add '-4x' to each side of the equation to leave -1y alone. Notice
that I added a -1 to the y because we will need to get rid of the
negative later on.
-4x + -1y = 3
+4x +4x
Were left with : -1y=-4x+3
-1 -1 -1 Divide each side by '-1
0 Simplify, the equation is now in slope intercept form : y = 4x-3
Section 4.5 (continued)
0 Step 2 : Identify the slope and y-intercept. Since the
equation is y = 4x-3, we can easily identify the y
intercept which is in this case (0,-3) because when
you plug in 0 to the xs spot, y= -3.Instead of doing all
this work just look at b which is the second fixed
constant to appear in this equation.
0 The slope is -4 or -4 over 1 meaning you go down four
and to the right one.
Section 4.5 (continued)
0 Step 3: Plot the y-intercept
which is (0,-3) .
0 From the y-intercept use the
slope(-4) to get another point
on the line. Draw a line
through the points.
0 TADA!!! Youre done and now
know everything about slope,
intercepts, and graphing
linear equations!
(0,-3)
(1,-7)
Thanks For Watching !!
You just learned the basics of GRAPHING LINEAR EQUATIONS AND
FUNCTIONS!!!

More Related Content

What's hot (20)

Functions
FunctionsFunctions
Functions
Siyavula
Graphs of linear equation
Graphs of linear equationGraphs of linear equation
Graphs of linear equation
Junila Tejada
Graphing Linear Inequalities
Graphing Linear InequalitiesGraphing Linear Inequalities
Graphing Linear Inequalities
inderjyot
Finding Slope 2009
Finding Slope 2009Finding Slope 2009
Finding Slope 2009
patrickhello
Finding slope
Finding slopeFinding slope
Finding slope
kjmonopoly7311
Analytical geometry
Analytical geometryAnalytical geometry
Analytical geometry
Siyavula
Graphing inequalities
Graphing inequalitiesGraphing inequalities
Graphing inequalities
mooca76
Graphing Linear Functions
Graphing Linear FunctionsGraphing Linear Functions
Graphing Linear Functions
hisema01
5.1 Finding Slope
5.1 Finding Slope5.1 Finding Slope
5.1 Finding Slope
guest7985b1
American public university math 110 complete course
American public university math 110 complete courseAmerican public university math 110 complete course
American public university math 110 complete course
Christina Walkar
1555 linear equations
1555 linear equations1555 linear equations
1555 linear equations
Dr Fereidoun Dejahang
Imaginary numbers
Imaginary numbersImaginary numbers
Imaginary numbers
SamanthaS13
Linear equations part i
Linear equations part iLinear equations part i
Linear equations part i
coburgmaths
Algebra 1 Lesson Plan
Algebra 1 Lesson PlanAlgebra 1 Lesson Plan
Algebra 1 Lesson Plan
thoma3ca
Skill31 b graphinglinesandformsof equations
Skill31 b graphinglinesandformsof equationsSkill31 b graphinglinesandformsof equations
Skill31 b graphinglinesandformsof equations
dware655
Graphing linear equations
Graphing linear equationsGraphing linear equations
Graphing linear equations
mathisthenewcool
Graphing Linear Equations Lesson
Graphing Linear Equations LessonGraphing Linear Equations Lesson
Graphing Linear Equations Lesson
cdavis12
Graphing linear equations
Graphing linear equationsGraphing linear equations
Graphing linear equations
Terry Gastauer
2.2 linear equations
2.2 linear equations2.2 linear equations
2.2 linear equations
Jessica Garcia
Inverse of a Matrix
Inverse of a MatrixInverse of a Matrix
Inverse of a Matrix
Yashh Pandya
Functions
FunctionsFunctions
Functions
Siyavula
Graphs of linear equation
Graphs of linear equationGraphs of linear equation
Graphs of linear equation
Junila Tejada
Graphing Linear Inequalities
Graphing Linear InequalitiesGraphing Linear Inequalities
Graphing Linear Inequalities
inderjyot
Finding Slope 2009
Finding Slope 2009Finding Slope 2009
Finding Slope 2009
patrickhello
Analytical geometry
Analytical geometryAnalytical geometry
Analytical geometry
Siyavula
Graphing inequalities
Graphing inequalitiesGraphing inequalities
Graphing inequalities
mooca76
Graphing Linear Functions
Graphing Linear FunctionsGraphing Linear Functions
Graphing Linear Functions
hisema01
5.1 Finding Slope
5.1 Finding Slope5.1 Finding Slope
5.1 Finding Slope
guest7985b1
American public university math 110 complete course
American public university math 110 complete courseAmerican public university math 110 complete course
American public university math 110 complete course
Christina Walkar
Imaginary numbers
Imaginary numbersImaginary numbers
Imaginary numbers
SamanthaS13
Linear equations part i
Linear equations part iLinear equations part i
Linear equations part i
coburgmaths
Algebra 1 Lesson Plan
Algebra 1 Lesson PlanAlgebra 1 Lesson Plan
Algebra 1 Lesson Plan
thoma3ca
Skill31 b graphinglinesandformsof equations
Skill31 b graphinglinesandformsof equationsSkill31 b graphinglinesandformsof equations
Skill31 b graphinglinesandformsof equations
dware655
Graphing linear equations
Graphing linear equationsGraphing linear equations
Graphing linear equations
mathisthenewcool
Graphing Linear Equations Lesson
Graphing Linear Equations LessonGraphing Linear Equations Lesson
Graphing Linear Equations Lesson
cdavis12
Graphing linear equations
Graphing linear equationsGraphing linear equations
Graphing linear equations
Terry Gastauer
2.2 linear equations
2.2 linear equations2.2 linear equations
2.2 linear equations
Jessica Garcia
Inverse of a Matrix
Inverse of a MatrixInverse of a Matrix
Inverse of a Matrix
Yashh Pandya

Similar to 4 ~ manale mourdi ~ chapter 4 outstanding project math (20)

March 18
March 18March 18
March 18
khyps13
Graphing, Slope, And Special Lines
Graphing, Slope, And Special LinesGraphing, Slope, And Special Lines
Graphing, Slope, And Special Lines
kliegey524
Slope and y intercept
Slope and y interceptSlope and y intercept
Slope and y intercept
billingssr
2.2 linear equations and 2.3 Slope
2.2 linear equations and 2.3 Slope2.2 linear equations and 2.3 Slope
2.2 linear equations and 2.3 Slope
Jessica Garcia
Coordinate Plane 2.ppt
Coordinate Plane 2.pptCoordinate Plane 2.ppt
Coordinate Plane 2.ppt
ElmabethDelaCruz1
Graph linear inequalities
Graph linear inequalities Graph linear inequalities
Graph linear inequalities
AgohaChinonso
Grade 8 Mathematics Q2 w1
Grade 8 Mathematics Q2 w1Grade 8 Mathematics Q2 w1
Grade 8 Mathematics Q2 w1
Jubeth Lising-Lugtu
system of linear inequalities into variables
system of linear inequalities into variablessystem of linear inequalities into variables
system of linear inequalities into variables
Izah Catli
6. 1 graphing quadratics
6. 1 graphing quadratics6. 1 graphing quadratics
6. 1 graphing quadratics
Jessica Garcia
Analytic Geometry Period 1
Analytic Geometry Period 1Analytic Geometry Period 1
Analytic Geometry Period 1
ingroy
LESSON PROPER_04-Graphing linear equations in two variables.pptx
LESSON PROPER_04-Graphing linear equations in two variables.pptxLESSON PROPER_04-Graphing linear equations in two variables.pptx
LESSON PROPER_04-Graphing linear equations in two variables.pptx
roxane47
LESSON PROPER_04-Graphing linear equations in two variables.pptx
LESSON PROPER_04-Graphing linear equations in two variables.pptxLESSON PROPER_04-Graphing linear equations in two variables.pptx
LESSON PROPER_04-Graphing linear equations in two variables.pptx
roxane47
What is Slope?
What is Slope?What is Slope?
What is Slope?
Sharon Warden
Graphing Quadratics
Graphing QuadraticsGraphing Quadratics
Graphing Quadratics
guest35706da
Graphing Quadratics
Graphing QuadraticsGraphing Quadratics
Graphing Quadratics
guest35706da
Solving Quadratic Equations by Graphing
Solving Quadratic Equations by GraphingSolving Quadratic Equations by Graphing
Solving Quadratic Equations by Graphing
DaisyListening
Finding Slope Rise over Run for elementary students
Finding Slope Rise over Run for elementary studentsFinding Slope Rise over Run for elementary students
Finding Slope Rise over Run for elementary students
sawyermickle
Graphing Linear Equations Lesson
Graphing Linear Equations LessonGraphing Linear Equations Lesson
Graphing Linear Equations Lesson
bslkmljsl
Quadratic function in standard form (y = ax^2 +bx + c
Quadratic function in standard form (y = ax^2 +bx + cQuadratic function in standard form (y = ax^2 +bx + c
Quadratic function in standard form (y = ax^2 +bx + c
LiciaMc
FindingSlope.ppt
FindingSlope.pptFindingSlope.ppt
FindingSlope.ppt
ElmabethDelaCruz1
March 18
March 18March 18
March 18
khyps13
Graphing, Slope, And Special Lines
Graphing, Slope, And Special LinesGraphing, Slope, And Special Lines
Graphing, Slope, And Special Lines
kliegey524
Slope and y intercept
Slope and y interceptSlope and y intercept
Slope and y intercept
billingssr
2.2 linear equations and 2.3 Slope
2.2 linear equations and 2.3 Slope2.2 linear equations and 2.3 Slope
2.2 linear equations and 2.3 Slope
Jessica Garcia
Graph linear inequalities
Graph linear inequalities Graph linear inequalities
Graph linear inequalities
AgohaChinonso
system of linear inequalities into variables
system of linear inequalities into variablessystem of linear inequalities into variables
system of linear inequalities into variables
Izah Catli
6. 1 graphing quadratics
6. 1 graphing quadratics6. 1 graphing quadratics
6. 1 graphing quadratics
Jessica Garcia
Analytic Geometry Period 1
Analytic Geometry Period 1Analytic Geometry Period 1
Analytic Geometry Period 1
ingroy
LESSON PROPER_04-Graphing linear equations in two variables.pptx
LESSON PROPER_04-Graphing linear equations in two variables.pptxLESSON PROPER_04-Graphing linear equations in two variables.pptx
LESSON PROPER_04-Graphing linear equations in two variables.pptx
roxane47
LESSON PROPER_04-Graphing linear equations in two variables.pptx
LESSON PROPER_04-Graphing linear equations in two variables.pptxLESSON PROPER_04-Graphing linear equations in two variables.pptx
LESSON PROPER_04-Graphing linear equations in two variables.pptx
roxane47
Graphing Quadratics
Graphing QuadraticsGraphing Quadratics
Graphing Quadratics
guest35706da
Graphing Quadratics
Graphing QuadraticsGraphing Quadratics
Graphing Quadratics
guest35706da
Solving Quadratic Equations by Graphing
Solving Quadratic Equations by GraphingSolving Quadratic Equations by Graphing
Solving Quadratic Equations by Graphing
DaisyListening
Finding Slope Rise over Run for elementary students
Finding Slope Rise over Run for elementary studentsFinding Slope Rise over Run for elementary students
Finding Slope Rise over Run for elementary students
sawyermickle
Graphing Linear Equations Lesson
Graphing Linear Equations LessonGraphing Linear Equations Lesson
Graphing Linear Equations Lesson
bslkmljsl
Quadratic function in standard form (y = ax^2 +bx + c
Quadratic function in standard form (y = ax^2 +bx + cQuadratic function in standard form (y = ax^2 +bx + c
Quadratic function in standard form (y = ax^2 +bx + c
LiciaMc

Recently uploaded (20)

Revolutionizing-Government-Communication-The-OSWAN-Success-Story
Revolutionizing-Government-Communication-The-OSWAN-Success-StoryRevolutionizing-Government-Communication-The-OSWAN-Success-Story
Revolutionizing-Government-Communication-The-OSWAN-Success-Story
ssuser52ad5e
SMART SENTRY CYBER THREAT INTELLIGENCE IN IIOT
SMART SENTRY CYBER THREAT INTELLIGENCE IN IIOTSMART SENTRY CYBER THREAT INTELLIGENCE IN IIOT
SMART SENTRY CYBER THREAT INTELLIGENCE IN IIOT
TanmaiArni
Gojek Clone Multi-Service Super App.pptx
Gojek Clone Multi-Service Super App.pptxGojek Clone Multi-Service Super App.pptx
Gojek Clone Multi-Service Super App.pptx
V3cube
Field Device Management Market Report 2030 - TechSci Research
Field Device Management Market Report 2030 - TechSci ResearchField Device Management Market Report 2030 - TechSci Research
Field Device Management Market Report 2030 - TechSci Research
Vipin Mishra
UiPath Automation Developer Associate Training Series 2025 - Session 1
UiPath Automation Developer Associate Training Series 2025 - Session 1UiPath Automation Developer Associate Training Series 2025 - Session 1
UiPath Automation Developer Associate Training Series 2025 - Session 1
DianaGray10
UiPath Automation Developer Associate Training Series 2025 - Session 2
UiPath Automation Developer Associate Training Series 2025 - Session 2UiPath Automation Developer Associate Training Series 2025 - Session 2
UiPath Automation Developer Associate Training Series 2025 - Session 2
DianaGray10
Brave Browser Crack 1.45.133 Activated 2025
Brave Browser Crack 1.45.133 Activated 2025Brave Browser Crack 1.45.133 Activated 2025
Brave Browser Crack 1.45.133 Activated 2025
kherorpacca00126
Stronger Together: Combining Data Quality and Governance for Confident AI & A...
Stronger Together: Combining Data Quality and Governance for Confident AI & A...Stronger Together: Combining Data Quality and Governance for Confident AI & A...
Stronger Together: Combining Data Quality and Governance for Confident AI & A...
Precisely
Cloud of everything Tech of the 21 century in Aviation
Cloud of everything Tech of the 21 century in AviationCloud of everything Tech of the 21 century in Aviation
Cloud of everything Tech of the 21 century in Aviation
Assem mousa
Future-Proof Your Career with AI Options
Future-Proof Your  Career with AI OptionsFuture-Proof Your  Career with AI Options
Future-Proof Your Career with AI Options
DianaGray10
AIXMOOC 2.3 - Modelli di reti neurali con esperimenti di addestramento
AIXMOOC 2.3 - Modelli di reti neurali con esperimenti di addestramentoAIXMOOC 2.3 - Modelli di reti neurali con esperimenti di addestramento
AIXMOOC 2.3 - Modelli di reti neurali con esperimenti di addestramento
Alessandro Bogliolo
World Information Architecture Day 2025 - UX at a Crossroads
World Information Architecture Day 2025 - UX at a CrossroadsWorld Information Architecture Day 2025 - UX at a Crossroads
World Information Architecture Day 2025 - UX at a Crossroads
Joshua Randall
How Discord Indexes Trillions of Messages: Scaling Search Infrastructure by V...
How Discord Indexes Trillions of Messages: Scaling Search Infrastructure by V...How Discord Indexes Trillions of Messages: Scaling Search Infrastructure by V...
How Discord Indexes Trillions of Messages: Scaling Search Infrastructure by V...
ScyllaDB
Replacing RocksDB with ScyllaDB in Kafka Streams by Almog Gavra
Replacing RocksDB with ScyllaDB in Kafka Streams by Almog GavraReplacing RocksDB with ScyllaDB in Kafka Streams by Almog Gavra
Replacing RocksDB with ScyllaDB in Kafka Streams by Almog Gavra
ScyllaDB
The Future of Repair: Transparent and Incremental by Botond Denes
The Future of Repair: Transparent and Incremental by Botond DenesThe Future of Repair: Transparent and Incremental by Botond Denes
The Future of Repair: Transparent and Incremental by Botond Denes
ScyllaDB
Q4_TLE-7-Lesson-6-Week-6.pptx 4th quarter
Q4_TLE-7-Lesson-6-Week-6.pptx 4th quarterQ4_TLE-7-Lesson-6-Week-6.pptx 4th quarter
Q4_TLE-7-Lesson-6-Week-6.pptx 4th quarter
MariaBarbaraPaglinaw
DevNexus - Building 10x Development Organizations.pdf
DevNexus - Building 10x Development Organizations.pdfDevNexus - Building 10x Development Organizations.pdf
DevNexus - Building 10x Development Organizations.pdf
Justin Reock
Integrated Operating Window - A Gateway to PM
Integrated Operating Window - A Gateway to PMIntegrated Operating Window - A Gateway to PM
Integrated Operating Window - A Gateway to PM
Farhan Tariq
Backstage Software Templates for Java Developers
Backstage Software Templates for Java DevelopersBackstage Software Templates for Java Developers
Backstage Software Templates for Java Developers
Markus Eisele
L01 Introduction to Nanoindentation - What is hardness
L01 Introduction to Nanoindentation - What is hardnessL01 Introduction to Nanoindentation - What is hardness
L01 Introduction to Nanoindentation - What is hardness
RostislavDaniel
Revolutionizing-Government-Communication-The-OSWAN-Success-Story
Revolutionizing-Government-Communication-The-OSWAN-Success-StoryRevolutionizing-Government-Communication-The-OSWAN-Success-Story
Revolutionizing-Government-Communication-The-OSWAN-Success-Story
ssuser52ad5e
SMART SENTRY CYBER THREAT INTELLIGENCE IN IIOT
SMART SENTRY CYBER THREAT INTELLIGENCE IN IIOTSMART SENTRY CYBER THREAT INTELLIGENCE IN IIOT
SMART SENTRY CYBER THREAT INTELLIGENCE IN IIOT
TanmaiArni
Gojek Clone Multi-Service Super App.pptx
Gojek Clone Multi-Service Super App.pptxGojek Clone Multi-Service Super App.pptx
Gojek Clone Multi-Service Super App.pptx
V3cube
Field Device Management Market Report 2030 - TechSci Research
Field Device Management Market Report 2030 - TechSci ResearchField Device Management Market Report 2030 - TechSci Research
Field Device Management Market Report 2030 - TechSci Research
Vipin Mishra
UiPath Automation Developer Associate Training Series 2025 - Session 1
UiPath Automation Developer Associate Training Series 2025 - Session 1UiPath Automation Developer Associate Training Series 2025 - Session 1
UiPath Automation Developer Associate Training Series 2025 - Session 1
DianaGray10
UiPath Automation Developer Associate Training Series 2025 - Session 2
UiPath Automation Developer Associate Training Series 2025 - Session 2UiPath Automation Developer Associate Training Series 2025 - Session 2
UiPath Automation Developer Associate Training Series 2025 - Session 2
DianaGray10
Brave Browser Crack 1.45.133 Activated 2025
Brave Browser Crack 1.45.133 Activated 2025Brave Browser Crack 1.45.133 Activated 2025
Brave Browser Crack 1.45.133 Activated 2025
kherorpacca00126
Stronger Together: Combining Data Quality and Governance for Confident AI & A...
Stronger Together: Combining Data Quality and Governance for Confident AI & A...Stronger Together: Combining Data Quality and Governance for Confident AI & A...
Stronger Together: Combining Data Quality and Governance for Confident AI & A...
Precisely
Cloud of everything Tech of the 21 century in Aviation
Cloud of everything Tech of the 21 century in AviationCloud of everything Tech of the 21 century in Aviation
Cloud of everything Tech of the 21 century in Aviation
Assem mousa
Future-Proof Your Career with AI Options
Future-Proof Your  Career with AI OptionsFuture-Proof Your  Career with AI Options
Future-Proof Your Career with AI Options
DianaGray10
AIXMOOC 2.3 - Modelli di reti neurali con esperimenti di addestramento
AIXMOOC 2.3 - Modelli di reti neurali con esperimenti di addestramentoAIXMOOC 2.3 - Modelli di reti neurali con esperimenti di addestramento
AIXMOOC 2.3 - Modelli di reti neurali con esperimenti di addestramento
Alessandro Bogliolo
World Information Architecture Day 2025 - UX at a Crossroads
World Information Architecture Day 2025 - UX at a CrossroadsWorld Information Architecture Day 2025 - UX at a Crossroads
World Information Architecture Day 2025 - UX at a Crossroads
Joshua Randall
How Discord Indexes Trillions of Messages: Scaling Search Infrastructure by V...
How Discord Indexes Trillions of Messages: Scaling Search Infrastructure by V...How Discord Indexes Trillions of Messages: Scaling Search Infrastructure by V...
How Discord Indexes Trillions of Messages: Scaling Search Infrastructure by V...
ScyllaDB
Replacing RocksDB with ScyllaDB in Kafka Streams by Almog Gavra
Replacing RocksDB with ScyllaDB in Kafka Streams by Almog GavraReplacing RocksDB with ScyllaDB in Kafka Streams by Almog Gavra
Replacing RocksDB with ScyllaDB in Kafka Streams by Almog Gavra
ScyllaDB
The Future of Repair: Transparent and Incremental by Botond Denes
The Future of Repair: Transparent and Incremental by Botond DenesThe Future of Repair: Transparent and Incremental by Botond Denes
The Future of Repair: Transparent and Incremental by Botond Denes
ScyllaDB
Q4_TLE-7-Lesson-6-Week-6.pptx 4th quarter
Q4_TLE-7-Lesson-6-Week-6.pptx 4th quarterQ4_TLE-7-Lesson-6-Week-6.pptx 4th quarter
Q4_TLE-7-Lesson-6-Week-6.pptx 4th quarter
MariaBarbaraPaglinaw
DevNexus - Building 10x Development Organizations.pdf
DevNexus - Building 10x Development Organizations.pdfDevNexus - Building 10x Development Organizations.pdf
DevNexus - Building 10x Development Organizations.pdf
Justin Reock
Integrated Operating Window - A Gateway to PM
Integrated Operating Window - A Gateway to PMIntegrated Operating Window - A Gateway to PM
Integrated Operating Window - A Gateway to PM
Farhan Tariq
Backstage Software Templates for Java Developers
Backstage Software Templates for Java DevelopersBackstage Software Templates for Java Developers
Backstage Software Templates for Java Developers
Markus Eisele
L01 Introduction to Nanoindentation - What is hardness
L01 Introduction to Nanoindentation - What is hardnessL01 Introduction to Nanoindentation - What is hardness
L01 Introduction to Nanoindentation - What is hardness
RostislavDaniel

4 ~ manale mourdi ~ chapter 4 outstanding project math

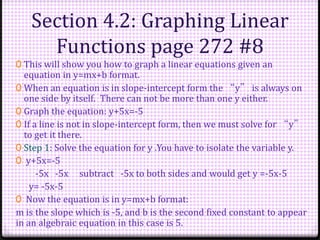
  • 2. Section 4.2: Graphing Linear Functions page 272 #8 0 This will show you how to graph a linear equations given an equation in y=mx+b format. 0 When an equation is in slope-intercept form the y is always on one side by itself. There can not be more than one y either. 0 Graph the equation: y+5x=-5 0 If a line is not in slope-intercept form, then we must solve for y to get it there. 0 Step 1: Solve the equation for y .You have to isolate the variable y. 0 y+5x=-5 -5x -5x subtract -5x to both sides and would get y =-5x-5 y= -5x-5 0 Now the equation is in y=mx+b format: m is the slope which is -5, and b is the second fixed constant to appear in an algebraic equation in this case is 5.
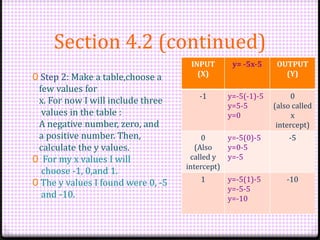
  • 3. Section 4.2 (continued) 0 Step 2: Make a table,choose a few values for x. For now I will include three values in the table : A negative number, zero, and a positive number. Then, calculate the y values. 0 For my x values I will choose -1, 0,and 1. 0 The y values I found were 0, -5 and -10. INPUT (X) y= -5x-5 OUTPUT (Y) -1 y=-5(-1)-5 y=5-5 y=0 0 (also called x intercept) 0 (Also called y intercept) y=-5(0)-5 y=0-5 y=-5 -5 1 y=-5(1)-5 y=-5-5 y=-10 -10
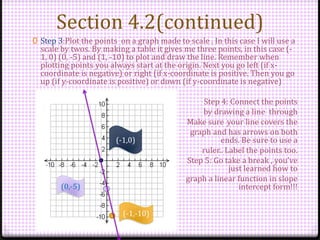
  • 4. Section 4.2(continued) 0 Step 3:Plot the points on a graph made to scale . In this case I will use a scale by twos. By making a table it gives me three points, in this case (- 1, 0) (0, -5) and (1, -10) to plot and draw the line. Remember when plotting points you always start at the origin. Next you go left (if x- coordinate is negative) or right (if x-coordinate is positive. Then you go up (if y-coordinate is positive) or down (if y-coordinate is negative) Step 4: Connect the points by drawing a line through Make sure your line covers the graph and has arrows on both ends. Be sure to use a ruler.. Label the points too. Step 5: Go take a break , youve just learned how to graph a linear function in slope intercept form!!! (-1,0) (0,-5) (-1,-10)
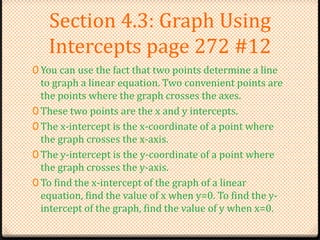
  • 5. Section 4.3: Graph Using Intercepts page 272 #12 0 You can use the fact that two points determine a line to graph a linear equation. Two convenient points are the points where the graph crosses the axes. 0 These two points are the x and y intercepts. 0 The x-intercept is the x-coordinate of a point where the graph crosses the x-axis. 0 The y-intercept is the y-coordinate of a point where the graph crosses the y-axis. 0 To find the x-intercept of the graph of a linear equation, find the value of x when y=0. To find the y- intercept of the graph, find the value of y when x=0.
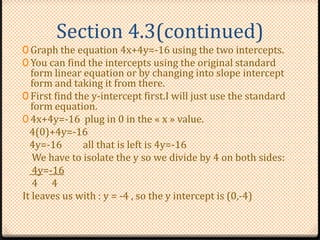
  • 6. Section 4.3(continued) 0 Graph the equation 4x+4y=-16 using the two intercepts. 0 You can find the intercepts using the original standard form linear equation or by changing into slope intercept form and taking it from there. 0 First find the y-intercept first.I will just use the standard form equation. 0 4x+4y=-16 plug in 0 in the 束 x 損 value. 4(0)+4y=-16 4y=-16 all that is left is 4y=-16 We have to isolate the y so we divide by 4 on both sides: 4y=-16 4 4 It leaves us with : y = -4 , so the y intercept is (0,-4)
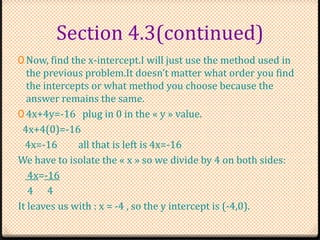
  • 7. Section 4.3(continued) 0 Now, find the x-intercept.I will just use the method used in the previous problem.It doesnt matter what order you find the intercepts or what method you choose because the answer remains the same. 0 4x+4y=-16 plug in 0 in the 束 y 損 value. 4x+4(0)=-16 4x=-16 all that is left is 4x=-16 We have to isolate the 束 x 損 so we divide by 4 on both sides: 4x=-16 4 4 It leaves us with : x = -4 , so the y intercept is (-4,0).
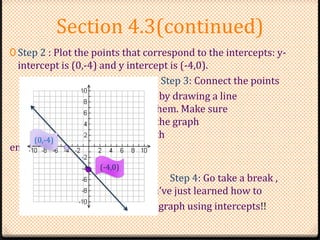
  • 8. Section 4.3(continued) 0 Step 2 : Plot the points that correspond to the intercepts: y- intercept is (0,-4) and y intercept is (-4,0). Step 3: Connect the points by drawing a line t through them. Make sure your line covers the graph and has arrows on both ends. Be sure to use a ruler. Step 4: Go take a break , youve just learned how to graph using intercepts!! (0,-4) (-4,0)
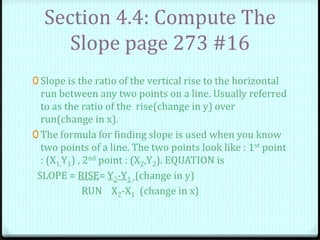
  • 9. Section 4.4: Compute The Slope page 273 #16 0 Slope is the ratio of the vertical rise to the horizontal run between any two points on a line. Usually referred to as the ratio of the rise(change in y) over run(change in x). 0 The formula for finding slope is used when you know two points of a line. The two points look like : 1st point : (X1,Y1) , 2nd point : (X2,Y2). EQUATION is SLOPE = RISE= Y2-Y1 (change in y) RUN X2-X1 (change in x)
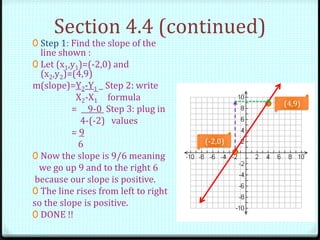
  • 10. Section 4.4 (continued) 0 Step 1: Find the slope of the line shown : 0 Let (x1,y1)=(-2,0) and (x2,y2)=(4,9) m(slope)=Y2-Y1 Step 2: write X2-X1 formula = 9-0 Step 3: plug in 4-(-2) values = 9 6 0 Now the slope is 9/6 meaning we go up 9 and to the right 6 because our slope is positive. 0 The line rises from left to right so the slope is positive. 0 DONE !! (4,9) (-2,0)
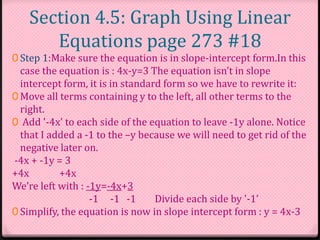
  • 11. Section 4.5: Graph Using Linear Equations page 273 #18 0 Step 1:Make sure the equation is in slope-intercept form.In this case the equation is : 4x-y=3 The equation isnt in slope intercept form, it is in standard form so we have to rewrite it: 0 Move all terms containing y to the left, all other terms to the right. 0 Add '-4x' to each side of the equation to leave -1y alone. Notice that I added a -1 to the y because we will need to get rid of the negative later on. -4x + -1y = 3 +4x +4x Were left with : -1y=-4x+3 -1 -1 -1 Divide each side by '-1 0 Simplify, the equation is now in slope intercept form : y = 4x-3
  • 12. Section 4.5 (continued) 0 Step 2 : Identify the slope and y-intercept. Since the equation is y = 4x-3, we can easily identify the y intercept which is in this case (0,-3) because when you plug in 0 to the xs spot, y= -3.Instead of doing all this work just look at b which is the second fixed constant to appear in this equation. 0 The slope is -4 or -4 over 1 meaning you go down four and to the right one.
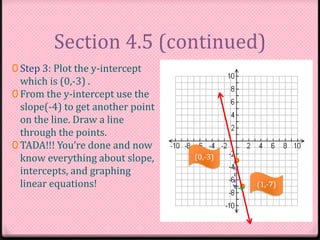
  • 13. Section 4.5 (continued) 0 Step 3: Plot the y-intercept which is (0,-3) . 0 From the y-intercept use the slope(-4) to get another point on the line. Draw a line through the points. 0 TADA!!! Youre done and now know everything about slope, intercepts, and graphing linear equations! (0,-3) (1,-7)
  • 14. Thanks For Watching !! You just learned the basics of GRAPHING LINEAR EQUATIONS AND FUNCTIONS!!!