7.2 estimate mu, sigma unknown
Download as pptx, pdf1 like1,434 views
1. When estimating a population mean ╬╝, if the population standard deviation Žā is unknown, a Student's t-distribution is used instead of the normal distribution. 2. The Student's t-distribution depends on sample size, with smaller sample sizes resulting in a distribution with thicker tails than the normal. 3. To construct a confidence interval for a population mean ╬╝ when Žā is unknown, the sample mean x-bar, sample standard deviation s, confidence level c, and degrees of freedom are used to determine the critical value t_c from a Student's t-distribution table. The confidence interval is given by x-bar ┬▒ t_
1 of 14
Downloaded 14 times

Ad
Recommended
Statatics
StataticsShrayansh Jain
╠²
This document discusses key concepts in statistics:
- Statistics analyze whether data is meaningful by using techniques based on probability statements, as nothing is ever truly proved with statistics alone.
- Common measures include the mean, median, and mode.
- Frequency distributions and histograms are used to visualize the distribution of data values or categories.
- Formulas are provided for calculating the mean, median, and mode from raw data or a frequency table.
- Proper interpretation of statistics requires close examination of data and drawing independent conclusions, as numbers can be manipulated and most statistics are not reliable.Sampling theory
Sampling theorySonali Srivastava
╠²
The document defines key terms related to populations and samples, including that a population is the total set of measurements of interest while a sample is a subset of the population. It also defines target population, sampling unit, sampling frame, and sampling scheme. The document is divided into 5 sections and provides formulas for calculating sample size for quantitative and qualitative samples based on desired confidence level, margin of error, variance, and proportions.Statistics and probability lesson5
Statistics and probability lesson5MARIA CHRISTITA POLINAG
╠²
The document discusses different methods for presenting data, including textual or narrative presentation, tabular presentation, and graphical presentation. It provides details on constructing frequency distribution tables, including identifying the range and number of classes, calculating class size, and tallying data. Frequency distribution tables show the distribution of data values and can include additional details like class marks, relative frequencies, and cumulative frequencies. Bar graphs are also discussed as a way to visually present the data in a frequency distribution table.Review on probability distributions, estimation and hypothesis testing
Review on probability distributions, estimation and hypothesis testingMeselu Mellaku
╠²
This document provides an overview of probability distributions, estimation, and hypothesis testing. It discusses key concepts such as:
- Common discrete and continuous probability distributions including binomial, Poisson, normal, uniform, and exponential.
- Estimation techniques including point estimates, confidence intervals for means and proportions.
- Hypothesis testing frameworks including stating null and alternative hypotheses, determining test statistics, critical values, and statistical decisions.
- Specific hypothesis tests are described for means when the population standard deviation is known or unknown.
The document is intended as a review of these statistical concepts and includes sample test questions to help with learning.Lesson 5 data presentation
Lesson 5 data presentationMaris Ganace
╠²
The document discusses different methods for presenting data, including textual, tabular, and graphical presentations. It provides examples and guidelines for each method, such as describing highlights in a paragraph, organizing values into a table with rows and columns, and using graphs like pie charts to visualize relationships. Frequency distribution tables and histograms are also covered as specialized forms of tabular and graphical presentation used to depict the distribution of quantitative data.Frequency Distributions
Frequency Distributionsjasondroesch
╠²
The PowerPoint lecture covers frequency distributions as essential tools in statistics, including how to organize data into frequency distribution tables and interpret them, both in tabular and graphical forms. It discusses the importance of proportions, percentages, and the differences in constructing frequency distributions for discrete and continuous variables, along with guidelines for grouped frequency distributions. Additionally, it provides insights into the graphical representation of data, explaining various types of graphs such as histograms and polygons, along with their respective uses and accurate interpretations.Sampling theory
Sampling theoryDIPTENDU BASU
╠²
This document provides an overview of sampling theory and statistical analysis. It discusses different sampling methods, important sampling terms, and statistical tests. The key points are:
1) There are two ways to collect statistical data - a complete enumeration (census) or a sample survey. A sample is a portion of a population that is examined to estimate population characteristics.
2) Common sampling methods include simple random sampling, systematic sampling, stratified sampling, cluster sampling, quota sampling, and purposive sampling.
3) Important terms include parameters, statistics, sampling distributions, and statistical inferences about populations based on sample data.
4) Statistical tests covered include hypothesis testing, types of errors, test statistics, critical values,Lect w4 Lect w3 estimation
Lect w4 Lect w3 estimationRione Drevale
╠²
This document summarizes a lecture on estimation and hypothesis testing. It discusses estimating population means using sample data when the population standard deviation is both known and unknown. When the standard deviation is known, the sample mean is used as a point estimate for the population mean. When it is unknown, a Student's t-distribution is used instead of the normal distribution. The document provides examples of finding confidence intervals for population means using sample data and the Student's t-distribution.Statistic
StatisticWardatul Hasanah
╠²
This document contains information about statistics concepts such as range, classes width, and frequency distributions. It provides examples and formulas for calculating range as the difference between maximum and minimum values. It explains that class width is the difference between upper and lower class limits and how to calculate it. It also describes the five types of frequency distributions - absolute, relative, cumulative, relative cumulative, and grouped - and provides examples of each.Chapter 3
Chapter 3Mong Mara
╠²
This chapter discusses measures of central tendency, dispersion, and position. It defines statistics, parameters, population and sample means, medians, modes, and weighted means. It discusses estimating means and medians for grouped data using class midpoints and boundaries. Examples are provided to demonstrate calculating measures for raw data and frequency distributions. Measures of variability like range, mean deviation, variance, and standard deviation are also introduced.7. the t distribution
7. the t distributionONE Virtual Services
╠²
The document provides an overview of the t-distribution, detailing its characteristics, formula, and application in statistical analysis with small sample sizes. It explains how to calculate critical values and test statistics while using examples to illustrate comparisons between means in different scenarios. The text concludes with procedures for identifying percentiles and using t-tables effectively.Chapter 2 250110 083240
Chapter 2 250110 083240guest25d353
╠²
This document discusses frequency distributions and graphs. It defines frequency distributions as organizing raw data into a table using classes and frequencies. There are three main types: categorical, grouped, and ungrouped. Guidelines are provided for constructing frequency distributions, such as having 5-20 classes of equal width. Common graphs discussed are histograms, frequency polygons, ogives, Pareto charts, time series graphs, and pie charts. These graphs represent frequency distributions in visual formats.Chapter 3: Prsentation of Data
Chapter 3: Prsentation of DataAndrilyn Alcantara
╠²
This document discusses different methods for presenting data, including textual, tabular, and graphical presentations. Tabular presentations include frequency distribution tables that are ungrouped, grouped, simple, and complete. Graphical presentations include bar charts, histograms, frequency polygons, pie charts, and pictographs to visually depict quantitative data using bars, rectangles, lines, circles, or pictures. The examples provided demonstrate how to construct different types of tables and graphs for a set of sample data.2.1 frequency distributions, histograms, and related topics
2.1 frequency distributions, histograms, and related topicsleblance
╠²
The document discusses frequency distributions and related topics such as histograms and ogives. It explains how to construct a frequency table by determining classes, tallying data, calculating frequencies and relative frequencies, and finding class boundaries and midpoints. It then describes how to make histograms and relative frequency histograms based on the frequency table. Finally, it discusses different distribution shapes that histograms may take on such as mound-shaped, uniform, skewed, bimodal, and outliers, as well as how to make an ogive graph of cumulative frequencies.Cumulative Frequency
Cumulative FrequencyDr. Amjad Ali Arain
╠²
This document discusses cumulative frequency distribution. It defines cumulative frequency as the frequency of occurrence of values less than a reference value. The document outlines how to build a cumulative frequency distribution table from a frequency table or histogram by summing the frequencies in each class. Cumulative frequency analysis is used to understand how often a phenomenon is below a certain value and can help in describing situations or planning interventions.L1 flashcards quantitative methods (ss3)
L1 flashcards quantitative methods (ss3)analystbuddy
╠²
There are two types of random variables: discrete and continuous. A probability distribution can be viewed as a probability function or cumulative distribution function (CDF). Properties of these include being between 0 and 1 and the CDF non-decreasing. Binomial and Bernoulli distributions relate to binary outcomes. The normal distribution is widely used in portfolio theory and risk management. Monte Carlo simulation uses probability distributions to generate random samples for modeling complex financial systems.sampling distribution
sampling distributionMmedsc Hahm
╠²
1. The sampling distribution is the distribution of all possible values that can be assumed by some statistic computed from samples of the same size randomly drawn from the same population.
2. To construct a sampling distribution, all possible samples of a given size are drawn from the population and the statistic is computed for each sample. The distinct observed values and their frequencies are listed.
3. According to the central limit theorem, the sampling distribution of the sample mean will be approximately normally distributed for large sample sizes, regardless of the population distribution.Frequency Distribution
Frequency DistributionDr. Amjad Ali Arain
╠²
The document discusses frequency and frequency distributions, which designate the number of occurrences of events per unit time and organize outcomes in various samples, respectively. It explains different types of frequency distributions, such as relative and cumulative frequency distributions, and provides examples using frequency tables and tally marks. The document illustrates how frequency data can be effectively summarized and understood through graphical representation.The t Test for Two Independent Samples
The t Test for Two Independent Samplesjasondroesch
╠²
Chapter 10 discusses the independent-measures t-test for comparing two populations or treatments using statistical methods. Key topics include the formulation of hypotheses, the calculation of the t statistic, the use of pooled variance, and effect size measurement. The chapter also covers assumptions of the test and the importance of interpreting results in research contexts.Chapter 02
Chapter 02bmcfad01
╠²
The document discusses methods for organizing and presenting both qualitative and quantitative data, including frequency tables, bar charts, pie charts, and different types of frequency distributions. It provides examples of how to construct a frequency table by determining the number of classes, class intervals, and class limits based on a set of data. It also describes how to create histograms, frequency polygons, and cumulative frequency distributions to graphically display a frequency distribution and highlights key terms such as class frequency, class interval, and relative frequency.Mod mean quartile
Mod mean quartileMaher Faisal Razi
╠²
1. The document discusses various measures of central tendency including mode, median, and quartiles.
2. Mode is the most frequent value in a data set. Median divides the data set into two equal halves. Quartiles divide the data set into four equal groups.
3. The document provides formulas and examples for calculating mode, median, and quartiles for both grouped and ungrouped data sets. Advantages and disadvantages of each measure are also discussed.Quartile Deviation
Quartile DeviationChristian Sisles Gle
╠²
This document discusses the calculation of quartile deviation from both ungrouped and grouped data. It defines quartiles as values that divide a data distribution into four equal parts (Q1, Q2, Q3). The quartile deviation is half the difference between the first (Q1) and third (Q3) quartiles. It provides the steps to find Q1, Q3, and quartile deviation from ungrouped data by ranking scores and using quartile locators. For grouped data, it uses formulas involving class limits and cumulative frequencies to determine Q1 and Q3, then takes half their difference. An example calculation is shown.Sampling Theory Part 2
Sampling Theory Part 2FellowBuddy.com
╠²
This document discusses different sampling methods including probability sampling methods (such as simple random sampling, stratified random sampling, and multistage sampling), non-probability sampling methods (such as judgment sampling), and mixed sampling methods. It provides examples and definitions of each method type. Simple random sampling involves an equal chance of selection, while stratified random sampling divides the population into homogeneous groups before sampling. Multistage sampling involves multiple stages of sampling units. Non-probability sampling relies on the sampler's judgment.Construction of a frequency table
Construction of a frequency tableMark Santos
╠²
The document provides steps for constructing a frequency table from a set of test score data: 1) Compute the range and class interval size, 2) Set up the table with class intervals, 3) Tally the observations in each interval and compute frequencies, 4) Compute cumulative and relative frequencies. An example is provided using 30 test scores ranging from 76 to 99 grouped into intervals of size 4.Bca admission in india
Bca admission in indiaEdhole.com
╠²
This document discusses confidence intervals and how they can be used to estimate population parameters from sample data. It provides the following key points:
- Confidence intervals provide a range of values that is likely to include an unknown population parameter, unlike a point estimate which is a single value. They indicate the reliability of an estimate.
- The formula for a confidence interval of a population mean takes the sample mean and adds/subtracts a critical value times the standard error.
- When the population standard deviation is unknown, the student's t-distribution must be used instead of the normal distribution, as it accounts for the extra uncertainty of estimating the standard deviation from a sample.
- Sample size calculations can determine theW1002 MATHS ASSIGNMENT, BBA
W1002 MATHS ASSIGNMENT, BBAAfrah A.Sheikh AL HUSSAN INSTITUTE & LADIES TRAINING CENTRE
╠²
This document contains a student's math assignment on cumulative frequency curves and data representation. It includes:
1) An introduction to cumulative frequency curves, how they are calculated and constructed, and their advantages for estimating values like the median.
2) An example of constructing a cumulative frequency curve based on student quiz completion times. It demonstrates how to estimate values from the curve.
3) Explanations of how to calculate the median and quartiles from a cumulative frequency curve or data set.
4) A section on different types of graphs to represent data, including histograms, bar charts, pie charts, and their uses and construction.STATS_Q4_1.powerpoint presentation in....
STATS_Q4_1.powerpoint presentation in....jayarvidor5
╠²
The document outlines session objectives related to statistics and probability, specifically focusing on point and interval estimations for population parameters. It explains the concepts of point estimation, confidence intervals, and the t-distribution with examples illustrating how to compute estimates and confidence intervals under various conditions. Additionally, it emphasizes the importance of identifying regions under the t-distribution and calculating margins of error for better approximation of population means.Estimating a Population Mean in Confidence Intervals
Estimating a Population Mean in Confidence IntervalsCrystal Hollis
╠²
The presentation covers estimating a population mean using ratio identities, focusing on obtaining point estimates, understanding the student's t-distribution, determining t-values, and creating confidence intervals. It explains the historical context of the t-distribution and its properties, which enhance the accuracy of statistical inferences for small samples. Additionally, it outlines methods to calculate the required sample size for estimating a population mean within a specified margin of error.Confidence Intervals
Confidence Intervalsmandalina landy
╠²
This document discusses confidence intervals for population means and proportions. It explains how to construct confidence intervals using the normal distribution for large sample sizes (n Ōēź 30) and the t-distribution for small sample sizes. Formulas are provided for calculating margin of error and determining necessary sample size. Guidelines are given for determining whether to use the normal or t-distribution based on sample size and characteristics. Confidence intervals can be constructed for variance and standard deviation using the chi-square distribution.M1-4 Estimasi Titik dan Intervaltttt.pptx
M1-4 Estimasi Titik dan Intervaltttt.pptxAgus Setiawan
╠²
The document discusses point and interval estimation in statistics, emphasizing how to estimate unknown population parameters using sample data. It elaborates on the concepts of point estimation, which provides a single value, and interval estimation, which offers a range of values around a target parameter. Additionally, it covers both large-sample and small-sample confidence intervals, along with practical examples and calculations for determining sample sizes.More Related Content
What's hot (18)
Statistic
StatisticWardatul Hasanah
╠²
This document contains information about statistics concepts such as range, classes width, and frequency distributions. It provides examples and formulas for calculating range as the difference between maximum and minimum values. It explains that class width is the difference between upper and lower class limits and how to calculate it. It also describes the five types of frequency distributions - absolute, relative, cumulative, relative cumulative, and grouped - and provides examples of each.Chapter 3
Chapter 3Mong Mara
╠²
This chapter discusses measures of central tendency, dispersion, and position. It defines statistics, parameters, population and sample means, medians, modes, and weighted means. It discusses estimating means and medians for grouped data using class midpoints and boundaries. Examples are provided to demonstrate calculating measures for raw data and frequency distributions. Measures of variability like range, mean deviation, variance, and standard deviation are also introduced.7. the t distribution
7. the t distributionONE Virtual Services
╠²
The document provides an overview of the t-distribution, detailing its characteristics, formula, and application in statistical analysis with small sample sizes. It explains how to calculate critical values and test statistics while using examples to illustrate comparisons between means in different scenarios. The text concludes with procedures for identifying percentiles and using t-tables effectively.Chapter 2 250110 083240
Chapter 2 250110 083240guest25d353
╠²
This document discusses frequency distributions and graphs. It defines frequency distributions as organizing raw data into a table using classes and frequencies. There are three main types: categorical, grouped, and ungrouped. Guidelines are provided for constructing frequency distributions, such as having 5-20 classes of equal width. Common graphs discussed are histograms, frequency polygons, ogives, Pareto charts, time series graphs, and pie charts. These graphs represent frequency distributions in visual formats.Chapter 3: Prsentation of Data
Chapter 3: Prsentation of DataAndrilyn Alcantara
╠²
This document discusses different methods for presenting data, including textual, tabular, and graphical presentations. Tabular presentations include frequency distribution tables that are ungrouped, grouped, simple, and complete. Graphical presentations include bar charts, histograms, frequency polygons, pie charts, and pictographs to visually depict quantitative data using bars, rectangles, lines, circles, or pictures. The examples provided demonstrate how to construct different types of tables and graphs for a set of sample data.2.1 frequency distributions, histograms, and related topics
2.1 frequency distributions, histograms, and related topicsleblance
╠²
The document discusses frequency distributions and related topics such as histograms and ogives. It explains how to construct a frequency table by determining classes, tallying data, calculating frequencies and relative frequencies, and finding class boundaries and midpoints. It then describes how to make histograms and relative frequency histograms based on the frequency table. Finally, it discusses different distribution shapes that histograms may take on such as mound-shaped, uniform, skewed, bimodal, and outliers, as well as how to make an ogive graph of cumulative frequencies.Cumulative Frequency
Cumulative FrequencyDr. Amjad Ali Arain
╠²
This document discusses cumulative frequency distribution. It defines cumulative frequency as the frequency of occurrence of values less than a reference value. The document outlines how to build a cumulative frequency distribution table from a frequency table or histogram by summing the frequencies in each class. Cumulative frequency analysis is used to understand how often a phenomenon is below a certain value and can help in describing situations or planning interventions.L1 flashcards quantitative methods (ss3)
L1 flashcards quantitative methods (ss3)analystbuddy
╠²
There are two types of random variables: discrete and continuous. A probability distribution can be viewed as a probability function or cumulative distribution function (CDF). Properties of these include being between 0 and 1 and the CDF non-decreasing. Binomial and Bernoulli distributions relate to binary outcomes. The normal distribution is widely used in portfolio theory and risk management. Monte Carlo simulation uses probability distributions to generate random samples for modeling complex financial systems.sampling distribution
sampling distributionMmedsc Hahm
╠²
1. The sampling distribution is the distribution of all possible values that can be assumed by some statistic computed from samples of the same size randomly drawn from the same population.
2. To construct a sampling distribution, all possible samples of a given size are drawn from the population and the statistic is computed for each sample. The distinct observed values and their frequencies are listed.
3. According to the central limit theorem, the sampling distribution of the sample mean will be approximately normally distributed for large sample sizes, regardless of the population distribution.Frequency Distribution
Frequency DistributionDr. Amjad Ali Arain
╠²
The document discusses frequency and frequency distributions, which designate the number of occurrences of events per unit time and organize outcomes in various samples, respectively. It explains different types of frequency distributions, such as relative and cumulative frequency distributions, and provides examples using frequency tables and tally marks. The document illustrates how frequency data can be effectively summarized and understood through graphical representation.The t Test for Two Independent Samples
The t Test for Two Independent Samplesjasondroesch
╠²
Chapter 10 discusses the independent-measures t-test for comparing two populations or treatments using statistical methods. Key topics include the formulation of hypotheses, the calculation of the t statistic, the use of pooled variance, and effect size measurement. The chapter also covers assumptions of the test and the importance of interpreting results in research contexts.Chapter 02
Chapter 02bmcfad01
╠²
The document discusses methods for organizing and presenting both qualitative and quantitative data, including frequency tables, bar charts, pie charts, and different types of frequency distributions. It provides examples of how to construct a frequency table by determining the number of classes, class intervals, and class limits based on a set of data. It also describes how to create histograms, frequency polygons, and cumulative frequency distributions to graphically display a frequency distribution and highlights key terms such as class frequency, class interval, and relative frequency.Mod mean quartile
Mod mean quartileMaher Faisal Razi
╠²
1. The document discusses various measures of central tendency including mode, median, and quartiles.
2. Mode is the most frequent value in a data set. Median divides the data set into two equal halves. Quartiles divide the data set into four equal groups.
3. The document provides formulas and examples for calculating mode, median, and quartiles for both grouped and ungrouped data sets. Advantages and disadvantages of each measure are also discussed.Quartile Deviation
Quartile DeviationChristian Sisles Gle
╠²
This document discusses the calculation of quartile deviation from both ungrouped and grouped data. It defines quartiles as values that divide a data distribution into four equal parts (Q1, Q2, Q3). The quartile deviation is half the difference between the first (Q1) and third (Q3) quartiles. It provides the steps to find Q1, Q3, and quartile deviation from ungrouped data by ranking scores and using quartile locators. For grouped data, it uses formulas involving class limits and cumulative frequencies to determine Q1 and Q3, then takes half their difference. An example calculation is shown.Sampling Theory Part 2
Sampling Theory Part 2FellowBuddy.com
╠²
This document discusses different sampling methods including probability sampling methods (such as simple random sampling, stratified random sampling, and multistage sampling), non-probability sampling methods (such as judgment sampling), and mixed sampling methods. It provides examples and definitions of each method type. Simple random sampling involves an equal chance of selection, while stratified random sampling divides the population into homogeneous groups before sampling. Multistage sampling involves multiple stages of sampling units. Non-probability sampling relies on the sampler's judgment.Construction of a frequency table
Construction of a frequency tableMark Santos
╠²
The document provides steps for constructing a frequency table from a set of test score data: 1) Compute the range and class interval size, 2) Set up the table with class intervals, 3) Tally the observations in each interval and compute frequencies, 4) Compute cumulative and relative frequencies. An example is provided using 30 test scores ranging from 76 to 99 grouped into intervals of size 4.Bca admission in india
Bca admission in indiaEdhole.com
╠²
This document discusses confidence intervals and how they can be used to estimate population parameters from sample data. It provides the following key points:
- Confidence intervals provide a range of values that is likely to include an unknown population parameter, unlike a point estimate which is a single value. They indicate the reliability of an estimate.
- The formula for a confidence interval of a population mean takes the sample mean and adds/subtracts a critical value times the standard error.
- When the population standard deviation is unknown, the student's t-distribution must be used instead of the normal distribution, as it accounts for the extra uncertainty of estimating the standard deviation from a sample.
- Sample size calculations can determine theW1002 MATHS ASSIGNMENT, BBA
W1002 MATHS ASSIGNMENT, BBAAfrah A.Sheikh AL HUSSAN INSTITUTE & LADIES TRAINING CENTRE
╠²
This document contains a student's math assignment on cumulative frequency curves and data representation. It includes:
1) An introduction to cumulative frequency curves, how they are calculated and constructed, and their advantages for estimating values like the median.
2) An example of constructing a cumulative frequency curve based on student quiz completion times. It demonstrates how to estimate values from the curve.
3) Explanations of how to calculate the median and quartiles from a cumulative frequency curve or data set.
4) A section on different types of graphs to represent data, including histograms, bar charts, pie charts, and their uses and construction.Similar to 7.2 estimate mu, sigma unknown (20)
STATS_Q4_1.powerpoint presentation in....
STATS_Q4_1.powerpoint presentation in....jayarvidor5
╠²
The document outlines session objectives related to statistics and probability, specifically focusing on point and interval estimations for population parameters. It explains the concepts of point estimation, confidence intervals, and the t-distribution with examples illustrating how to compute estimates and confidence intervals under various conditions. Additionally, it emphasizes the importance of identifying regions under the t-distribution and calculating margins of error for better approximation of population means.Estimating a Population Mean in Confidence Intervals
Estimating a Population Mean in Confidence IntervalsCrystal Hollis
╠²
The presentation covers estimating a population mean using ratio identities, focusing on obtaining point estimates, understanding the student's t-distribution, determining t-values, and creating confidence intervals. It explains the historical context of the t-distribution and its properties, which enhance the accuracy of statistical inferences for small samples. Additionally, it outlines methods to calculate the required sample size for estimating a population mean within a specified margin of error.Confidence Intervals
Confidence Intervalsmandalina landy
╠²
This document discusses confidence intervals for population means and proportions. It explains how to construct confidence intervals using the normal distribution for large sample sizes (n Ōēź 30) and the t-distribution for small sample sizes. Formulas are provided for calculating margin of error and determining necessary sample size. Guidelines are given for determining whether to use the normal or t-distribution based on sample size and characteristics. Confidence intervals can be constructed for variance and standard deviation using the chi-square distribution.M1-4 Estimasi Titik dan Intervaltttt.pptx
M1-4 Estimasi Titik dan Intervaltttt.pptxAgus Setiawan
╠²
The document discusses point and interval estimation in statistics, emphasizing how to estimate unknown population parameters using sample data. It elaborates on the concepts of point estimation, which provides a single value, and interval estimation, which offers a range of values around a target parameter. Additionally, it covers both large-sample and small-sample confidence intervals, along with practical examples and calculations for determining sample sizes.Business Analytics _ Confidence Interval
Business Analytics _ Confidence IntervalRavindra Nath Shukla
╠²
This document outlines key concepts related to constructing confidence intervals for estimating population means and proportions. It discusses how to calculate confidence intervals when the population standard deviation is known or unknown. Specifically, it provides the formulas and assumptions for constructing confidence intervals for a population mean using the normal and t-distributions. It also outlines how to calculate confidence intervals for a population proportion using the normal approximation. Examples are provided to demonstrate how to construct 95% confidence intervals for a mean and proportion based on sample data.JM Statr session 13, Jan 11
JM Statr session 13, Jan 11Ruru Chowdhury
╠²
Here are the key steps to construct confidence intervals in R:
1. Generate sample data from a population distribution. For example, to generate a random sample of size 30 from a normal distribution with mean 100 and standard deviation 15:
x <- rnorm(30, 100, 15)
2. Calculate the sample mean and standard deviation:
mean(x)
sd(x)
3. Determine the appropriate t-statistic value based on the confidence level and degrees of freedom (n-1). For example, for a 95% CI with 29 df, the t-stat is 2.045:
qt(0.975, 29)
4. Calculate the confidence interval limits as:Inferential statistics-estimation
Inferential statistics-estimationSouthern Range, Berhampur, Odisha
╠²
This document discusses inferential statistics and confidence intervals. It introduces confidence intervals for a population mean using the t-distribution when the sample size is small (less than 30). When the population variance is known, the z-distribution can be used. It provides examples of how to calculate 95% and 99% confidence intervals for a population mean using the t-distribution and normal distribution. Formulas for the standard error and reliability coefficients are also presented.Introduction to the t Statistic
Introduction to the t Statisticjasondroesch
╠²
Chapter 9 of 'Essentials of Statistics for the Behavioral Sciences' discusses the t statistic, its application in hypothesis testing, and the comparison with the z-score. The chapter covers the estimation of the standard error using the sample data, the degrees of freedom, and the various methods for measuring effect size including Cohen's d and confidence intervals. It concludes with practical guidelines for conducting hypothesis tests and interpreting results, emphasizing the importance of including effect size in reports.Estimating a Population Mean
Estimating a Population Mean Long Beach City College
╠²
1) The sample shows the mean weight of men is 172.55 lbs with a standard deviation of 26 lbs.
2) A 95% confidence interval for the population mean weight is estimated to be between 164.49 lbs and 180.61 lbs.
3) This suggests that the outdated estimate of 166.3 lbs used for safety capacities is likely an underestimate, and updating to the point estimate of 172.55 lbs could help prevent overloading issues.L10 confidence intervals
L10 confidence intervalsLayal Fahad
╠²
This document discusses confidence intervals for estimating population means from sample data. It begins by explaining how to calculate point estimates and confidence intervals when the sample size is large (n Ōēź 30) using the normal distribution. It then covers calculating confidence intervals when the sample size is small (n < 30) using the t-distribution. The key steps covered are determining the appropriate distribution to use based on sample size and knowledge of the population standard deviation, finding the critical values and margin of error, and calculating the confidence interval. Examples are provided to demonstrate how to construct confidence intervals in different situations.Lesson04_new
Lesson04_newshengvn
╠²
This document discusses various methods for constructing confidence intervals to estimate population parameters using sample statistics. It covers confidence interval estimation for the mean when the population standard deviation is known and unknown, estimation for the proportion, and addresses situations involving finite populations. Factors that influence confidence interval width and formulas for determining necessary sample sizes are also presented. Examples are provided to illustrate how to set up confidence intervals and calculate required sample sizes.T-Distribution General Mathematics .pptx
T-Distribution General Mathematics .pptxZedrickDorato
╠²
The t-distribution, or Student's t-distribution, is a probability distribution used for estimating population parameters when sample sizes are small (n<30) or when the population standard deviation is unknown, featuring heavier tails compared to the normal distribution. It is characterized by degrees of freedom, which determine the shape, and is important for calculating critical values for statistical tests and confidence intervals. Key aspects include using the t-table for critical values and performing hypothesis tests to compare sample means against population means.Chapter09
Chapter09rwmiller
╠²
This document discusses methods for estimating population parameters from sample data, including point estimation, bias, confidence intervals, sample size determination, and hypothesis testing. Key points include defining point estimates as single values representing plausible population values based on sample data, describing how to calculate confidence intervals for population proportions and means using z-tests and t-tests, and outlining how to determine necessary sample sizes to achieve a desired level of accuracy and confidence.Statistik 1 7 estimasi & ci
Statistik 1 7 estimasi & ciSelvin Hadi
╠²
This document outlines key concepts related to estimation and confidence intervals. It defines point estimates as single values used to estimate population parameters and interval estimates as ranges of values within which the population parameter is expected to occur. Confidence intervals provide an interval range based on sample observations within which the population parameter is expected to fall at a specified confidence level, such as 95% or 99%. The document discusses how to construct confidence intervals for the population mean when the population standard deviation is known or unknown.statistics chapter 4 PowerPoint for accounting studens.ppt
statistics chapter 4 PowerPoint for accounting studens.pptyotor520
╠²
Chapter 4 discusses statistical estimation and inference, emphasizing two main methods: statistical estimation and statistical hypothesis testing. It covers point and interval estimation of population parameters, confidence intervals, and sample size determination for estimating population means and proportions. Additionally, it includes examples and exercises for practical application, as well as definitions of key statistical terms.Lesson04_Static11
Lesson04_Static11thangv
╠²
This document discusses statistical confidence interval estimation. It covers:
1) Confidence interval estimation for the mean when the population standard deviation is known and unknown.
2) Confidence interval estimation for the proportion.
3) Factors that affect confidence interval width like data variation, sample size, and confidence level.
4) How to estimate sample sizes needed to estimate a population mean or proportion within a given level of precision and confidence.GROUP_9_T-Distribution and percentile.pdf
GROUP_9_T-Distribution and percentile.pdfEditorialrangedCarto
╠²
The document discusses the t-distribution and how it differs from the z-distribution. The t-distribution is a type of normal distribution used for smaller sample sizes where the population variance is unknown. It is similar in shape to the z-distribution but has thicker tails. As the degrees of freedom increase, the t-distribution becomes more similar to the z-distribution. The t-distribution is symmetrical around 0 and used to find t-values and percentiles using a t-table when the sample size is less than 30.Monte carlo analysis
Monte carlo analysisGargiKhanna1
╠²
This document discusses Monte Carlo simulation techniques for power analysis of circuits. It explains that Monte Carlo simulation requires a large number of input vectors to accurately estimate power dissipation. The key points are:
- Monte Carlo simulation collects switching activity from many input vectors to apply to a power model.
- More input vectors lead to higher accuracy but diminishing returns. There is a point where additional vectors do not meaningfully improve accuracy.
- Statistical techniques can determine the optimal number of vectors needed to estimate power within a given error tolerance with a specific confidence level, such as 90%. This avoids wasting computation on unnecessary vectors.T distribution
T distributionStephan Jade Navarro
╠²
The t distribution is used when sample sizes are small to determine the probability of obtaining a given sample mean. It is similar to the normal distribution but has fatter tails. Properties include having a mean of 0 and a variance that decreases and approaches 1 as the degrees of freedom increase. The t distribution approaches the normal distribution as the sample size increases to infinity or the degrees of freedom become very large. Examples show how to find t-scores, critical values, and confidence intervals using a t-table based on the sample size and desired confidence level.Ad
More from leblance (20)
Parent night contact&survey
Parent night contact&surveyleblance
╠²
The Triton Travel Club contact survey collects a student's name, address, birthday, and parent/guardian contact information. It asks whether the student will enroll in an upcoming tour and which other countries or places the club should offer trips to in the future, with options including Argentina, Australia, Britain, California, China, Costa Rica, Egypt, France, Germany, Greece, India, Italy, Mexico, New Zealand, Peru, South Africa, Spain, Thailand, Vietnam and others.7.3 daqy 2
7.3 daqy 2leblance
╠²
Logarithmic functions are inverses of exponential functions. To graph a logarithmic function:
1. Identify the inverse exponential form.
2. Create a table of values for the exponential form.
3. Invert the ordered pairs.
4. Plot the points and sketch the graph of the logarithm.
Logarithmic functions can be transformed through stretching, compression, reflection, horizontal translation, and vertical translation compared to the parent logarithmic function. Examples are shown to demonstrate how transformations alter the graph.7.3
7.3leblance
╠²
This document introduces logarithmic functions as inverses of exponential functions. It defines logarithms as the inverse of an exponential function y = bx, such that y = bx is equivalent to logby = x. The document provides examples of writing exponential equations in logarithmic form and vice versa. It also demonstrates how to evaluate logarithms by using the definition to write them in exponential form and setting the exponents equal. Finally, it defines the common logarithm as a logarithm with base 10, which can be written as logx.7.1
7.1leblance
╠²
The document discusses exponential functions of the form f(x) = a*b^x, explaining that they always have a curved shape and asymptote at y=0. It distinguishes between exponential growth, where the value of y increases as x increases, and exponential decay, where the value of y decreases as x increases. Examples are provided to demonstrate how to determine if a function represents growth or decay and to find the y-intercept.7.2
7.2leblance
╠²
This document discusses properties and transformations of exponential functions, including stretch, compression, reflection, and horizontal and vertical translation. It also discusses the number e as the base for natural exponential functions and using the function A=Pe^rt to model continuously compounded interest. Examples are provided to demonstrate graphing transformations of exponential functions and using the continuously compounded interest formula.10.2
10.2leblance
╠²
This document discusses the chi-square goodness of fit test, which is used to check if observed data counts match the expected distribution of counts into categories. It examines whether a population follows a specified theoretical distribution.10.1 part2
10.1 part2leblance
╠²
This document discusses testing for homogeneity among populations using chi-square tests. It defines homogeneity as populations having the same structure or composition. A test of homogeneity determines if different populations have the same proportions for various categories. It requires using a contingency table and chi-square distribution. An example tests if the same proportion of males and females prefer different pet types using survey data from college students.10.1 part 1
10.1 part 1leblance
╠²
The document provides an overview of the chi-square distribution and how it can be used for hypothesis testing. It discusses that the chi-square distribution is used to find critical values for determining the area under the curve for a given degrees of freedom. It also gives an example of how chi-square can be used to test if two variables such as keyboard type and time to learn typing are independent.5.4 synthetic division
5.4 synthetic divisionleblance
╠²
This document discusses synthetic division and the remainder theorem. Synthetic division is a process that simplifies long division when dividing a polynomial by a linear factor of the form x - a. It involves setting up the coefficients of the polynomial and multiplying/adding through the process. The remainder theorem states that if a polynomial P(x) is divided by x - a, then the remainder is equal to P(a). It provides a quick way to find the remainder of a polynomial division problem by evaluating the polynomial at the value of a. Examples are given to demonstrate evaluating polynomials using the remainder theorem.5.4 long division
5.4 long divisionleblance
╠²
Long division can be used to divide polynomials in a similar way to dividing numbers. The key steps are to set up the division problem, divide the term of the dividend by the term of the divisor, multiply the divisor by the quotient term and subtract, then bring down the next term of the dividend and repeat. This polynomial long division allows polynomials to be factored by finding all divisor polynomials that give a remainder of zero. The factor theorem can also be used to check if a linear polynomial is a factor by setting it equal to zero and checking if it makes the other polynomial equal to zero.5.3
5.3leblance
╠²
This document discusses solving polynomial equations by factoring. It provides examples of factoring polynomials, including factoring the difference and sum of cubes. Factoring by substitution is also introduced as a method for factoring polynomials of degree 4 or higher. The document demonstrates solving polynomial equations by factoring the expressions and setting each factor equal to 0. Both real and imaginary solutions may be obtained depending on whether the factors are real or complex numbers. Graphing is presented as an alternative method to find real solutions of a polynomial equation.9.3 Part 1
9.3 Part 1leblance
╠²
The document discusses inferences for correlation and regression. It provides an example of testing the correlation between percentage of population with a college degree (x) and percentage growth in income (y) for 6 Ohio communities. There is a positive correlation between x and y, but this does not necessarily mean higher education causes higher earnings. The document also discusses measuring the spread of data points around the least squares line, including the standard error of estimate, using an example of how much copper sulfate dissolves in water at different temperatures.9.1 9.2 9.3 using the graph calc
9.1 9.2 9.3 using the graph calcleblance
╠²
This document provides guided notes on inferences for correlation and regression. It discusses how the sample correlation coefficient and least squares line estimate population parameters and require assumptions about the data. It also outlines how to test the population correlation coefficient using a significance test and interpret the results. An example is provided testing the correlation between education levels and income growth. Students are asked to practice computing the standard error of estimate from a data set and answering summary questions.5.2
5.2leblance
╠²
1. The document discusses writing polynomials in factored form and finding the zeros of polynomial functions. It defines linear factors, roots, zeros, and x-intercepts as equivalent terms.
2. Examples are provided of writing polynomials in factored form using the factor theorem to find the zeros, and then graphing the polynomial function based on its zeros.
3. The factor theorem states that a linear expression x - a is a factor of a polynomial if and only if a is a zero of the related polynomial function. This allows writing a polynomial given its zeros.5.1 part 2
5.1 part 2leblance
╠²
This document discusses how to describe the shape of a cubic function by listing it in standard form, describing the end behavior of the graph, determining the possible number of turning points using a table of values, and determining the increasing and decreasing intervals. It explains that to describe the shape, you identify the sign of the leading coefficient to determine the end behavior and the number of turning points, which is one less than the possible degree. The document also discusses using differences of consecutive y-values in a table to determine the least degree of the polynomial function that could generate the data, with constant first differences indicating linear, constant second differences indicating quadratic, and constant third differences indicating cubic.5.1[1]
5.1[1]leblance
╠²
This document defines key concepts related to polynomials and polynomial functions. It defines monomials as terms involving variables and exponents, and polynomials as sums of monomials. The degree of a polynomial is the highest exponent among its terms. Polynomial functions are polynomials written in terms of a single variable. Standard form arranges polynomial terms by descending degree. Polynomials are classified by degree and number of terms. Higher degree polynomials can have more turning points and their end behavior depends on the leading term. Examples show determining standard form, classifying polynomials, identifying end behavior and increasing/decreasing parts of graphs.9.1
9.1leblance
╠²
This document discusses scatter diagrams and linear correlation. It provides examples of scatter diagrams that do and do not show linear correlation. It defines the correlation coefficient r as a measure of linear correlation between two variables on a scatter plot, with values between -1 and 1. It presents formulas for calculating r and provides an example of computing r using wind velocity and sand drift rate data. It cautions that correlation does not necessarily imply causation and that lurking variables can influence the correlation between two variables.9.2 lin reg coeff of det
9.2 lin reg coeff of detleblance
╠²
1) Linear regression finds the "best-fitting" linear relationship between two variables by minimizing the vertical distances between the data points and the linear equation line.
2) The coefficient of determination, r^2, measures how well the linear relationship described by the regression line fits the actual data, with higher r^2 values indicating less unexplained variability.
3) r^2 has an interpretation as the percentage of the total variation in the response variable that is explained by the explanatory variable.Ad
7.2 estimate mu, sigma unknown
- 1. 7.2 ESTIMATING ╬╝ WHEN Žā IS UNKNOWN Chapter 7: Estimation
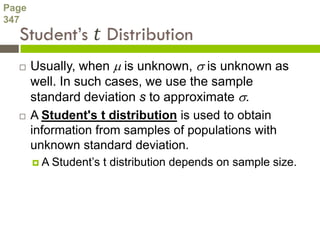
- 2. Page 347 ’é© Usually, when ’üŁ is unknown, ’ü│ is unknown as well. In such cases, we use the sample standard deviation s to approximate ’ü│. ’é© A Student's t distribution is used to obtain information from samples of populations with unknown standard deviation. ’éżA StudentŌĆÖs t distribution depends on sample size.
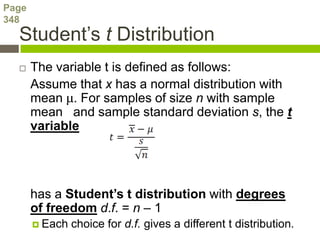
- 3. Page 348 StudentŌĆÖs t Distribution ’é© The variable t is defined as follows: Assume that x has a normal distribution with mean ╬╝. For samples of size n with sample mean and sample standard deviation s, the t variable has a StudentŌĆÖs t distribution with degrees of freedom d.f. = n ŌĆō 1 ’éż Each choice for d.f. gives a different t distribution.
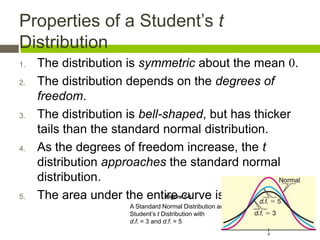
- 4. Properties of a StudentŌĆÖs t Distribution 1. The distribution is symmetric about the mean 0. 2. The distribution depends on the degrees of freedom. 3. The distribution is bell-shaped, but has thicker tails than the standard normal distribution. 4. As the degrees of freedom increase, the t distribution approaches the standard normal distribution. 5. The area under the entire curve is 1. Figure 7-5 A Standard Normal Distribution and StudentŌĆÖs t Distribution with d.f. = 3 and d.f. = 5
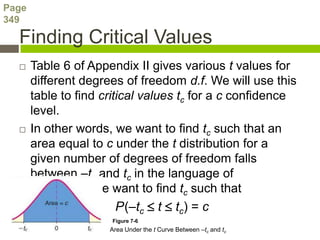
- 5. Page 349 Finding Critical Values ’é© Table 6 of Appendix II gives various t values for different degrees of freedom d.f. We will use this table to find critical values tc for a c confidence level. ’é© In other words, we want to find tc such that an area equal to c under the t distribution for a given number of degrees of freedom falls between ŌĆōtc and tc in the language of probability, we want to find tc such that P(ŌĆōtc ’éŻ t ’éŻ tc) = c Figure 7-6 Area Under the t Curve Between ŌĆōtc and tc
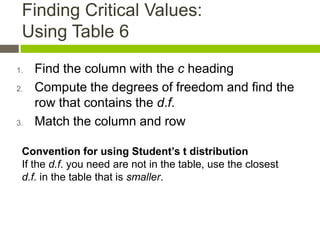
- 6. Finding Critical Values: Using Table 6 1. Find the column with the c heading 2. Compute the degrees of freedom and find the row that contains the d.f. 3. Match the column and row Convention for using StudentŌĆÖs t distribution If the d.f. you need are not in the table, use the closest d.f. in the table that is smaller.
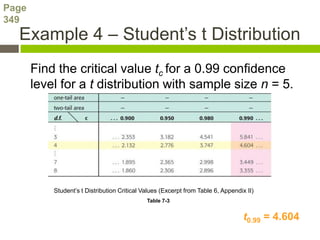
- 7. Page 349 Example 4 ŌĆō StudentŌĆÖs t Distribution Find the critical value tc for a 0.99 confidence level for a t distribution with sample size n = 5. StudentŌĆÖs t Distribution Critical Values (Excerpt from Table 6, Appendix II) Table 7-3 t0.99 = 4.604
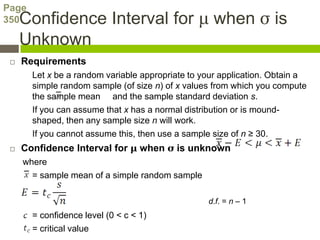
- 8. Page 350 Confidence Interval for ╬╝ when Žā is Unknown ’é© Requirements Let x be a random variable appropriate to your application. Obtain a simple random sample (of size n) of x values from which you compute the sample mean and the sample standard deviation s. If you can assume that x has a normal distribution or is mound- shaped, then any sample size n will work. If you cannot assume this, then use a sample size of n Ōēź 30. ’é© Confidence Interval for ╬╝ when Žā is unknown where = sample mean of a simple random sample d.f. = n ŌĆō 1 = confidence level (0 < c < 1) = critical value
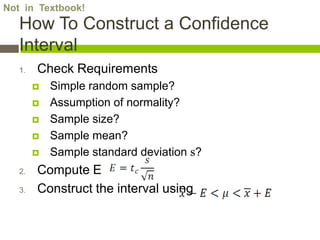
- 9. Not in Textbook! How To Construct a Confidence Interval 1. Check Requirements ’éż Simple random sample? ’éż Assumption of normality? ’éż Sample size? ’éż Sample mean? ’éż Sample standard deviation s? 2. Compute E 3. Construct the interval using
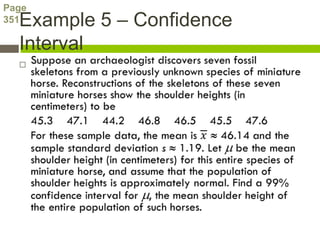
- 10. Page Example 5 ŌĆō Confidence 351 Interval ’é©
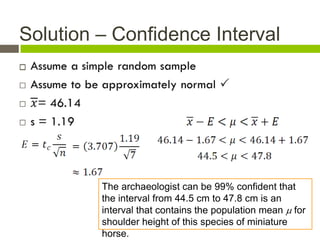
- 11. Solution ŌĆō Confidence Interval ’é© The archaeologist can be 99% confident that the interval from 44.5 cm to 47.8 cm is an interval that contains the population mean ’üŁ for shoulder height of this species of miniature horse.
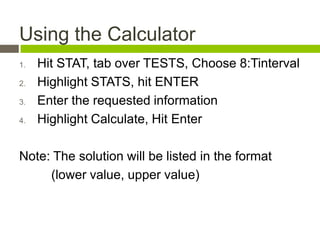
- 12. Using the Calculator 1. Hit STAT, tab over TESTS, Choose 8:Tinterval 2. Highlight STATS, hit ENTER 3. Enter the requested information 4. Highlight Calculate, Hit Enter Note: The solution will be listed in the format (lower value, upper value)
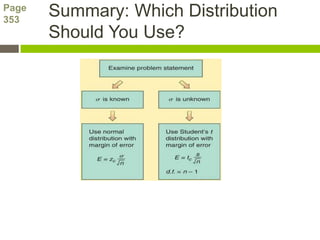
- 13. Page 353 Summary: Which Distribution Should You Use?
- 14. Assignment ’é© Page 354 ’é© #1, 4 ŌĆō 7, 11 ŌĆō 15 odd