8.3 critical region
Download as docx, pdf0 likes482 views
Testing a proportion using critical regions follows a similar process to testing a mean. The main difference is that a proportion represents a probability rather than a measurement. When using critical regions to test a proportion, if the sample test statistic falls within the critical region, the null hypothesis is rejected, and if it falls outside the critical region, the null hypothesis is not rejected. The test statistic is the z-score calculated from the sample proportion and null hypothesized proportion.
1 of 4
Download to read offline


Ad
Recommended
8.4 guided notes
8.4 guided notesleblance
╠²
1. Paired data involves dependent samples that are measured in pairs, such as measurements taken from the same subject before and after a treatment. When comparing paired data, the proper test is a one-sample t-test on the differences between pairs.
2. The null hypothesis for a paired t-test states that the mean of the differences between pairs is equal to zero, indicating no change between measurements. The alternative hypothesis depends on the specific problem but can be left-tailed, right-tailed, or two-tailed.
3. The key steps in a paired t-test are calculating the differences between pairs, finding the mean and standard deviation of the differences, determining the t-statistic, computing theExam Questions on Basic Statistics
Exam Questions on Basic StatisticsIUBAT
╠²
The document contains a surprise test with 16 multiple choice or short answer questions about key statistical concepts like measures of central tendency, probability, correlation, and regression. The questions cover topics like the probability of choosing a consonant, identifying the mode, median, and mean in data sets, interpreting scatter plots, and defining the components in a simple linear regression equation. The test is identified as belonging to a student named Md. Mortuza Ahmmed.Discriment analysis
Discriment analysisCollege of Fisheries, KVAFSU, Mangalore, Karnataka
╠²
Discriminant analysis is a statistical technique used to determine which group or category an item belongs to based on characteristics. It predicts categorical dependent variables from continuous independent variables. Linear discriminant analysis (LDA) is used for two groups, while multiple discriminant analysis (MDA) handles three or more groups. The technique aims to accurately classify groups and determine which variables best predict group membership. It has applications in fields like agriculture, socioeconomics, and marketing.Page 2
Page 2lucykeim
╠²
This document provides a 3 sentence summary of an anatomy projection. It refers to a projection of an unspecified body part labeled with the number 2. The document number is 3 and contains 1 paragraph.Basic Concepts of Standard Experimental Designs ( Statistics )
Basic Concepts of Standard Experimental Designs ( Statistics )Hasnat Israq
╠²
This document outlines key concepts in standard experimental design. It defines experimental design as assigning experimental units to treatment conditions to measure and compare treatment effects. Sample design selects units for measurement from a population. The document discusses necessary steps like replication and randomization. It presents linear statistical models including fixed, random, and mixed effects models. It also explains analysis of variance and standard designs like completely randomized design, randomized block design, and Latin square design, including their analysis of variance tables. The conclusion compares the efficiency of these standard designs.Discriminant analysis
Discriminant analysisMurali Raj
╠²
Discriminant analysis is a statistical technique used to classify cases into categories based on a set of predictor variables. It determines which continuous variables discriminate between two or more naturally occurring groups. For example, a researcher could use discriminant analysis to determine which fruit characteristics best predict whether a fruit will be eaten by birds, primates, or squirrels, based on data collected on various fruit properties from each animal group. Discriminant analysis involves estimating parameters, computing discriminant functions to classify new observations, and using cross-validation to estimate misclassification probabilities.conditional formatting
conditional formattingSushmita Ghosh
╠²
Conditional formatting allows users to apply cell formatting based on certain conditions or criteria, making it easier to visually analyze and identify patterns in data. It was introduced in Excel 97 and lets users highlight cells based on values, apply color scales or data bars, and use icon sets. Conditional formatting changes a cell's appearance if the given condition is true, and does not change it if the condition is false.Logistic regression analysis
Logistic regression analysisDhritiman Chakrabarti
╠²
Binary logistic regression analysis is used to predict a dichotomous dependent variable from continuous and/or categorical independent variables. SPSS is used to conduct binary logistic regression by entering the dependent variable as 1/0 and independent variables as predictors, and the output provides coefficients, odds ratios, classification tables, and goodness of fit tests. Factors like multicollinearity between predictors and sample size need to be considered to develop the best fitting and most predictive logistic regression model.Discriminant analysis group no. 4
Discriminant analysis group no. 4Advait Bhobe
╠²
Discriminant analysis is a statistical technique used to classify cases into categories based on a set of predictor variables. It can be used to determine which factors influence whether consumers make different choices. The document provides an example using discriminant analysis on survey data to predict whether consumers purchase chicken from a butcher's shop or not, based on variables like spending on chicken, age, beliefs about safety and trust in supermarkets. It also discusses extensions to multiple discriminant analysis when there are more than two categories to classify cases into.A17-1 graphing systems notes
A17-1 graphing systems notesvhiggins1
╠²
A system of equations is a set of two or more equations. A solution to a system of equations is an ordered pair that satisfies all equations in the system. To solve a system of linear equations graphically: 1) write each equation in y=mx+b form, 2) graph both equations on the same coordinate plane, 3) estimate the point of intersection which is the solution, and 4) check the solution by substituting the coordinates back into the original equations. The document provides an example system to solve graphically and check algebraically.Discriminant analysis
Discriminant analysisWansuklangk
╠²
Discriminant analysis is a statistical technique used to classify individuals or cases into groups based on a set of predictor variables. It can be used to determine which variables discriminate between two or more naturally occurring groups and to classify new observations into one of the existing groups. The key steps involve developing a discriminant function using a linear combination of predictors, evaluating the accuracy of classification, and determining the relative importance of predictors in discriminating between groups. Discriminant analysis requires certain assumptions about the data such as normality and equality of group variances to be valid.Basic Concepts of Experimental Design & Standard Design ( Statistics )
Basic Concepts of Experimental Design & Standard Design ( Statistics )Hasnat Israq
╠²
The document outlines the basic concepts and principles of experimental design, emphasizing its purpose in conducting systematic experiments to yield significant results. It describes various designs, including completely randomized design, randomized block design, and Latin square design, alongside statistical models such as fixed, random, and mixed effects models. Additionally, the document highlights the importance of analysis of variance (ANOVA) in distinguishing sources of variability in experiments.Discriminant analysis
Discriminant analysisAmritashish Bagchi
╠²
This document discusses discriminant analysis, which is a statistical technique used to classify observations into predefined groups based on independent variables. It can be used to predict the likelihood an entity belongs to a particular class. The document outlines the objectives, purposes, assumptions, and steps of discriminant analysis. It provides examples of using it to classify individuals as basketball vs volleyball players or high vs low performers based on variables.Experimental design
Experimental designRana Asif Abbas
╠²
Experimental design is a method for planning experiments so that the data obtained can be analyzed objectively. There are several key principles of experimental design, including replication, randomization, and controlling local sources of variation through techniques like blocking, balancing, and using proper plot sizes and techniques. When applied correctly, these principles help reduce experimental error and allow researchers to more accurately determine the effects of different treatments or variables.Discriminant analysis
Discriminant analysisTehran University of Medical Sciences,Tehran, Iran.
╠²
The document discusses discriminant analysis, a statistical technique used for group separation based on categorical dependent variables and interval independent variables. It covers objectives like describing group separation and classification, along with the formulation of discriminant functions and their applications. Additionally, it addresses the significance testing, limitations, and classification methods such as Fisher's procedure and the nearest neighbor classification rule.T18 discriminant analysis
T18 discriminant analysiskompellark
╠²
- Discriminant analysis can be used for classification or prediction, assigning objects to known groups based on independent variables. It attempts to distinguish between the categories of a dependent variable using metrics or dichotomous independents.
- Discriminant analysis works by creating discriminant functions - equations combining independents via coefficients - to produce discriminant scores predicting group membership. The number of functions needed equals one less than the number of groups.
- Functions are considered significant if they are able to distinguish between groups based on their relationship to one or more independents. Discriminant analysis is used in areas like marketing research, product usage, and direct marketing.Research hypothesis
Research hypothesisEemlliuq Agalalan
╠²
The document discusses directional and nondirectional alternative hypotheses. A nondirectional alternative hypothesis states that the null hypothesis is wrong but does not specify if the parameter is larger or smaller. A directional alternative hypothesis specifies if the parameter is greater than or less than the reference value. Using a directional hypothesis increases power to detect a specific effect but provides no power to detect an effect in the opposite direction. Examples are provided of a nondirectional hypothesis about exam scores compared to a national average, and a directional hypothesis about trained students' scores compared to the national average.8.2 critical region guided notes
8.2 critical region guided notesleblance
╠²
The document discusses the critical region method for statistical testing. The critical region method involves defining a critical value or critical values that separate the rejection region from the acceptance region. If the test statistic falls within the rejection region, the null hypothesis is rejected. The document provides steps for how to conduct a test using the critical region method, including calculating the test statistic, determining the critical value(s), and comparing the test statistic to the critical value(s) to either reject or fail to reject the null hypothesis. It also provides an example problem testing whether the mean number of sunspots during the Spanish colonial period was higher than 41 using a sample mean and a significance level of 0.05.8.3 p value
8.3 p valueleblance
╠²
1) Testing a proportion uses a binomial distribution with hypotheses about p, the probability of success on each trial. The test statistic is calculated and compared to a normal distribution to get a p-value.
2) An example tests whether a new eye surgery technique is better than the old technique based on a trial with 225 surgeries and 88 successes, using a 1% significance level.
3) Key steps are to check conditions, calculate the test statistic, find the p-value using the normal distribution, and either reject or fail to reject the null hypothesis based on the significance level.Morestatistics22 091208004743-phpapp01
Morestatistics22 091208004743-phpapp01mandrewmartin
╠²
1) The document discusses hypothesis testing and statistical inference using examples related to coin tossing. It explains the concepts of type I and type II errors and how hypothesis tests are conducted.
2) An example is provided to test the hypothesis that the average American ideology is somewhat conservative (H0: ╬╝ = 5) using data from the National Election Study. The alternative hypothesis is that the average is less than 5 (HA: ╬╝ < 5).
3) The results of the hypothesis test show the observed test statistic is lower than the critical value, so the null hypothesis that the average is 5 is rejected in favor of the alternative that the average is less than 5.Hypothesis Testing-Z-Test
Hypothesis Testing-Z-TestRoger Binschus
╠²
Here are the steps to solve this problem:
1. State the hypotheses:
H0: ╬╝ = 100
H1: ╬╝ ŌēĀ 100
2. The critical values are ┬▒1.96 (two-tailed test, ╬▒=0.05)
3. Compute the test statistic:
z = (140 - 100)/15/ŌłÜ40 = 20/15/2 = 4
4. The test statistic is in the critical region, so reject the null hypothesis.
5. There is strong evidence that the medication affected intelligence since the sample mean is much higher than the population mean.More Statistics
More Statisticsmandrewmartin
╠²
The document discusses various statistical concepts related to hypothesis testing, including:
- Types I and II errors that can occur when testing hypotheses
- How the probability of committing errors depends on factors like the sample size and how far the population parameter is from the hypothesized value
- The concept of critical regions and how they are used to determine if a null hypothesis can be rejected
- The difference between discrete and continuous probability distributions and examples of each
- How an observed test statistic is calculated and compared to a critical value to determine whether to reject or not reject the null hypothesis8. Hypothesis Testing.ppt
8. Hypothesis Testing.pptABDULRAUF411
╠²
Statistical hypothesis testing is an important tool for scientists to critically evaluate hypotheses using empirical data. It helps keep scientists honest by requiring them to statistically test their ideas rather than accepting them uncritically. One should be skeptical of any paper that claims an alternative hypothesis is supported without providing a statistical test. A key statistical test is the chi-square test, which compares observed data to expected frequencies under the null hypothesis. It calculates a test statistic and compares it to critical values in tables to determine if the null hypothesis can be rejected in favor of the alternative hypothesis. Proper use of statistical testing is part of the scientific method and moral imperative for scientists.Hypothesis testing part i
Hypothesis testing part iNadeem Uddin
╠²
1. This document discusses procedures for conducting chi-square goodness of fit and independence tests.
2. Chi-square goodness of fit tests are used to determine if sample data fits a hypothesized distribution. Chi-square tests for independence examine whether two categorical variables are associated.
3. The tests involve defining hypotheses, determining significance levels, calculating test statistics, finding critical values, performing computations, and making conclusions about whether to reject or fail to reject the null hypothesis.STATISTICS: Hypothesis Testing
STATISTICS: Hypothesis Testingjundumaug1
╠²
This document discusses hypothesis testing, including:
1) The objectives are to formulate statistical hypotheses, discuss types of errors, establish decision rules, and choose appropriate tests.
2) Key symbols and concepts are defined, such as the null and alternative hypotheses, Type I and Type II errors, test statistics like z and t, means, variances, sample sizes, and significance levels.
3) The two types of errors in hypothesis testing are discussed. Hypothesis tests can result in correct decisions or two types of errors when the null hypothesis is true or false.
4) Steps in hypothesis testing are outlined, including formulating hypotheses, specifying a significance level, choosing a test statistic, establishing a9.1 9.2 9.3 using the graph calc
9.1 9.2 9.3 using the graph calcleblance
╠²
This document provides guided notes on inferences for correlation and regression. It discusses how the sample correlation coefficient and least squares line estimate population parameters and require assumptions about the data. It also outlines how to test the population correlation coefficient using a significance test and interpret the results. An example is provided testing the correlation between education levels and income growth. Students are asked to practice computing the standard error of estimate from a data set and answering summary questions.Inferential statistics powerpoint
Inferential statistics powerpointkellula
╠²
This document provides an introduction to inferential statistics, including key terms like test statistic, critical value, degrees of freedom, p-value, and significance. It explains that inferential statistics allow inferences to be made about populations based on samples through probability and significance testing. Different levels of measurement are discussed, including nominal, ordinal, and interval data. Common inferential tests like the Mann-Whitney U, Chi-squared, and Wilcoxon T tests are mentioned. The process of conducting inferential tests is outlined, from collecting and analyzing data to comparing test statistics to critical values to determine significance. Type 1 and Type 2 errors in significance testing are also defined.Himani
HimaniSumit Priyadarshi
╠²
The document discusses hypothesis testing procedures. It describes the 7 steps of hypothesis testing which include setting the null and alternative hypotheses, choosing a statistical test, setting the significance level, establishing decision rules, collecting sample data, analyzing the data, and arriving at a statistical conclusion. Common statistical tests mentioned are F-tests, t-tests, and z-tests. The F-test compares variances by taking the ratio and uses sums of squares to develop statistics. The document provides an example of a company collecting potential customer spending data on flats in two areas to estimate differences in population means.Himani sharma
Himani sharmaSumit Priyadarshi
╠²
The document discusses hypothesis testing procedures. It describes the 7 steps of hypothesis testing which include setting the null and alternative hypotheses, choosing a statistical test, setting the significance level, establishing decision rules, collecting sample data, analyzing the data, and arriving at a statistical conclusion. Common statistical tests mentioned are F-tests, t-tests, and z-tests. The F-test compares variances by taking the ratio and uses sums of squares to develop statistics. The document provides an example of a company collecting potential customer spending data on flats in two areas to estimate differences in population means.inferences based on two sample - chapter 9
inferences based on two sample - chapter 9und3rpant
╠²
The document discusses the F distribution and its application in testing hypotheses concerning the equality of variances from two independent normal populations. It details the F test procedure, critical values for various significance levels, and provides examples to illustrate practical applications and calculations, including how to derive p-values from the F distribution. Additionally, it explains how to construct confidence intervals for the ratio of variances.More Related Content
What's hot (9)
Discriminant analysis group no. 4
Discriminant analysis group no. 4Advait Bhobe
╠²
Discriminant analysis is a statistical technique used to classify cases into categories based on a set of predictor variables. It can be used to determine which factors influence whether consumers make different choices. The document provides an example using discriminant analysis on survey data to predict whether consumers purchase chicken from a butcher's shop or not, based on variables like spending on chicken, age, beliefs about safety and trust in supermarkets. It also discusses extensions to multiple discriminant analysis when there are more than two categories to classify cases into.A17-1 graphing systems notes
A17-1 graphing systems notesvhiggins1
╠²
A system of equations is a set of two or more equations. A solution to a system of equations is an ordered pair that satisfies all equations in the system. To solve a system of linear equations graphically: 1) write each equation in y=mx+b form, 2) graph both equations on the same coordinate plane, 3) estimate the point of intersection which is the solution, and 4) check the solution by substituting the coordinates back into the original equations. The document provides an example system to solve graphically and check algebraically.Discriminant analysis
Discriminant analysisWansuklangk
╠²
Discriminant analysis is a statistical technique used to classify individuals or cases into groups based on a set of predictor variables. It can be used to determine which variables discriminate between two or more naturally occurring groups and to classify new observations into one of the existing groups. The key steps involve developing a discriminant function using a linear combination of predictors, evaluating the accuracy of classification, and determining the relative importance of predictors in discriminating between groups. Discriminant analysis requires certain assumptions about the data such as normality and equality of group variances to be valid.Basic Concepts of Experimental Design & Standard Design ( Statistics )
Basic Concepts of Experimental Design & Standard Design ( Statistics )Hasnat Israq
╠²
The document outlines the basic concepts and principles of experimental design, emphasizing its purpose in conducting systematic experiments to yield significant results. It describes various designs, including completely randomized design, randomized block design, and Latin square design, alongside statistical models such as fixed, random, and mixed effects models. Additionally, the document highlights the importance of analysis of variance (ANOVA) in distinguishing sources of variability in experiments.Discriminant analysis
Discriminant analysisAmritashish Bagchi
╠²
This document discusses discriminant analysis, which is a statistical technique used to classify observations into predefined groups based on independent variables. It can be used to predict the likelihood an entity belongs to a particular class. The document outlines the objectives, purposes, assumptions, and steps of discriminant analysis. It provides examples of using it to classify individuals as basketball vs volleyball players or high vs low performers based on variables.Experimental design
Experimental designRana Asif Abbas
╠²
Experimental design is a method for planning experiments so that the data obtained can be analyzed objectively. There are several key principles of experimental design, including replication, randomization, and controlling local sources of variation through techniques like blocking, balancing, and using proper plot sizes and techniques. When applied correctly, these principles help reduce experimental error and allow researchers to more accurately determine the effects of different treatments or variables.Discriminant analysis
Discriminant analysisTehran University of Medical Sciences,Tehran, Iran.
╠²
The document discusses discriminant analysis, a statistical technique used for group separation based on categorical dependent variables and interval independent variables. It covers objectives like describing group separation and classification, along with the formulation of discriminant functions and their applications. Additionally, it addresses the significance testing, limitations, and classification methods such as Fisher's procedure and the nearest neighbor classification rule.T18 discriminant analysis
T18 discriminant analysiskompellark
╠²
- Discriminant analysis can be used for classification or prediction, assigning objects to known groups based on independent variables. It attempts to distinguish between the categories of a dependent variable using metrics or dichotomous independents.
- Discriminant analysis works by creating discriminant functions - equations combining independents via coefficients - to produce discriminant scores predicting group membership. The number of functions needed equals one less than the number of groups.
- Functions are considered significant if they are able to distinguish between groups based on their relationship to one or more independents. Discriminant analysis is used in areas like marketing research, product usage, and direct marketing.Research hypothesis
Research hypothesisEemlliuq Agalalan
╠²
The document discusses directional and nondirectional alternative hypotheses. A nondirectional alternative hypothesis states that the null hypothesis is wrong but does not specify if the parameter is larger or smaller. A directional alternative hypothesis specifies if the parameter is greater than or less than the reference value. Using a directional hypothesis increases power to detect a specific effect but provides no power to detect an effect in the opposite direction. Examples are provided of a nondirectional hypothesis about exam scores compared to a national average, and a directional hypothesis about trained students' scores compared to the national average.Similar to 8.3 critical region (20)
8.2 critical region guided notes
8.2 critical region guided notesleblance
╠²
The document discusses the critical region method for statistical testing. The critical region method involves defining a critical value or critical values that separate the rejection region from the acceptance region. If the test statistic falls within the rejection region, the null hypothesis is rejected. The document provides steps for how to conduct a test using the critical region method, including calculating the test statistic, determining the critical value(s), and comparing the test statistic to the critical value(s) to either reject or fail to reject the null hypothesis. It also provides an example problem testing whether the mean number of sunspots during the Spanish colonial period was higher than 41 using a sample mean and a significance level of 0.05.8.3 p value
8.3 p valueleblance
╠²
1) Testing a proportion uses a binomial distribution with hypotheses about p, the probability of success on each trial. The test statistic is calculated and compared to a normal distribution to get a p-value.
2) An example tests whether a new eye surgery technique is better than the old technique based on a trial with 225 surgeries and 88 successes, using a 1% significance level.
3) Key steps are to check conditions, calculate the test statistic, find the p-value using the normal distribution, and either reject or fail to reject the null hypothesis based on the significance level.Morestatistics22 091208004743-phpapp01
Morestatistics22 091208004743-phpapp01mandrewmartin
╠²
1) The document discusses hypothesis testing and statistical inference using examples related to coin tossing. It explains the concepts of type I and type II errors and how hypothesis tests are conducted.
2) An example is provided to test the hypothesis that the average American ideology is somewhat conservative (H0: ╬╝ = 5) using data from the National Election Study. The alternative hypothesis is that the average is less than 5 (HA: ╬╝ < 5).
3) The results of the hypothesis test show the observed test statistic is lower than the critical value, so the null hypothesis that the average is 5 is rejected in favor of the alternative that the average is less than 5.Hypothesis Testing-Z-Test
Hypothesis Testing-Z-TestRoger Binschus
╠²
Here are the steps to solve this problem:
1. State the hypotheses:
H0: ╬╝ = 100
H1: ╬╝ ŌēĀ 100
2. The critical values are ┬▒1.96 (two-tailed test, ╬▒=0.05)
3. Compute the test statistic:
z = (140 - 100)/15/ŌłÜ40 = 20/15/2 = 4
4. The test statistic is in the critical region, so reject the null hypothesis.
5. There is strong evidence that the medication affected intelligence since the sample mean is much higher than the population mean.More Statistics
More Statisticsmandrewmartin
╠²
The document discusses various statistical concepts related to hypothesis testing, including:
- Types I and II errors that can occur when testing hypotheses
- How the probability of committing errors depends on factors like the sample size and how far the population parameter is from the hypothesized value
- The concept of critical regions and how they are used to determine if a null hypothesis can be rejected
- The difference between discrete and continuous probability distributions and examples of each
- How an observed test statistic is calculated and compared to a critical value to determine whether to reject or not reject the null hypothesis8. Hypothesis Testing.ppt
8. Hypothesis Testing.pptABDULRAUF411
╠²
Statistical hypothesis testing is an important tool for scientists to critically evaluate hypotheses using empirical data. It helps keep scientists honest by requiring them to statistically test their ideas rather than accepting them uncritically. One should be skeptical of any paper that claims an alternative hypothesis is supported without providing a statistical test. A key statistical test is the chi-square test, which compares observed data to expected frequencies under the null hypothesis. It calculates a test statistic and compares it to critical values in tables to determine if the null hypothesis can be rejected in favor of the alternative hypothesis. Proper use of statistical testing is part of the scientific method and moral imperative for scientists.Hypothesis testing part i
Hypothesis testing part iNadeem Uddin
╠²
1. This document discusses procedures for conducting chi-square goodness of fit and independence tests.
2. Chi-square goodness of fit tests are used to determine if sample data fits a hypothesized distribution. Chi-square tests for independence examine whether two categorical variables are associated.
3. The tests involve defining hypotheses, determining significance levels, calculating test statistics, finding critical values, performing computations, and making conclusions about whether to reject or fail to reject the null hypothesis.STATISTICS: Hypothesis Testing
STATISTICS: Hypothesis Testingjundumaug1
╠²
This document discusses hypothesis testing, including:
1) The objectives are to formulate statistical hypotheses, discuss types of errors, establish decision rules, and choose appropriate tests.
2) Key symbols and concepts are defined, such as the null and alternative hypotheses, Type I and Type II errors, test statistics like z and t, means, variances, sample sizes, and significance levels.
3) The two types of errors in hypothesis testing are discussed. Hypothesis tests can result in correct decisions or two types of errors when the null hypothesis is true or false.
4) Steps in hypothesis testing are outlined, including formulating hypotheses, specifying a significance level, choosing a test statistic, establishing a9.1 9.2 9.3 using the graph calc
9.1 9.2 9.3 using the graph calcleblance
╠²
This document provides guided notes on inferences for correlation and regression. It discusses how the sample correlation coefficient and least squares line estimate population parameters and require assumptions about the data. It also outlines how to test the population correlation coefficient using a significance test and interpret the results. An example is provided testing the correlation between education levels and income growth. Students are asked to practice computing the standard error of estimate from a data set and answering summary questions.Inferential statistics powerpoint
Inferential statistics powerpointkellula
╠²
This document provides an introduction to inferential statistics, including key terms like test statistic, critical value, degrees of freedom, p-value, and significance. It explains that inferential statistics allow inferences to be made about populations based on samples through probability and significance testing. Different levels of measurement are discussed, including nominal, ordinal, and interval data. Common inferential tests like the Mann-Whitney U, Chi-squared, and Wilcoxon T tests are mentioned. The process of conducting inferential tests is outlined, from collecting and analyzing data to comparing test statistics to critical values to determine significance. Type 1 and Type 2 errors in significance testing are also defined.Himani
HimaniSumit Priyadarshi
╠²
The document discusses hypothesis testing procedures. It describes the 7 steps of hypothesis testing which include setting the null and alternative hypotheses, choosing a statistical test, setting the significance level, establishing decision rules, collecting sample data, analyzing the data, and arriving at a statistical conclusion. Common statistical tests mentioned are F-tests, t-tests, and z-tests. The F-test compares variances by taking the ratio and uses sums of squares to develop statistics. The document provides an example of a company collecting potential customer spending data on flats in two areas to estimate differences in population means.Himani sharma
Himani sharmaSumit Priyadarshi
╠²
The document discusses hypothesis testing procedures. It describes the 7 steps of hypothesis testing which include setting the null and alternative hypotheses, choosing a statistical test, setting the significance level, establishing decision rules, collecting sample data, analyzing the data, and arriving at a statistical conclusion. Common statistical tests mentioned are F-tests, t-tests, and z-tests. The F-test compares variances by taking the ratio and uses sums of squares to develop statistics. The document provides an example of a company collecting potential customer spending data on flats in two areas to estimate differences in population means.inferences based on two sample - chapter 9
inferences based on two sample - chapter 9und3rpant
╠²
The document discusses the F distribution and its application in testing hypotheses concerning the equality of variances from two independent normal populations. It details the F test procedure, critical values for various significance levels, and provides examples to illustrate practical applications and calculations, including how to derive p-values from the F distribution. Additionally, it explains how to construct confidence intervals for the ratio of variances.Hypothesis testing
Hypothesis testingLorelyn Turtosa-Dumaug
╠²
This document discusses hypothesis testing. It defines key terms like the null hypothesis (Ho), alternative hypothesis (H1), type 1 and type 2 errors, significance level, test statistics, critical values, rejection regions, and one-tailed vs two-tailed tests. It provides examples of how to formulate hypotheses, determine appropriate test statistics, establish critical regions, and make conclusions based on computed test values for both known and unknown population variances with one and two sample tests concerning means.8.2 p value guided notes
8.2 p value guided notesleblance
╠²
This document provides guidance on performing hypothesis tests of the mean. It outlines the procedures for testing the mean when the population standard deviation is known or unknown. An example is provided for each case, testing if the mean number of sunspots or drug remission time is different than a hypothesized value. Key steps are calculating the test statistic, determining the p-value, and comparing it to the significance level to determine whether to reject or fail to reject the null hypothesis. Questions at the end review the procedures and concepts covered.Inferential statistics hand out (2)
Inferential statistics hand out (2)Kimberly Ann Yabut
╠²
Inferential statistics allow researchers to draw conclusions about populations based on data from samples. They estimate population parameters and test hypotheses about populations that extend beyond the sample data. Hypothesis testing provides objective criteria for deciding whether to accept or reject research hypotheses as true or false based on the probability that any observed differences are due to chance. It involves selecting a test statistic, significance level, computing the test statistic, and comparing it to critical values to determine whether to reject the null hypothesis. Type I and Type II errors can occur but the significance level controls the risk of Type I errors.hypothesis.pptx
hypothesis.pptxPrakharMishra925441
╠²
Hypothesis testing involves setting up a null hypothesis and alternative hypothesis, determining a significance level, calculating a test statistic, identifying the critical region, computing the test statistic value based on a sample, and making a decision to reject or fail to reject the null hypothesis. The z-test is used when the sample size is large and the population standard deviation is known, while the t-test is used for small samples when the population standard deviation is unknown. Both tests involve calculating a test statistic and comparing it to critical values to determine if there is sufficient evidence to reject the null hypothesis. Limitations include that the tests only indicate differences and not the reasons for them, and inferences are based on probabilities rather than certainty.Hypothesis testing part iii for difference of means
Hypothesis testing part iii for difference of meansNadeem Uddin
╠²
This document discusses hypothesis testing for the difference between means. It provides three examples that demonstrate how to perform hypothesis tests to compare the means of two samples. The examples show how to: 1) State the null and alternative hypotheses, 2) Determine the test statistic and critical region based on the hypotheses, level of significance and test assumptions, 3) Perform calculations to obtain the test statistic value, and 4) Make a conclusion about whether to reject or fail to reject the null hypothesis based on comparing the test statistic to the critical region.TEST OF SIGNIFICANCE.pptx
TEST OF SIGNIFICANCE.pptxmuthukrishnaveni anand
╠²
This document discusses hypothesis testing and significance tests. It defines key terms like parameters, statistics, sampling distribution, standard error, null and alternative hypotheses, type I and type II errors. It explains how to set up a hypothesis test, including choosing a significance level and critical value. Both one-tailed and two-tailed tests are described. Finally, it provides an overview of different types of significance tests for both large and small sample sizes.Testing of hypothesis
Testing of hypothesisRuchiJainRuchiJain
╠²
The document discusses testing of hypotheses. It defines a hypothesis as a tentative prediction about the relationship between variables. Good hypotheses are precise, testable, and consistent with known facts. Hypothesis testing involves formulating a null hypothesis (Ho) and an alternative hypothesis (H1). A significance level such as 5% is chosen. If the test statistic falls within the critical region, Ho is rejected. Type I error rejects a true Ho, while Type II error accepts a false Ho. Power refers to correctly rejecting a false Ho. The testing process determines test statistics, critical regions, and interprets results to draw conclusions.Ad
More from leblance (20)
Parent night contact&survey
Parent night contact&surveyleblance
╠²
The Triton Travel Club contact survey collects a student's name, address, birthday, and parent/guardian contact information. It asks whether the student will enroll in an upcoming tour and which other countries or places the club should offer trips to in the future, with options including Argentina, Australia, Britain, California, China, Costa Rica, Egypt, France, Germany, Greece, India, Italy, Mexico, New Zealand, Peru, South Africa, Spain, Thailand, Vietnam and others.7.3 daqy 2
7.3 daqy 2leblance
╠²
Logarithmic functions are inverses of exponential functions. To graph a logarithmic function:
1. Identify the inverse exponential form.
2. Create a table of values for the exponential form.
3. Invert the ordered pairs.
4. Plot the points and sketch the graph of the logarithm.
Logarithmic functions can be transformed through stretching, compression, reflection, horizontal translation, and vertical translation compared to the parent logarithmic function. Examples are shown to demonstrate how transformations alter the graph.7.3
7.3leblance
╠²
This document introduces logarithmic functions as inverses of exponential functions. It defines logarithms as the inverse of an exponential function y = bx, such that y = bx is equivalent to logby = x. The document provides examples of writing exponential equations in logarithmic form and vice versa. It also demonstrates how to evaluate logarithms by using the definition to write them in exponential form and setting the exponents equal. Finally, it defines the common logarithm as a logarithm with base 10, which can be written as logx.7.1
7.1leblance
╠²
The document discusses exponential functions of the form f(x) = a*b^x, explaining that they always have a curved shape and asymptote at y=0. It distinguishes between exponential growth, where the value of y increases as x increases, and exponential decay, where the value of y decreases as x increases. Examples are provided to demonstrate how to determine if a function represents growth or decay and to find the y-intercept.7.2
7.2leblance
╠²
This document discusses properties and transformations of exponential functions, including stretch, compression, reflection, and horizontal and vertical translation. It also discusses the number e as the base for natural exponential functions and using the function A=Pe^rt to model continuously compounded interest. Examples are provided to demonstrate graphing transformations of exponential functions and using the continuously compounded interest formula.10.2
10.2leblance
╠²
This document discusses the chi-square goodness of fit test, which is used to check if observed data counts match the expected distribution of counts into categories. It examines whether a population follows a specified theoretical distribution.10.1 part2
10.1 part2leblance
╠²
This document discusses testing for homogeneity among populations using chi-square tests. It defines homogeneity as populations having the same structure or composition. A test of homogeneity determines if different populations have the same proportions for various categories. It requires using a contingency table and chi-square distribution. An example tests if the same proportion of males and females prefer different pet types using survey data from college students.10.1 part 1
10.1 part 1leblance
╠²
The document provides an overview of the chi-square distribution and how it can be used for hypothesis testing. It discusses that the chi-square distribution is used to find critical values for determining the area under the curve for a given degrees of freedom. It also gives an example of how chi-square can be used to test if two variables such as keyboard type and time to learn typing are independent.5.4 synthetic division
5.4 synthetic divisionleblance
╠²
This document discusses synthetic division and the remainder theorem. Synthetic division is a process that simplifies long division when dividing a polynomial by a linear factor of the form x - a. It involves setting up the coefficients of the polynomial and multiplying/adding through the process. The remainder theorem states that if a polynomial P(x) is divided by x - a, then the remainder is equal to P(a). It provides a quick way to find the remainder of a polynomial division problem by evaluating the polynomial at the value of a. Examples are given to demonstrate evaluating polynomials using the remainder theorem.5.4 long division
5.4 long divisionleblance
╠²
Long division can be used to divide polynomials in a similar way to dividing numbers. The key steps are to set up the division problem, divide the term of the dividend by the term of the divisor, multiply the divisor by the quotient term and subtract, then bring down the next term of the dividend and repeat. This polynomial long division allows polynomials to be factored by finding all divisor polynomials that give a remainder of zero. The factor theorem can also be used to check if a linear polynomial is a factor by setting it equal to zero and checking if it makes the other polynomial equal to zero.5.3
5.3leblance
╠²
This document discusses solving polynomial equations by factoring. It provides examples of factoring polynomials, including factoring the difference and sum of cubes. Factoring by substitution is also introduced as a method for factoring polynomials of degree 4 or higher. The document demonstrates solving polynomial equations by factoring the expressions and setting each factor equal to 0. Both real and imaginary solutions may be obtained depending on whether the factors are real or complex numbers. Graphing is presented as an alternative method to find real solutions of a polynomial equation.9.3 Part 1
9.3 Part 1leblance
╠²
The document discusses inferences for correlation and regression. It provides an example of testing the correlation between percentage of population with a college degree (x) and percentage growth in income (y) for 6 Ohio communities. There is a positive correlation between x and y, but this does not necessarily mean higher education causes higher earnings. The document also discusses measuring the spread of data points around the least squares line, including the standard error of estimate, using an example of how much copper sulfate dissolves in water at different temperatures.5.2
5.2leblance
╠²
1. The document discusses writing polynomials in factored form and finding the zeros of polynomial functions. It defines linear factors, roots, zeros, and x-intercepts as equivalent terms.
2. Examples are provided of writing polynomials in factored form using the factor theorem to find the zeros, and then graphing the polynomial function based on its zeros.
3. The factor theorem states that a linear expression x - a is a factor of a polynomial if and only if a is a zero of the related polynomial function. This allows writing a polynomial given its zeros.5.1 part 2
5.1 part 2leblance
╠²
This document discusses how to describe the shape of a cubic function by listing it in standard form, describing the end behavior of the graph, determining the possible number of turning points using a table of values, and determining the increasing and decreasing intervals. It explains that to describe the shape, you identify the sign of the leading coefficient to determine the end behavior and the number of turning points, which is one less than the possible degree. The document also discusses using differences of consecutive y-values in a table to determine the least degree of the polynomial function that could generate the data, with constant first differences indicating linear, constant second differences indicating quadratic, and constant third differences indicating cubic.5.1[1]
5.1[1]leblance
╠²
This document defines key concepts related to polynomials and polynomial functions. It defines monomials as terms involving variables and exponents, and polynomials as sums of monomials. The degree of a polynomial is the highest exponent among its terms. Polynomial functions are polynomials written in terms of a single variable. Standard form arranges polynomial terms by descending degree. Polynomials are classified by degree and number of terms. Higher degree polynomials can have more turning points and their end behavior depends on the leading term. Examples show determining standard form, classifying polynomials, identifying end behavior and increasing/decreasing parts of graphs.9.1
9.1leblance
╠²
This document discusses scatter diagrams and linear correlation. It provides examples of scatter diagrams that do and do not show linear correlation. It defines the correlation coefficient r as a measure of linear correlation between two variables on a scatter plot, with values between -1 and 1. It presents formulas for calculating r and provides an example of computing r using wind velocity and sand drift rate data. It cautions that correlation does not necessarily imply causation and that lurking variables can influence the correlation between two variables.9.2 lin reg coeff of det
9.2 lin reg coeff of detleblance
╠²
1) Linear regression finds the "best-fitting" linear relationship between two variables by minimizing the vertical distances between the data points and the linear equation line.
2) The coefficient of determination, r^2, measures how well the linear relationship described by the regression line fits the actual data, with higher r^2 values indicating less unexplained variability.
3) r^2 has an interpretation as the percentage of the total variation in the response variable that is explained by the explanatory variable.Ad
8.3 critical region
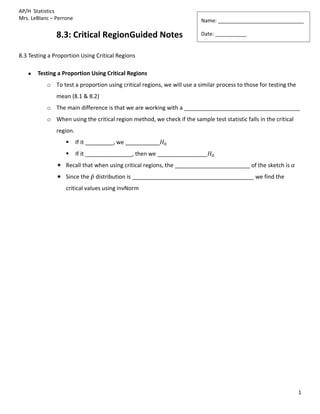
- 1. AP/H Statistics Mrs. LeBlanc ŌĆō Perrone Name: ______________________________ 8.3: Critical RegionGuided Notes Date: ___________ 8.3 Testing a Proportion Using Critical Regions Testing a Proportion Using Critical Regions o To test a proportion using critical regions, we will use a similar process to those for testing the mean (8.1 & 8.2) o The main difference is that we are working with a _____________________________________ o When using the critical region method, we check if the sample test statistic falls in the critical region. ’é¦ If it _________, we ___________ ’é¦ If it _______________, then we ________________ ’é½ Recall that when using critical regions, the ________________________ of the sketch is ’é½ Since the distribution is _______________________________________ we find the critical values using invNorm 1
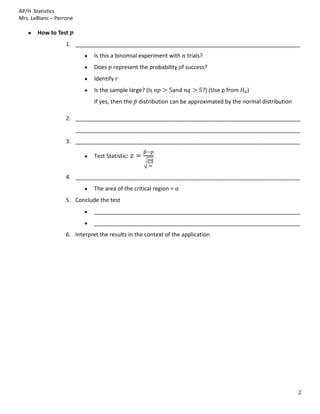
- 2. AP/H Statistics Mrs. LeBlanc ŌĆō Perrone How to Test 1. ________________________________________________________________________ Is this a binomial experiment with trials? Does represent the probability of success? Identify Is the sample large? (Is and ?) (Use p from ) If yes, then the distribution can be approximated by the normal distribution 2. ________________________________________________________________________ ________________________________________________________________________ 3. ________________________________________________________________________ Test Statistic: 4. ________________________________________________________________________ The area of the critical region = 5. Conclude the test __________________________________________________________________ __________________________________________________________________ 6. Interpret the results in the context of the application 2
- 3. AP/H Statistics Mrs. LeBlanc ŌĆō Perrone EXAMPLE: Testing , Critical Regions A botanist has produced a new variety of hybrid wheat that is better able to withstand drought than other varieties. The botanist knows that for the parent plants, the proportion of seeds germinating is 80%. The proportion of seeds germinating for the hybrid variety is unknown, but the botanist claims that it is 80%. To test this claim, 400 seeds from the hybrid plant are tested, and it is found that 312 germinate. Use a 5% level of significance to test the claim that the proportion germinating for the hybrid is 80%. 3
- 4. AP/H Statistics Mrs. LeBlanc ŌĆō Perrone Summary Questions 1. How is testing (using critical values) similar to testing (using critical values)? ____________________________________________________________________________________ ____________________________________________________________________________________ ____________________________________________________________________________________ ____________________________________________________________________________________ 2. When testing using critical values, what is the test statistic for? ____________________________________________________________________________________ ____________________________________________________________________________________ ____________________________________________________________________________________ ____________________________________________________________________________________ ŌĆ£HOTŌĆØ Question: __________________________________________________________________________________________ __________________________________________________________________________________________ 4