


More Related Content
Similar to A Power Dive into Pivot Tables (Transform raw data into compelling) (20)
More from jahanvi52 (8)


Recently uploaded (20)


![PLAN_OF_WORK_PPT_BY_ROHIT_BHAIRAM_--2212020201003[1] new.pptx](https://cdn.slidesharecdn.com/ss_thumbnails/planofworkpptbyrohitbhairam-22120202010031new-250329072214-99e4fccd-thumbnail.jpg?width=560&fit=bounds)


A Power Dive into Pivot Tables (Transform raw data into compelling)
- 1. A Power Dive into Pivot Tables Transform raw data into compelling summaries and visualizations
- 2. Pivot Tables? Interactive tools that summarize and reorganize data from large spreadsheets, allowing you to analyze trends, patterns, and relationships. • Benefits: • Simplify complex data: Condense information into manageable and focused views. • Identify key trends and patterns: Uncover hidden insights not readily apparent in raw data. • Create dynamic reports and charts: Quickly visualize and communicate data findings. • Save time and effort: Automate repetitive data analysis tasks.
- 3. Building a Pivot Table Steps: • Select the data range you want to analyze. • Go to the Insert tab and click "PivotTable." • Choose where to place the PivotTable (new worksheet or existing one). • Drag and drop fields to the Rows, Columns, and Values areas to define your analysis. • Use filters and slicers to further refine your view.
- 4. Pivot Table Components Rows: Define categories or dimensions you want to analyze (e.g., product categories, regions, months). Columns: Add additional layers of analysis (e.g., years, sales representatives, performance metrics). Values: Choose the data points you want to summarize (e.g., total sales, average profit, customer count). Filters: Narrow down your data by specific criteria within each field. Slicers: Visualize and interactively filter data through buttons or sliders.
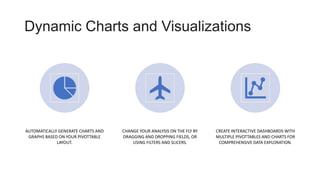
- 5. Dynamic Charts and Visualizations AUTOMATICALLY GENERATE CHARTS AND GRAPHS BASED ON YOUR PIVOTTABLE LAYOUT. CHANGE YOUR ANALYSIS ON THE FLY BY DRAGGING AND DROPPING FIELDS, OR USING FILTERS AND SLICERS. CREATE INTERACTIVE DASHBOARDS WITH MULTIPLE PIVOTTABLES AND CHARTS FOR COMPREHENSIVE DATA EXPLORATION.
- 6. Advanced Pivot Table Techniques Calculated fields: Create custom formulas to generate new data points within your PivotTable. Pivot charts: Enhance your visuals with advanced chart types and formatting options. Time intelligence: Analyze data trends over specific time periods. Drill down and slicers: Explore deeper levels of detail within your data.
- 7. Real-World Applications Sales Analysis: Track sales performance by product, region, and period. Marketing Campaigns: Analyze campaign effectiveness and ROI. Financial Reporting: Summarize income and expenses, track budget variances. HR Management: Analyze employee demographics, performance, and turnover.
- 8. Conclusion • Pivot tables are powerful tools for unlocking hidden insights and streamlining data analysis. • Mastering their capabilities empowers you to make informed decisions based on data- driven insights. • Start exploring and experiment with different techniques to transform your data into compelling stories.
- 9. Bonus Tips • Format your PivotTable for better readability and visual appeal. • Share your PivotTable as a dynamic report or interactive dashboard. • Use PivotTable data as a source for other charts and graphs in your Excel workbook.