A/B Testing at SweetIM
- 1. A/B Testing at SweetIM ¨C the Importance of Proper Statistical Analysis Slava Borodovsky SweetIM slavabo@gmail.com Saharon Rosset Tel Aviv University saharon@post.tau.ac.il
- 2. About SweetIM ? Provides interactive content and search services for IMs and social networks. ? More than 1,000,000 monthly new users. ? More than 100,000,000 monthly search queries. ? Every new feature and change in product pass A/B testing. ? Data driven decision making process is based on A/B testing results.
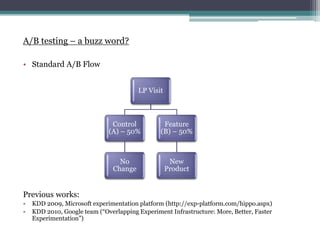
- 3. A/B testing ¨C a buzz word? ? Standard A/B Flow Previous works: ? KDD 2009, Microsoft experimentation platform (http://exp-platform.com/hippo.aspx) ? KDD 2010, Google team (ˇ°Overlapping Experiment Infrastructure: More, Better, Faster Experimentationˇ±) LP Visit Control (A) ¨C 50% No Change Feature (B) ¨C 50% New Product
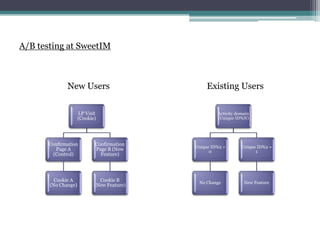
- 4. A/B testing at SweetIM New Users Existing Users LP Visit (Cookie) Confirmation Page A (Control) Cookie A (No Change) Confirmation Page B (New Feature) Cookie B (New Feature) Activity domain (Unique ID%N) Unique ID%2 = 0 No Change Unique ID%2 = 1 New Feature
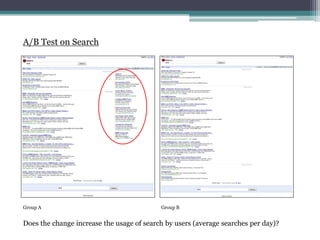
- 5. A/B Test on Search Group A Group B Does the change increase the usage of search by users (average searches per day)?
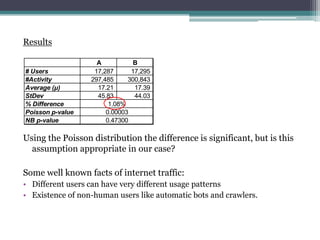
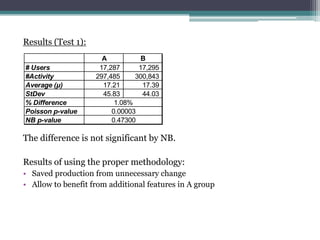
- 6. Results Using the Poisson distribution the difference is significant, but is this assumption appropriate in our case? Some well known facts of internet traffic: ? Different users can have very different usage patterns ? Existence of non-human users like automatic bots and crawlers. A B # Users 17,287 17,295 #Activity 297,485 300,843 Average (¦Ě) 17.21 17.39 StDev 45.83 44.03 % Difference Poisson p-value NB p-value 1.08% 0.00003 0.47300
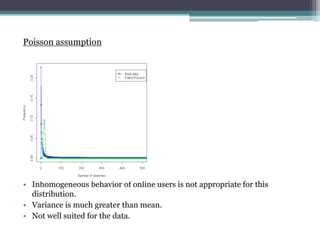
- 7. Poisson assumption ? Inhomogeneous behavior of online users is not appropriate for this distribution. ? Variance is much greater than mean. ? Not well suited for the data.
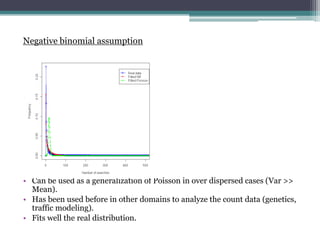
- 8. Negative binomial assumption ? Can be used as a generalization of Poisson in over dispersed cases (Var >> Mean). ? Has been used before in other domains to analyze the count data (genetics, traffic modeling). ? Fits well the real distribution.
- 9. Poisson X ~ Pois(?), if: P(X=k) = e-? ?k / k! , k=0,1,2,ˇ X has mean and variance both equal to the Poisson parameter ?. Hypothesis: H0: ?A=?B HA: ?A<?B Distribution of difference between means: ? ? ?~?(? ? ? ? ?, ? ? 2 ? + ? ? 2 ? ) Probability of obtaining a test statistic at least as extreme as the one that was actually observed, assuming that the null hypothesis is true: ????? = ¦µ ? ?? ?? ?+? / ?? ? , ? - means of 2 groups, ? ¨C Poisson parameter, ? ¨C test duration and ?, ? ¨C size of test groups.
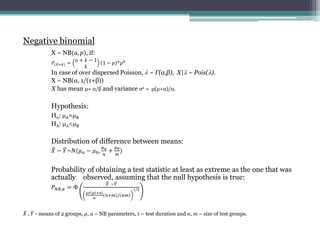
- 10. Negative binomial X ~ NB(?, ?), if: ?(?=?) = ? + ? ? 1 ? 1 ? ? ? ? ? In case of over dispersed Poisson, ? ~ ¦Ł(¦Á,¦Â), X|? ~ Pois(?). X ~ NB(¦Á, 1/(1+¦Â)) X has mean ¦Ě= ¦Á/¦Â and variance ¦Ň2 = ¦Ě(¦Ě+¦Á)/¦Á. Hypothesis: H0: ?A=?B HA: ?A<?B Distribution of difference between means: ? ? ?~?(? ? ? ? ?, ? ? ? + ? ? ? ) Probability of obtaining a test statistic at least as extreme as the one that was actually observed, assuming that the null hypothesis is true: ? ??,? = ¦µ ? ?? ?? ??+? ? ?+? / ?? 1/2 ? , ? - means of 2 groups, ?, ? ¨C NB parameters, ? ¨C test duration and ?, ? ¨C size of test groups.
- 11. Results (Test 1): The difference is not significant by NB. Results of using the proper methodology: ? Saved production from unnecessary change ? Allow to benefit from additional features in A group A B # Users 17,287 17,295 #Activity 297,485 300,843 Average (¦Ě) 17.21 17.39 StDev 45.83 44.03 % Difference Poisson p-value NB p-value 1.08% 0.00003 0.47300
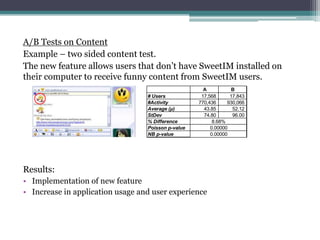
- 12. A/B Tests on Content Example ¨C two sided content test. The new feature allows users that donˇŻt have SweetIM installed on their computer to receive funny content from SweetIM users. Results: ? Implementation of new feature ? Increase in application usage and user experience A B # Users 17,568 17,843 #Activity 770,436 930,066 Average (¦Ě) 43.85 52.12 StDev 74.80 96.00 % Difference Poisson p-value NB p-value 0.00000 8.68% 0.00000
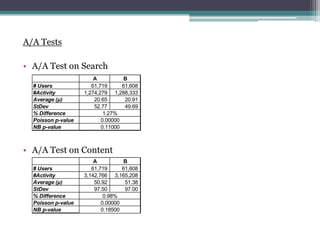
- 13. A/A Tests Required for checking: ? The randomization algorithm and distribution system. ? The technical aspects of the A/B testing system. ? The properness of methodology, hypothesis and analysis. ? The existence of robots and crawlers. LP Visit Control (A) ¨C 50% No Change Control (A) ¨C 50% No Change
- 14. A/A Tests ? A/A Test on Search ? A/A Test on Content A B # Users 61,719 61,608 #Activity 1,274,279 1,288,333 Average (¦Ě) 20.65 20.91 StDev 52.77 49.69 % Difference Poisson p-value NB p-value 1.27% 0.00000 0.11000 A B # Users 61,719 61,608 #Activity 3,142,766 3,165,208 Average (¦Ě) 50.92 51.38 StDev 97.50 97.00 % Difference Poisson p-value NB p-value 0.98% 0.00000 0.18500
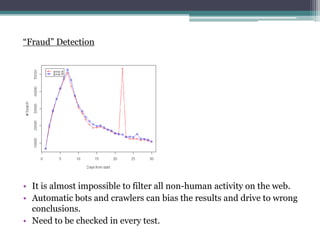
- 15. ˇ°Fraudˇ± Detection ? It is almost impossible to filter all non-human activity on the web. ? Automatic bots and crawlers can bias the results and drive to wrong conclusions. ? Need to be checked in every test.
- 16. Conclusions ? Overview of SweetIM A/B Testing system. ? Some insights on statistical aspects of A/B Testing methodology as related to count data analysis. ? Suggestion to use negative binomial approach instead of incorrect Poisson in case of over dispersed count data. ? Real-world examples of A/B and A/A tests from SweetIM. ? A word about fraud
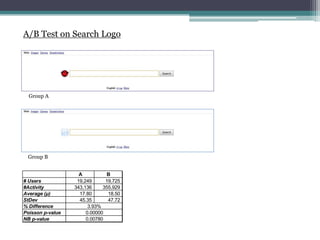
- 17. A/B Test on Search Logo Group A Group B Which one was better?
- 18. A/B Test on Search Logo Group A Group B A B # Users 19,249 19,725 #Activity 343,136 355,929 Average (¦Ě) 17.80 18.50 StDev 45.35 47.72 % Difference Poisson p-value NB p-value 3.93% 0.00000 0.00780
- 19. Thank You!

