際際滷

際際滷Share a Scribd company logo
Visualisation, Mobility &
                                                       Self-Service Reporting
                                                       A/NZ BI Trends
                                                       Survey 2011-12 Results


Patrick Spedding
Strategic Advisor, Business Intelligence & Analytics
patrick@see-change.com.au


    au.linkedin.com/in/spedding            @spedding


Copyright @ 2012 See-Change Solutions
A/NZ BI Survey - Demographics


                                          *Survey Response Rate = 7.52%
                                          *Sample size = 230

  Copyright @ 2012 See-Change Solutions
A/NZ BI Survey - Results
Q1: What challenges do you face when relying on your data to drive performance?

Unable to effectively analyse corporate data                                 38.16%
Poor Data Quality                                                            44.30%
Unable to access the correct data                                            25.44%
Disparate systems                                                            53.95%
Unreliable Data                                                              25.00%

             120

             100

              80

              60

               40              78             94                              110
               20
                                                               54
                   0                                                                             51
                          Unable to
                          effectively    Poor Data
                                       Quality (45.4%)    Unable to
                           analyse                        access the       Disparate
                        corporate data                   correct data   systems (53.1%)   Unreliable Data
                           (37.7%)                         (26.1%)                           (24.6%)


                                                                                                            *Sample size = 230

                       Copyright @ 2012 See-Change Solutions
A/NZ BI Survey - Results
Q2: Are you able to provide your business users dashboards/scorecards that show current
performance information?

   Yes:           59.65%
   No:            40.35%


                                92

                                                                Yes (59.65%)
                                                          136
                                                                No (40.35%)


                                                                               *Sample size = 228

                  Copyright @ 2012 See-Change Solutions
A/NZ BI Survey - Results
 Q3: How long do you spend each month preparing regular reports?

Less than a day                                      16.23%
1-2 days                                             21.93%
3 days                                               10.96%
4 days                                               10.53%
Five or more days                                    26.75%
Dont know                                           13.60%

         60

         50

         40

         30
                                50                                 55
         20
                    33                                                        28
         10                                 21            20
          0
              Less than a   1-2 days     3 days       4 days     Five or Dont know
              day (15.9%)   (24.2%)     (10.1%)       (9.7%)   more days  (13.5%)
                                                                (26.6%)
                                                                                      *Sample size = 228

                  Copyright @ 2012 See-Change Solutions
A/NZ BI Survey - Results
Q4: Are any of your existing query & reporting processes carried out using spreadsheets?

    Yes:             89.94%
    No:              10.06%


                                       22


                                                                Yes (89.4%)
                                                                No (10.4%)


                                                    185


                                                                              *Sample size = 228

                     Copyright @ 2012 See-Change Solutions
A/NZ BI Survey - Results
Q5: Are business users across your organisation able to create their own ad-hoc reports, or do
they rely on others to amend/change existing reports?

    Able to create                             38.16%
    Rely on others                             58.33%
    No ability to create                       3.51%


                                           8


                                                                Able to create (38.16%)
                                                           87
                                                                Rely on others (58.33%)


                                                                No ability to create
                                133                             (3.51%)


                                                                                          *Sample size = 228

                   Copyright @ 2012 See-Change Solutions
A/NZ BI Survey - Results
Q6: When is your organisation considering new reporting/business intelligence project requirements?


    Currently evaluating                            39.91%
    Next 6 months                                   12.72%
    6-12 months                                     10.53%
    >12 months                                      36.84%

    (Evaluating in < 12 months                      63.16% )
              100
               90
               80
                70
                60
                50
                 40                      91
                 30
                 20                                                                 84
                  10
                   0                                    29
                                                                      24

                                    Currently
                                    evaluating   Next 6 months
                                                   (12.72%)      6-12 months
                                     (39.91%)
                                                                   (10.53%)    >12 months
                                                                                (36.84%)

                                                                                            *Sample size = 228

                       Copyright @ 2012 See-Change Solutions
A/NZ BI Survey - Results
  Do your executives request                              Do business users across your
frequent reports and company                             organisation have the ability to
    performance updates?                                 easily create reports using data
                                                         from multiple date sources and
                                                        share those reports with others?


                                          Yes (96.2%)
                                                                                              Yes (38.5%)
                                          No (3.8% )
                                                                                              No (61.5%)


                                                                          *Sample size = 55

             Copyright @ 2012 See-Change Solutions
A/NZ BI Survey - Results
Which of the following are of most interest to you/your organisation:
        Visualization
        Mobile BI
        Self-Service/Operational Reporting


    Self Service

   Visualization

      Mobile BI

                   0        10         20           30   40   50   60   70


                                                                        *Sample size = 96

            Copyright @ 2012 See-Change Solutions
A/NZ BI Survey - Results
What is your organisations preferred Mobile platform?
        i OS (iPhone, iPad)
        Blackberry
        Android                                                   iOS
        Symbian
                                                                   Blackberry
        Windows Mobile
        Other
                                                                   Android

                                                                   Windows
                                                                   Mobile


                                                         *Sample size = 96

                 Copyright @ 2012 See-Change Solutions
THANK YOU.


See-Change Solutions
patrick@see-change.com.au


   au.linkedin.com/in/spedding

   @spedding


www.see-change.com.au

Copyright @ 2012 See-Change Solutions
Ad

Recommended

Twelve Heuristics for Solving Tough Problems Faster and Better
TechWell
Hr Global Interviewing Study Results For Participants
jameshartmannzrg
Webinar 160210
Webinar 160210
peterthomson
GMAT Review 12th Edition
Sumit Chhabra
Workforce Management Survey 2010
TimeandAttendance
What's Your Business Grade?
TalkTalk Business
Using the information server toolset to deliver end to end traceability
IBM Sverige
Improving workplaceperformance
EasyAsk
Power com for-worldwide-office2007-sample-english
PowerCom ARS
CCBA Pilot Results 2010
Equinox IT
Insurance Trends
Insurance Trends
Chris Sparshott
B2 B Barometer Wave 6 Report
debbiemwilliams
B2B Barometer Wave 6 Report
debbiemwilliams
B2B barometer q1 2012 slide deck
TheIDM
Business driven BI - Self-service Techniques
Eckerson Group
The KPI's of job board Success
Ecom Digital
Results
Results
Nadia Dani
Development survey 2010
Membership Consultants, Inc.
The new reality strategic partnerships under scrutiny 6:26:12
The Avoca Group
Moral Panics over the Internet
Oxford Martin Centre, OII, and Computer Science at the University of Oxford
BIG Consumer Snapshot November 2012
Prosper Business Development
The CMO Survey Highlights and Insights February 2012
christinemoorman
B2 B Barometer Q3 2011
debbiemwilliams
Vendor Performance Management survey results nov 7th
Gerald Ford
Extending the Self-Service Capabilities of SAP BI with SAP BusinessObjects Ex...
SAP Analytics
Is Agile The New Waterfall
frankmt
British Attitudes to Business Ethics
Ipsos UK
Pricing Success in an Inflationary Economy
G3 Communications
Smart Cities Week Australia 2019 - Case Study: Idaho National Laboratory
Patrick Spedding
AlohaCloud for Smart Cities
Patrick Spedding

More Related Content

Similar to A/NZ BI Survey Results 2011-12 (20)

Power com for-worldwide-office2007-sample-english
PowerCom ARS
CCBA Pilot Results 2010
Equinox IT
Insurance Trends
Insurance Trends
Chris Sparshott
B2 B Barometer Wave 6 Report
debbiemwilliams
B2B Barometer Wave 6 Report
debbiemwilliams
B2B barometer q1 2012 slide deck
TheIDM
Business driven BI - Self-service Techniques
Eckerson Group
The KPI's of job board Success
Ecom Digital
Results
Results
Nadia Dani
Development survey 2010
Membership Consultants, Inc.
The new reality strategic partnerships under scrutiny 6:26:12
The Avoca Group
Moral Panics over the Internet
Oxford Martin Centre, OII, and Computer Science at the University of Oxford
BIG Consumer Snapshot November 2012
Prosper Business Development
The CMO Survey Highlights and Insights February 2012
christinemoorman
B2 B Barometer Q3 2011
debbiemwilliams
Vendor Performance Management survey results nov 7th
Gerald Ford
Extending the Self-Service Capabilities of SAP BI with SAP BusinessObjects Ex...
SAP Analytics
Is Agile The New Waterfall
frankmt
British Attitudes to Business Ethics
Ipsos UK
Pricing Success in an Inflationary Economy
G3 Communications
Power com for-worldwide-office2007-sample-english
PowerCom ARS
CCBA Pilot Results 2010
Equinox IT
B2 B Barometer Wave 6 Report
debbiemwilliams
B2B Barometer Wave 6 Report
debbiemwilliams
B2B barometer q1 2012 slide deck
TheIDM
Business driven BI - Self-service Techniques
Eckerson Group
The KPI's of job board Success
Ecom Digital
The new reality strategic partnerships under scrutiny 6:26:12
The Avoca Group
The CMO Survey Highlights and Insights February 2012
christinemoorman
B2 B Barometer Q3 2011
debbiemwilliams
Vendor Performance Management survey results nov 7th
Gerald Ford
Extending the Self-Service Capabilities of SAP BI with SAP BusinessObjects Ex...
SAP Analytics
Is Agile The New Waterfall
frankmt
British Attitudes to Business Ethics
Ipsos UK
Pricing Success in an Inflationary Economy
G3 Communications

More from Patrick Spedding (7)

Smart Cities Week Australia 2019 - Case Study: Idaho National Laboratory
Patrick Spedding
AlohaCloud for Smart Cities
Patrick Spedding
Vision2015-CBS-1148-Final
Patrick Spedding
1011
1011
Patrick Spedding
SAS/Cognos Integration Approaches
Patrick Spedding
SAS/Tableau integration
Patrick Spedding
Visualization, Mobility and Analytical Reporting
Patrick Spedding
Smart Cities Week Australia 2019 - Case Study: Idaho National Laboratory
Patrick Spedding
AlohaCloud for Smart Cities
Patrick Spedding
Vision2015-CBS-1148-Final
Patrick Spedding
SAS/Cognos Integration Approaches
Patrick Spedding
SAS/Tableau integration
Patrick Spedding
Visualization, Mobility and Analytical Reporting
Patrick Spedding
Ad

A/NZ BI Survey Results 2011-12

  • 1. Visualisation, Mobility & Self-Service Reporting A/NZ BI Trends Survey 2011-12 Results Patrick Spedding Strategic Advisor, Business Intelligence & Analytics patrick@see-change.com.au au.linkedin.com/in/spedding @spedding Copyright @ 2012 See-Change Solutions
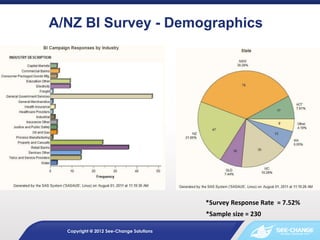
  • 2. A/NZ BI Survey - Demographics *Survey Response Rate = 7.52% *Sample size = 230 Copyright @ 2012 See-Change Solutions
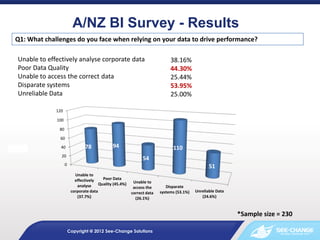
  • 3. A/NZ BI Survey - Results Q1: What challenges do you face when relying on your data to drive performance? Unable to effectively analyse corporate data 38.16% Poor Data Quality 44.30% Unable to access the correct data 25.44% Disparate systems 53.95% Unreliable Data 25.00% 120 100 80 60 40 78 94 110 20 54 0 51 Unable to effectively Poor Data Quality (45.4%) Unable to analyse access the Disparate corporate data correct data systems (53.1%) Unreliable Data (37.7%) (26.1%) (24.6%) *Sample size = 230 Copyright @ 2012 See-Change Solutions
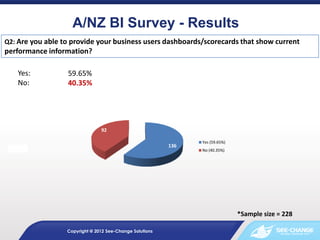
  • 4. A/NZ BI Survey - Results Q2: Are you able to provide your business users dashboards/scorecards that show current performance information? Yes: 59.65% No: 40.35% 92 Yes (59.65%) 136 No (40.35%) *Sample size = 228 Copyright @ 2012 See-Change Solutions
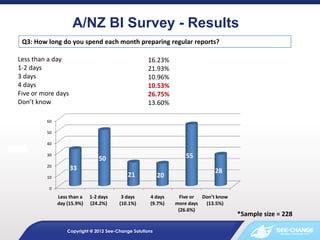
  • 5. A/NZ BI Survey - Results Q3: How long do you spend each month preparing regular reports? Less than a day 16.23% 1-2 days 21.93% 3 days 10.96% 4 days 10.53% Five or more days 26.75% Dont know 13.60% 60 50 40 30 50 55 20 33 28 10 21 20 0 Less than a 1-2 days 3 days 4 days Five or Dont know day (15.9%) (24.2%) (10.1%) (9.7%) more days (13.5%) (26.6%) *Sample size = 228 Copyright @ 2012 See-Change Solutions
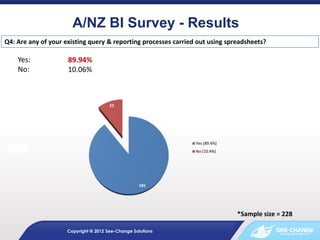
  • 6. A/NZ BI Survey - Results Q4: Are any of your existing query & reporting processes carried out using spreadsheets? Yes: 89.94% No: 10.06% 22 Yes (89.4%) No (10.4%) 185 *Sample size = 228 Copyright @ 2012 See-Change Solutions
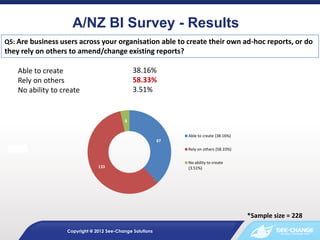
  • 7. A/NZ BI Survey - Results Q5: Are business users across your organisation able to create their own ad-hoc reports, or do they rely on others to amend/change existing reports? Able to create 38.16% Rely on others 58.33% No ability to create 3.51% 8 Able to create (38.16%) 87 Rely on others (58.33%) No ability to create 133 (3.51%) *Sample size = 228 Copyright @ 2012 See-Change Solutions
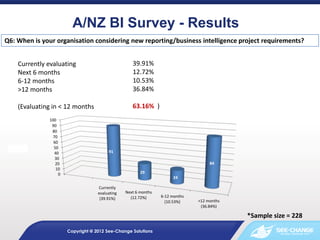
  • 8. A/NZ BI Survey - Results Q6: When is your organisation considering new reporting/business intelligence project requirements? Currently evaluating 39.91% Next 6 months 12.72% 6-12 months 10.53% >12 months 36.84% (Evaluating in < 12 months 63.16% ) 100 90 80 70 60 50 40 91 30 20 84 10 0 29 24 Currently evaluating Next 6 months (12.72%) 6-12 months (39.91%) (10.53%) >12 months (36.84%) *Sample size = 228 Copyright @ 2012 See-Change Solutions
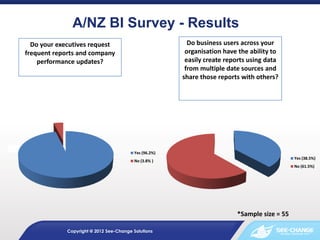
  • 9. A/NZ BI Survey - Results Do your executives request Do business users across your frequent reports and company organisation have the ability to performance updates? easily create reports using data from multiple date sources and share those reports with others? Yes (96.2%) Yes (38.5%) No (3.8% ) No (61.5%) *Sample size = 55 Copyright @ 2012 See-Change Solutions
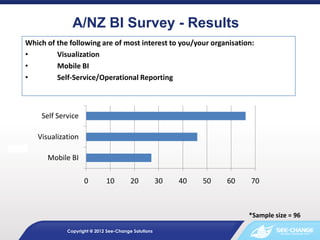
  • 10. A/NZ BI Survey - Results Which of the following are of most interest to you/your organisation: Visualization Mobile BI Self-Service/Operational Reporting Self Service Visualization Mobile BI 0 10 20 30 40 50 60 70 *Sample size = 96 Copyright @ 2012 See-Change Solutions
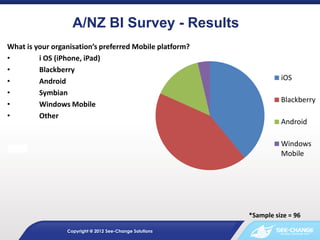
  • 11. A/NZ BI Survey - Results What is your organisations preferred Mobile platform? i OS (iPhone, iPad) Blackberry Android iOS Symbian Blackberry Windows Mobile Other Android Windows Mobile *Sample size = 96 Copyright @ 2012 See-Change Solutions
  • 12. THANK YOU. See-Change Solutions patrick@see-change.com.au au.linkedin.com/in/spedding @spedding www.see-change.com.au Copyright @ 2012 See-Change Solutions