Results
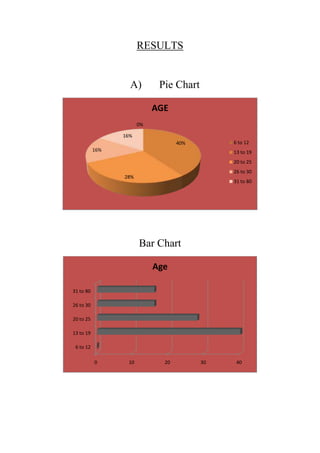
- 1. RESULTS A) Pie Chart AGE 0% 16% 40% 6 to 12 16% 13 to 19 20 to 25 26 to 30 28% 31 to 80 Bar Chart Age 31 to 80 26 to 30 20 to 25 13 to 19 6 to 12 0 10 20 30 40
- 2. B) Pie Chart GENDER 44% 56% Male Female Bar Chart Gender Female Male 0 10 20 30 40 50 60
- 3. C) Pie Chart RACE 3%0% 5% Malay Chinese Indian 92% Others Bar Chart RACE Others Indian Chinese Malay 0 20 40 60 80 100
- 4. d) Pie Chart Employment 3% 0% 32% Student Employed 65% Unemployed Retired Bar Chart Employment Retired Unemployed Employed Student 0 10 20 30 40 50 60 70
- 5. e) Pie Chart Alleriges 28% Yes 72% No Bar Chart Allergies No Yes 0 20 40 60 80
- 6. F) Pie Chart Health Issues 14% Yes No 86% Bar Chart Health Issues No Yes 0 20 40 60 80 100
- 7. G) Pie Chart How often do you go for a foot massage? 2% 7% 19% Daily 52% Weekly Monthly 20% Yearly Others Bar Chart How often do you go for a foot massage? Others Yearly Monthly Weekly Daily 0 10 20 30 40 50 60
- 8. H) Pie Chart Before Treatment 6% 7% 47% Sore Tired 40% Stressed Sleepy Bar Chart Before treatment Sleepy Stressed Tired Sore 0 10 20 30 40 50
- 9. I) Pie Chart After Treatment 11% 8% Relaxed & Very Satisfied Long term-aches & Pain 81% Not satisfied Bar Chart After treatment Not satisfied Long term-aches & Pain Relaxed & Very Satisfied 0 20 40 60 80 100
- 10. J) Pie Chart Duration 4% 36% 34% 15 min 30 min 1 hour 26% >2 hours Bar Chart Duration >2 hours 1 hour 30 min 15 min 0 10 20 30 40
- 11. K) Pie Chart Is it affordable? 15% Yes 85% No Bar Chart Is it affortable? No Yes 0 20 40 60 80 100
- 12. L) Pie Chart Is it time-consuming? 33% 67% Yes No Bar Chart Is it time-consuming? No n Yes 0 20 40 60 80
- 13. M) Pie Chart Does it usually interrupt your schedule? 23% Yes 77% No Bar Chart Does it usually interrupt your schedule? No Yes 0 20 40 60 80
- 14. N) Pie Chart Reason 13% 3% Relaxation Word of mouth (influence 84% from other people) Beauty purposes Bar Chart Reason Beauty purposes Word of mouth (influence from other people) Relaxation 0 20 40 60 80 100
- 15. O) Pie Chart Quality 8% 33% Not important 59% Important Very important Bar Chart Quality Very important Important Not important 0 10 20 30 40 50 60
- 16. P) Pie Chart Price review 4. 4% 38. 38% Not important 58% Important Very important Bar Chart Price Review Very important Important n Not important 0 10 20 30 40 50 60
- 17. Q) Pie Chart How important is the uniqueness and authenticity of the massage therapy to you? 23% 17% Not important Important 60% Very Important Bar Chart How important is the uniqueness and authenticity of the massage therapy to you? Very Important Important Not important 0 10 20 30 40 50 60
- 18. R) Pie Chart Ever been cheated in a massage parlour? 10% Yes 90% No Bar Chart Ever been cheated in a massage parlour? No Yes 0 20 40 60 80 100
- 19. S) Pie Chart Do you prefer your massage therapist to be of the opposite gender? 27% 73% Yes No Bar Chart Do you prefer your massage therapist to be of the opposite gender? No n Yes 0 20 40 60 80
- 20. T) Pie Chart Services 17% Yes 83% No Bar Chart Services No n Yes 0 20 40 60 80 100
- 21. U) Pie Chart Which masseuse/masseur do you prefer 3% 36% 36% Indian Malay 25% Chinese Others Bar Chart Which masseuse/masseur do you prefer Others Chinese Malay Indian 0 10 20 30 40
- 22. V) Pie Chart having multiple clients with their own masseuese/masseur in the same room 35% 65% It's okay It's a problem to me Bar Chart having multiple clients with their own masseuese/masseur in the same room It's a problem to me It's okay 0 10 20 30 40 50 60 70

