Best Practices for Data Visualization

This document discusses how the Foundation Center uses visualizations to analyze philanthropic data and enhance grantmaking effectiveness. It summarizes how the Foundation Center collects, cleans and codes data from tax forms on over 106,000 foundations to create an open database. It then shows examples of how visualizations of this data have been used for fundraising, advocacy, decision-making and enabling collaborations. Specific visualizations shown analyze trends in U.S. foundation assets, funding around natural disasters, and comparisons of Foundation Center and World Bank funding locations and amounts. The document concludes that visualizations have helped create a more complete picture of global philanthropic activity and funding gaps, and inspired better data standards in the field.

Best Practices for Data Visualization
- 1. Putting Visualizations to Work NTEN Webinar January 24, 2013 Jake Garcia Geographer The Foundation Center New York, NY
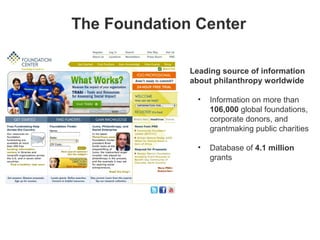
- 2. The Foundation Center Leading source of information about philanthropy worldwide ŌĆó Information on more than 106,000 global foundations, corporate donors, and grantmaking public charities ŌĆó Database of 4.1 million grants
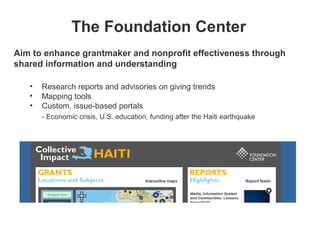
- 3. The Foundation Center Aim to enhance grantmaker and nonprofit effectiveness through shared information and understanding ŌĆó Research reports and advisories on giving trends ŌĆó Mapping tools ŌĆó Custom, issue-based portals - Economic crisis, U.S. education, funding after the Haiti earthquake
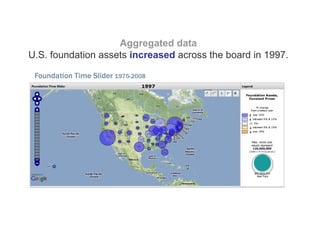
- 4. Aggregated data U.S. foundation assets increased across the board in 1997.
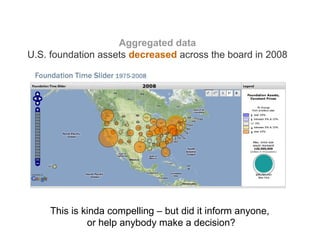
- 5. Aggregated data U.S. foundation assets decreased across the board in 2008 This is kinda compelling ŌĆō but did it inform anyone, or help anybody make a decision?
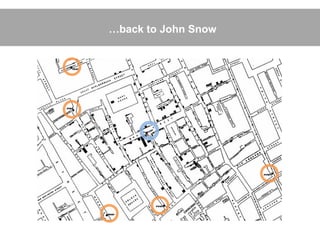
- 6. John SnowŌĆÖs cholera map, London, 1854
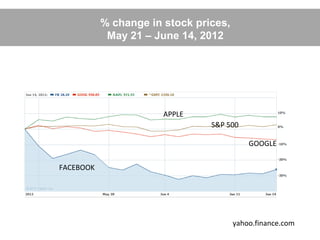
- 7. % change in stock prices, May 21 ŌĆō June 14, 2012 APPLE S&P 500 GOOGLE FACEBOOK yahoo.finance.com
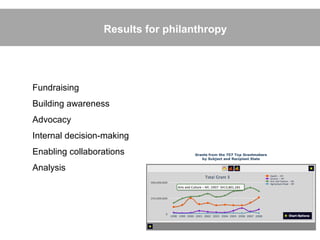
- 8. Results for philanthropy Fundraising Building awareness Advocacy Internal decision-making Enabling collaborations Analysis
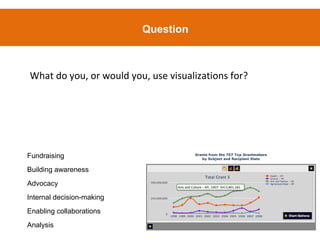
- 9. Question What do you, or would you, use visualizations for? Fundraising Building awareness Advocacy Internal decision-making Enabling collaborations Analysis
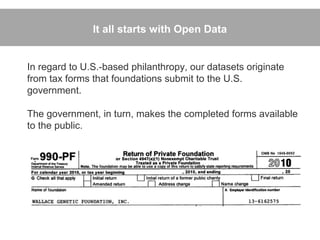
- 10. It all starts with Open Data In regard to U.S.-based philanthropy, our datasets originate from tax forms that foundations submit to the U.S. government. The government, in turn, makes the completed forms available to the public.
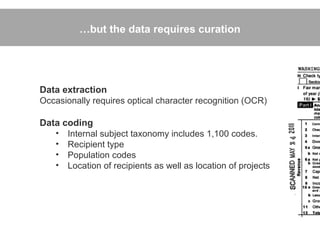
- 11. ŌĆ”but the data requires curation Data extraction Occasionally requires optical character recognition (OCR) Data coding ŌĆó Internal subject taxonomy includes 1,100 codes. ŌĆó Recipient type ŌĆó Population codes ŌĆó Location of recipients as well as location of projects
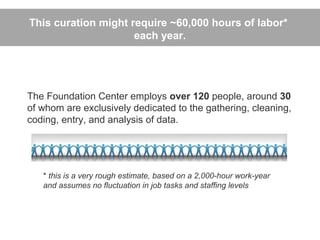
- 12. This curation might require ~60,000 hours of labor* each year. The Foundation Center employs over 120 people, around 30 of whom are exclusively dedicated to the gathering, cleaning, coding, entry, and analysis of data. * this is a very rough estimate, based on a 2,000-hour work-year and assumes no fluctuation in job tasks and staffing levels
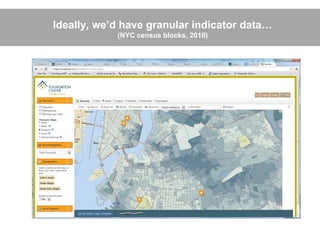
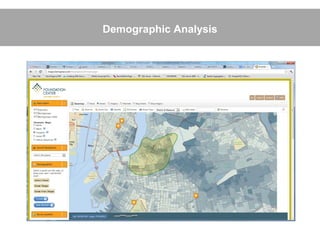
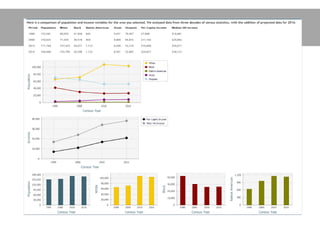
- 13. Ideally, weŌĆÖd have granular indicator dataŌĆ” (NYC census blocks, 2010)
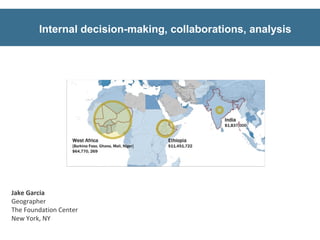
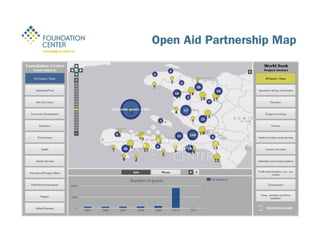
- 16. Internal decision-making, collaborations, analysis Jake Garcia Geographer The Foundation Center New York, NY
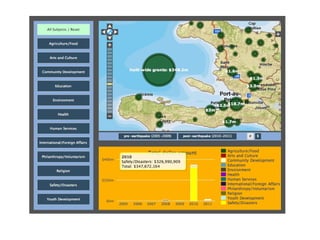
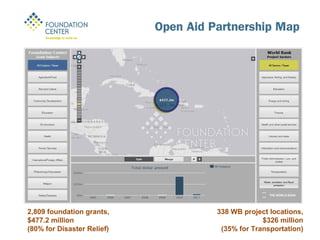
- 19. 2,809 foundation grants, 338 WB project locations, $477.2 million $326 million (80% for Disaster Relief) (35% for Transportation)
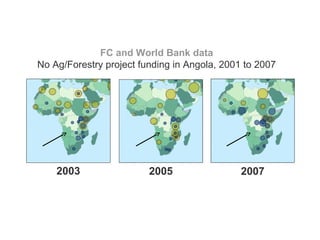
- 20. FC and World Bank data No Ag/Forestry project funding in Angola, 2001 to 2007 2003 2005 2007
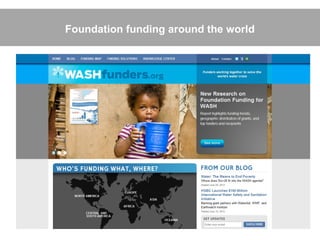
- 21. Foundation funding around the world
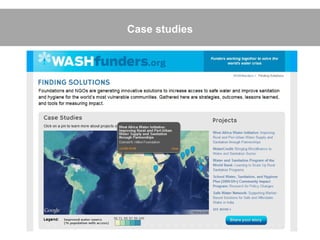
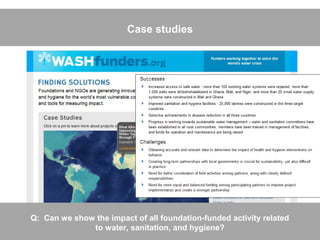
- 22. Case studies
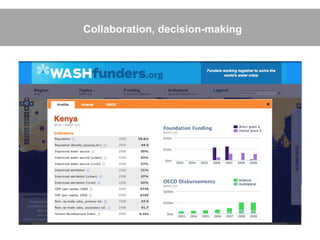
- 23. Case studies Q: Can we show the impact of all foundation-funded activity related to water, sanitation, and hygiene?
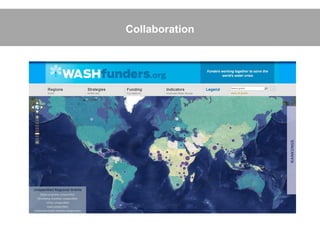
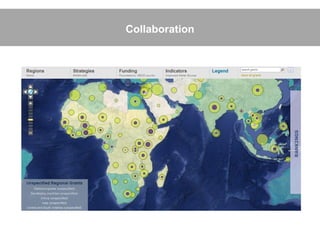
- 24. Collaboration
- 25. Collaboration
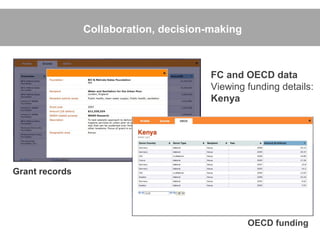
- 27. Collaboration, decision-making FC and OECD data Viewing funding details: Kenya Grant records OECD funding
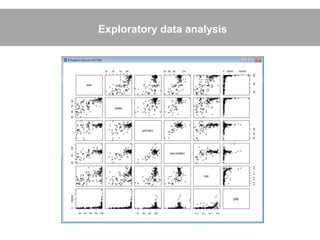
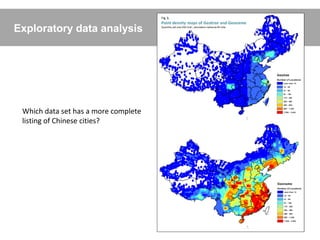
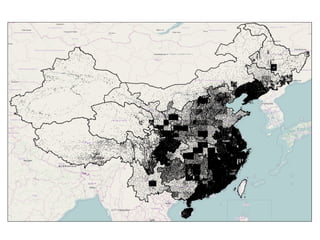
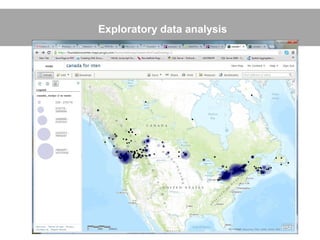
- 30. Exploratory data analysis Which data set has a more complete listing of Chinese cities?
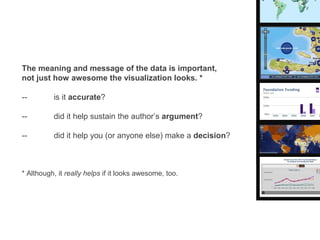
- 33. The meaning and message of the data is important, not just how awesome the visualization looks. * -- is it accurate? -- did it help sustain the authorŌĆÖs argument? -- did it help you (or anyone else) make a decision? * Although, it really helps if it looks awesome, too.
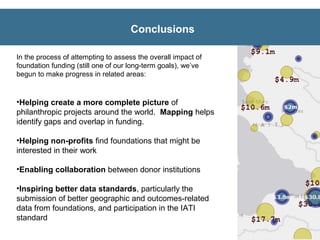
- 34. Conclusions In the process of attempting to assess the overall impact of foundation funding (still one of our long-term goals), weŌĆÖve begun to make progress in related areas: ŌĆóHelping create a more complete picture of philanthropic projects around the world. Mapping helps identify gaps and overlap in funding. ŌĆóHelping non-profits find foundations that might be interested in their work ŌĆóEnabling collaboration between donor institutions ŌĆóInspiring better data standards, particularly the submission of better geographic and outcomes-related data from foundations, and participation in the IATI standard
- 35. ŌĆ”back to John Snow
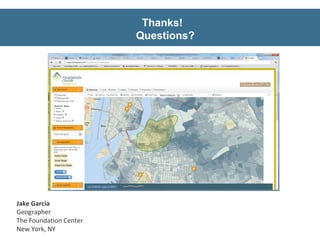
- 36. Thanks! Questions? Jake Garcia Geographer The Foundation Center New York, NY