際際滷

際際滷Share a Scribd company logo
Chapter 36
                                                   Population
                                                    Ecology
                                      Lecture Outline


Copyright 息 The McGraw-Hill Companies, Inc. Permission required for reproduction or display.
 http://www.youtube.com/watch?v=8IKCOjE4eDM
36.1 Ecology is studied
            at various levels
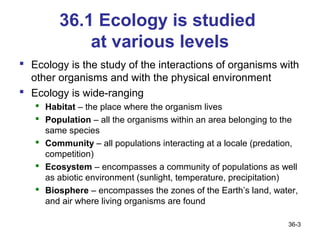
 Ecology is the study of the interactions of organisms with
  other organisms and with the physical environment
 Ecology is wide-ranging
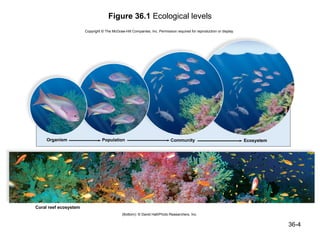
    Habitat  the place where the organism lives
    Population  all the organisms within an area belonging to the
     same species
    Community  all populations interacting at a locale (predation,
     competition)
    Ecosystem  encompasses a community of populations as well
     as abiotic environment (sunlight, temperature, precipitation)
    Biosphere  encompasses the zones of the Earths land, water,
     and air where living organisms are found

                                                                 36-3
Figure 36.1 Ecological levels
                       Copyright 息 The McGraw-Hill Companies, Inc. Permission required for reproduction or display.


     Organism                    Population                                Community                                  Ecosystem


Coral reef ecosystem
                                             (Bottom): 息 David Hall/Photo Researchers, Inc.


                                                                                                                                  36-4
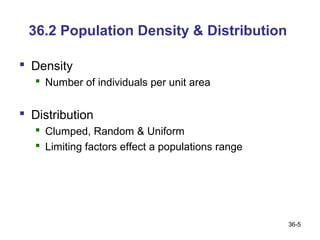
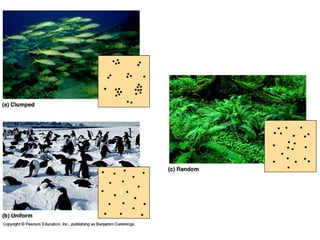
36.2 Population Density & Distribution

 Density
    Number of individuals per unit area


 Distribution
    Clumped, Random & Uniform
    Limiting factors effect a populations range


                                                   36-5
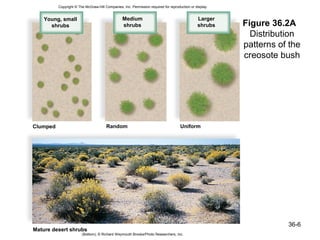
Copyright 息 The McGraw-Hill Companies, Inc. Permission required for reproduction or display.


    Young, small                                 Medium                                        Larger
      shrubs                                     shrubs                                        shrubs    Figure 36.2A
                                                                                                           Distribution
                                                                                                         patterns of the
                                                                                                         creosote bush


Clumped                                Random                                        Uniform


                                                                                                                    36-6
Mature desert shrubs
                        (Bottom); 息 Richard Weymouth Brooks/Photo Researchers, Inc.
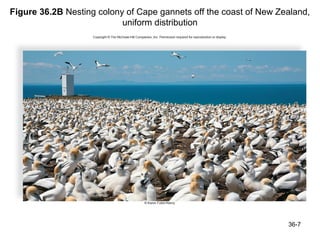
Figure 36.2B Nesting colony of Cape gannets off the coast of New Zealand,
                           uniform distribution


                                                                   36-7
Bio 100 Chapter 36
36.3 The growth rate results in
     population size changes
 A populations annual growth rate depends on
   Number that are born & die each
   Annual immigration (coming in) & emigration (leaving)


 Biotic potential of a population is the highest
  possible growth rate
   Achieved when resources are unlimited
   Rare in nature


                                                      36-9
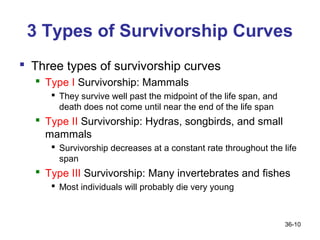
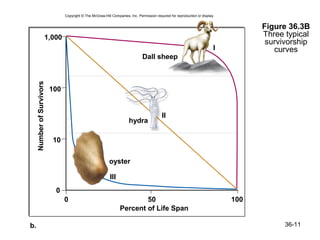
3 Types of Survivorship Curves
 Three types of survivorship curves
   Type I Survivorship: Mammals
      They survive well past the midpoint of the life span, and
       death does not come until near the end of the life span
   Type II Survivorship: Hydras, songbirds, and small
    mammals
      Survivorship decreases at a constant rate throughout the life
       span
   Type III Survivorship: Many invertebrates and fishes
      Most individuals will probably die very young


                                                                   36-10
Copyright 息 The McGraw-Hill Companies, Inc. Permission required for reproduction or display.


                                                                                                                                      Figure 36.3B
                       1,000                                                                                                          Three typical
                                                                                                                                       survivorship
                                                                                                                            I            curves
                                                                                Dall sheep
     Number of Survivors


                           100


                                                                                            II
                                                                        hydra

                           10

                                                            oyster

                                                            III
                            0
                                 0                                        50                                                    100
                                                                  Percent of Life Span

b.                                                                                                                                          36-11
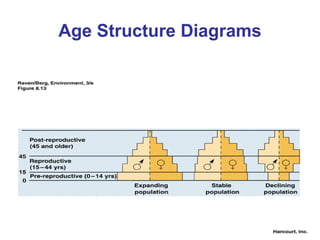
Age Structure Diagrams
Exponential Growth

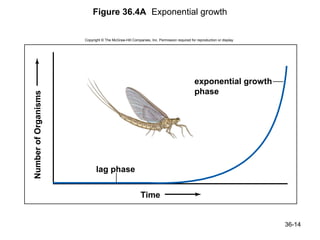
 Exponential Growth

   Results in j-shaped curve with 2 phases
      Lag phase  Growth is slow because the number of
       individuals in the population is small
      Exponential growth phase  Growth is accelerating due to
       biotic potential


   Usually, exponential growth can only continue as long
    as resources in the environment are unlimited

   Ex: Human Population Growth                               36-13
Figure 36.4AExponential growth

                      Copyright 息 The McGraw-Hill Companies, Inc. Permission required for reproduction or display.


                                                                                         exponential growth
                                                                                         phase
Number of Organisms


                            lag phase


                                                        Time


                                                                                                                     36-14
Logistic Growth
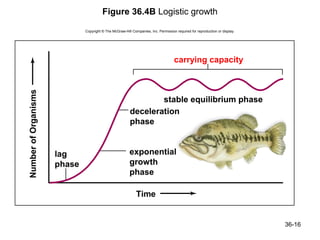
 Logistic Growth  as resources decrease, population
  growth levels off

    S-shaped curve with 4 phases
         Lag phase
         Exponential growth phase
         Deceleration phase
         Stable equilibrium phase
    Growth starts slowly, then goes through an exponential phase

    Carrying Capacity: the maximum number of organisms an
     ecosystem can support.

                                                                36-15
Figure 36.4B Logistic growth

                              Copyright 息 The McGraw-Hill Companies, Inc. Permission required for reproduction or display.


                                                                                    carrying capacity
Number of Organisms


                                                                 stable equilibrium phase
                                                         deceleration
                                                         phase


                      lag                                exponential
                      phase                              growth
                                                         phase

                                                             Time


                                                                                                                             36-16
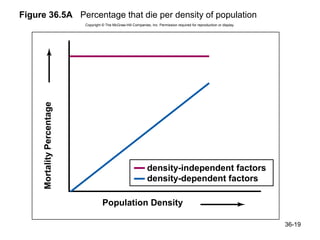
Density-independent factors
 Density-independent factors affect growth

      Percentage of individuals killed remains the same regardless
       of the population size

      Abiotic (or non-living) factors
        Exs: drought, fire, freezes, hurricanes, floods


   Example: A drought on the Gal叩pagos Islands
      Caused the population size of finches to decline from 1,400
       to 200 individuals

                                                                36-17
Density-dependent factors a
 Biotic (or living) factors:

    Competition  when members of same species
     attempt to use needed resources

    Predation  when one living organism, the predator,
     eats another, the prey


                                                       36-18
Figure 36.5A Percentage that die per density of population
                            Copyright 息 The McGraw-Hill Companies, Inc. Permission required for reproduction or display.


     Mortality Percentage


                                                                  density-independent factors
                                                                  density-dependent factors

                                      Population Density

                                                                                                                           36-19
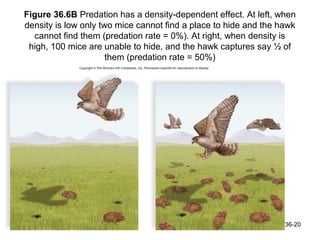
Figure 36.6B Predation has a density-dependent effect. At left, when
density is low only two mice cannot find a place to hide and the hawk
  cannot find them (predation rate = 0%). At right, when density is
 high, 100 mice are unable to hide, and the hawk captures say 遜 of
                      them (predation rate = 50%)


                                                                  36-20
Opportunistic populations
 Opportunistic populations  live in a
  fluctuating and/or unpredictable environments

Exs: dandelions, mice

http://www.youtube.com/watch?v=RTIlOlVT3LI


                                                  36-21
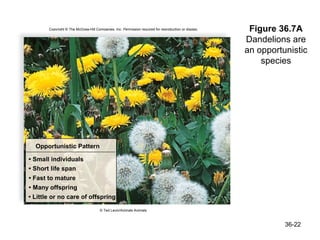
Copyright 息 The McGraw-Hill Companies, Inc. Permission required for reproduction or display.    Figure 36.7A
                                                                                                      Dandelions are
                                                                                                      an opportunistic
                                                                                                          species


  Opportunistic Pattern

 Small individuals
 Short life span
 Fast to mature
 Many offspring
 Little or no care of offspring

                                      息 Ted Levin/Animals Animals


                                                                                                                36-22
Equilibrium populations

 Equilibrium populations  live in relatively
  stable and predictable environments
   Logistic population growth, and remains close to , or
    at, carrying capacity

   Exs: oaks, pines, hawks, eagles, whales, elephants,
    bears, gorillas


                                                       36-23
Copyright 息 The McGraw-Hill Companies, Inc. Permission required for reproduction or display.

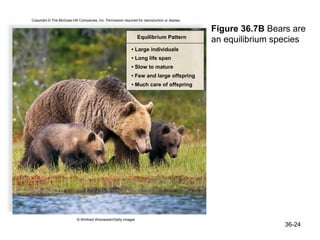
                                                                                               Figure 36.7B Bears are
                                                                 Equilibrium Pattern
                                                                                               an equilibrium species
                                                              Large individuals
                                                              Long life span
                                                              Slow to mature
                                                              Few and large offspring
                                                              Much care of offspring


                           息 Winfried Wisniewski/Getty Images
                                                                                                                36-24
Extinction

 Extinction is the total disappearance of a
  species or higher group

     Slow to mature, few offspring, specialists,
     pretty, valuable to humans

http://www.youtube.com/watch?v=NNmTLLmhxFQ
http://www.youtube.com/watch?v=LaQd7Zfqj7g

                                                   36-25
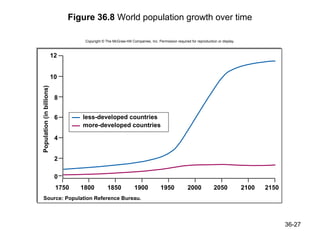
36.8 World population growth is
           exponential
 Worlds population has risen steadily to a
  present size of about 6.8 billion people
   Doubling time: the length of time it takes for the
    population size to double

      Currently, the doubling time is about 51 years

      In 51 years, the world would need double the amount of food,
       jobs, water, energy, and so on just to maintain the present
       standard of living


      Carrying capacity ?
                                                               36-26
Figure 36.8 World population growth over time

                                    Copyright 息 The McGraw-Hill Companies, Inc. Permission required for reproduction or display.


                           12


                           10
Population (in billions)


                            8


                            6      less-developed countries
                                   more-developed countries

                            4


                            2

                            0
                            1750   1800          1850             1900            1950             2000            2050            2100   2150
    Source: Population Reference Bureau.


                                                                                                                                                 36-27
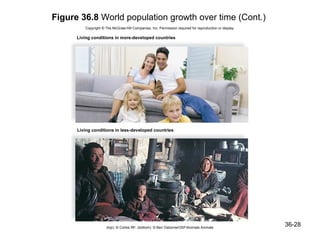
Figure 36.8 World population growth over time (Cont.)
         Copyright 息 The McGraw-Hill Companies, Inc. Permission required for reproduction or display.

      Living conditions in more-developed countries


      Living conditions in less-developed countries


                      (top): 息 Corbis RF; (bottom): 息 Ben Osborne/OSF/Animals Animals
                                                                                                        36-28
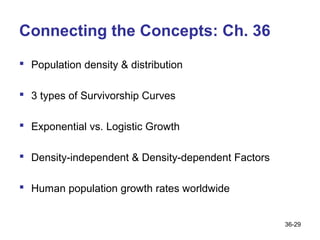
Connecting the Concepts: Ch. 36
 Population density & distribution

 3 types of Survivorship Curves

 Exponential vs. Logistic Growth

 Density-independent & Density-dependent Factors

 Human population growth rates worldwide


                                                    36-29
More Related Content

Bio 100 Chapter 36

  • 1. Chapter 36 Population Ecology Lecture Outline Copyright 息 The McGraw-Hill Companies, Inc. Permission required for reproduction or display.
  • 3. 36.1 Ecology is studied at various levels Ecology is the study of the interactions of organisms with other organisms and with the physical environment Ecology is wide-ranging Habitat the place where the organism lives Population all the organisms within an area belonging to the same species Community all populations interacting at a locale (predation, competition) Ecosystem encompasses a community of populations as well as abiotic environment (sunlight, temperature, precipitation) Biosphere encompasses the zones of the Earths land, water, and air where living organisms are found 36-3
  • 4. Figure 36.1 Ecological levels Copyright 息 The McGraw-Hill Companies, Inc. Permission required for reproduction or display. Organism Population Community Ecosystem Coral reef ecosystem (Bottom): 息 David Hall/Photo Researchers, Inc. 36-4
  • 5. 36.2 Population Density & Distribution Density Number of individuals per unit area Distribution Clumped, Random & Uniform Limiting factors effect a populations range 36-5
  • 6. Copyright 息 The McGraw-Hill Companies, Inc. Permission required for reproduction or display. Young, small Medium Larger shrubs shrubs shrubs Figure 36.2A Distribution patterns of the creosote bush Clumped Random Uniform 36-6 Mature desert shrubs (Bottom); 息 Richard Weymouth Brooks/Photo Researchers, Inc.
  • 7. Figure 36.2B Nesting colony of Cape gannets off the coast of New Zealand, uniform distribution 36-7
  • 9. 36.3 The growth rate results in population size changes A populations annual growth rate depends on Number that are born & die each Annual immigration (coming in) & emigration (leaving) Biotic potential of a population is the highest possible growth rate Achieved when resources are unlimited Rare in nature 36-9
  • 10. 3 Types of Survivorship Curves Three types of survivorship curves Type I Survivorship: Mammals They survive well past the midpoint of the life span, and death does not come until near the end of the life span Type II Survivorship: Hydras, songbirds, and small mammals Survivorship decreases at a constant rate throughout the life span Type III Survivorship: Many invertebrates and fishes Most individuals will probably die very young 36-10
  • 11. Copyright 息 The McGraw-Hill Companies, Inc. Permission required for reproduction or display. Figure 36.3B 1,000 Three typical survivorship I curves Dall sheep Number of Survivors 100 II hydra 10 oyster III 0 0 50 100 Percent of Life Span b. 36-11
  • 13. Exponential Growth Exponential Growth Results in j-shaped curve with 2 phases Lag phase Growth is slow because the number of individuals in the population is small Exponential growth phase Growth is accelerating due to biotic potential Usually, exponential growth can only continue as long as resources in the environment are unlimited Ex: Human Population Growth 36-13
  • 14. Figure 36.4AExponential growth Copyright 息 The McGraw-Hill Companies, Inc. Permission required for reproduction or display. exponential growth phase Number of Organisms lag phase Time 36-14
  • 15. Logistic Growth Logistic Growth as resources decrease, population growth levels off S-shaped curve with 4 phases Lag phase Exponential growth phase Deceleration phase Stable equilibrium phase Growth starts slowly, then goes through an exponential phase Carrying Capacity: the maximum number of organisms an ecosystem can support. 36-15
  • 16. Figure 36.4B Logistic growth Copyright 息 The McGraw-Hill Companies, Inc. Permission required for reproduction or display. carrying capacity Number of Organisms stable equilibrium phase deceleration phase lag exponential phase growth phase Time 36-16
  • 17. Density-independent factors Density-independent factors affect growth Percentage of individuals killed remains the same regardless of the population size Abiotic (or non-living) factors Exs: drought, fire, freezes, hurricanes, floods Example: A drought on the Gal叩pagos Islands Caused the population size of finches to decline from 1,400 to 200 individuals 36-17
  • 18. Density-dependent factors a Biotic (or living) factors: Competition when members of same species attempt to use needed resources Predation when one living organism, the predator, eats another, the prey 36-18
  • 19. Figure 36.5A Percentage that die per density of population Copyright 息 The McGraw-Hill Companies, Inc. Permission required for reproduction or display. Mortality Percentage density-independent factors density-dependent factors Population Density 36-19
  • 20. Figure 36.6B Predation has a density-dependent effect. At left, when density is low only two mice cannot find a place to hide and the hawk cannot find them (predation rate = 0%). At right, when density is high, 100 mice are unable to hide, and the hawk captures say 遜 of them (predation rate = 50%) 36-20
  • 21. Opportunistic populations Opportunistic populations live in a fluctuating and/or unpredictable environments Exs: dandelions, mice http://www.youtube.com/watch?v=RTIlOlVT3LI 36-21
  • 22. Copyright 息 The McGraw-Hill Companies, Inc. Permission required for reproduction or display. Figure 36.7A Dandelions are an opportunistic species Opportunistic Pattern Small individuals Short life span Fast to mature Many offspring Little or no care of offspring 息 Ted Levin/Animals Animals 36-22
  • 23. Equilibrium populations Equilibrium populations live in relatively stable and predictable environments Logistic population growth, and remains close to , or at, carrying capacity Exs: oaks, pines, hawks, eagles, whales, elephants, bears, gorillas 36-23
  • 24. Copyright 息 The McGraw-Hill Companies, Inc. Permission required for reproduction or display. Figure 36.7B Bears are Equilibrium Pattern an equilibrium species Large individuals Long life span Slow to mature Few and large offspring Much care of offspring 息 Winfried Wisniewski/Getty Images 36-24
  • 25. Extinction Extinction is the total disappearance of a species or higher group Slow to mature, few offspring, specialists, pretty, valuable to humans http://www.youtube.com/watch?v=NNmTLLmhxFQ http://www.youtube.com/watch?v=LaQd7Zfqj7g 36-25
  • 26. 36.8 World population growth is exponential Worlds population has risen steadily to a present size of about 6.8 billion people Doubling time: the length of time it takes for the population size to double Currently, the doubling time is about 51 years In 51 years, the world would need double the amount of food, jobs, water, energy, and so on just to maintain the present standard of living Carrying capacity ? 36-26
  • 27. Figure 36.8 World population growth over time Copyright 息 The McGraw-Hill Companies, Inc. Permission required for reproduction or display. 12 10 Population (in billions) 8 6 less-developed countries more-developed countries 4 2 0 1750 1800 1850 1900 1950 2000 2050 2100 2150 Source: Population Reference Bureau. 36-27
  • 28. Figure 36.8 World population growth over time (Cont.) Copyright 息 The McGraw-Hill Companies, Inc. Permission required for reproduction or display. Living conditions in more-developed countries Living conditions in less-developed countries (top): 息 Corbis RF; (bottom): 息 Ben Osborne/OSF/Animals Animals 36-28
  • 29. Connecting the Concepts: Ch. 36 Population density & distribution 3 types of Survivorship Curves Exponential vs. Logistic Growth Density-independent & Density-dependent Factors Human population growth rates worldwide 36-29