ContextualContinuous Profilng
0 likes28 views
The document discusses the concept of contextual continuous profiling in application performance monitoring, highlighting its importance in cloud deployments and continuous delivery. It explains how contextual data can enhance profiling by associating performance information with specific HTTP requests and user inputs, ultimately aiding in code optimization. The speaker outlines features of Datadog's continuous profiler, including its custom context implementation and the mechanisms for efficient context propagation.
1 of 20
Download to read offline

![Introduction
- Active in JVM performance area since 2006
- NetBeans Profiler
- VisualVM [1]
- BTrace [2]
- JMX, Serviceability
- OpenJDK member and Reviewer
- Currently at Datadog in charge of JVM profiling
- In-house profiling agent
- Heavily based on async-profiler [3]
- Participating in OpenJDK
- JFR fixes, backports
- Proposing/implementing new features
Disclaimer
- Examples will be shown in Datadog UI
- Yet, not a Datadog pitch!
[1] https://visualvm.github.io
[2] https://github.com/btraceio/btrace
[3] https://github.com/async-profiler/async-profiler](https://image.slidesharecdn.com/contextualprofilng-230424153916-738a4309/85/ContextualContinuous-Profilng-3-320.jpg)
![JDK Flight Recorder
- Available in JDK 9+ and JDK 8 after update 272
- Capture profiling data on demand
- Jcmd
- JMX
- Streaming available since JDK 14 [1]
[1] https://openjdk.org/jeps/349
[2] https://docs.oracle.com/en/java/javase/11/tools/java.html
[3]
https://docs.oracle.com/javacomponents/jmc-5-5/jfr-command-referenc
e/diagnostic-command-reference.htm
> jcmd myapp.jar JFR.dump name=rec1 filename=dump1.jfr
ŌĆ”
> jcmd myapp.jar JFR.dump name=rec1 filename=dump2.jfr
Start JFR at JVM startup
> java -XX:StartFlightRecording=name=rec1,filename=my_recording.jfr -jar myapp.jar
More JFR options are described in Java Tools Reference [2]
Capture profiling data via JCMD
More JCMD related options are described in JCMD Tool Reference [3]](https://image.slidesharecdn.com/contextualprofilng-230424153916-738a4309/85/ContextualContinuous-Profilng-5-320.jpg)
![JVMTI Agent
- AsyncGetCallTrace
- ŌĆśUnofficialŌĆÖ API to get non-biased stacktraces
- Not really maintained
- Lurking bugs can crash your JVM
- async-profiler [1]
- Widely used fully functional profiler
- Exports to multiple formats
- CSV
- Flamegraph [2]
- JFR binary format
[1] https://github.com/async-profiler/async-profiler
[2] https://www.brendangregg.com/FlameGraphs/cpuflamegraphs.html](https://image.slidesharecdn.com/contextualprofilng-230424153916-738a4309/85/ContextualContinuous-Profilng-6-320.jpg)
![Datadog Continuous Profiler
[1] https://openjdk.org/jeps/349
[2] https://github.com/async-profiler/async-profiler
[3] https://www.brendangregg.com/FlameGraphs/cpuflamegraphs.html
- Agent, Backend, UI
- Backend and UI are proprietary, closed source
- Agent is open source
- https://github.com/dataDog/dd-trace-java
- Opportunistic Agent
- Use any available datasource
- Combines JFR and in-house profiling agent
- Subject to availability
- AsyncGetCallTrace can be crashy on older JVMs
- JFR is not available from all Java vendors
- J9, Zing
- Integrated Agent
- Distributed as a part of the tracer agent
- Integrates with the tracer
- ! Important for context !](https://image.slidesharecdn.com/contextualprofilng-230424153916-738a4309/85/ContextualContinuous-Profilng-7-320.jpg)


Ad
Recommended
Java Profiling Future
Java Profiling FutureJaroslav Bachorik
╠²
This document discusses future-proofing JVM profiling by improving the platform's profiling support. It describes different types of profiling like execution, memory, and latency profiling. It also covers sampling vs tracing profiling and challenges of profiling in cloud environments. The document advocates for improving JFR to provide a proper CPU profiler, profiling context support, and an API to request events from native code, which would allow custom sampling policies and integration with performance event tools.Java in flames
Java in flamesIsuru Perera
╠²
The document discusses Java profiling tools and techniques for visualizing application performance, emphasizing the use of flame graphs to identify code-path frequent usage. Key insights include comparisons between sampling and instrumentation, the importance of profiling in production environments, and methods for generating flame graphs from Java Flight Recordings. It also highlights challenges with using system profilers like 'perf' for Java applications and solutions for preserving frame pointers in the JVM.Java Flight Recorder Behind the Scenes
Java Flight Recorder Behind the ScenesStaffan Larsen
╠²
Java Flight Recorder is a tool built into the Java Virtual Machine that can trace and profile Java applications. It captures low-overhead data with minimal performance impact. The data can then be analyzed after the fact to troubleshoot issues or improve performance. Java Flight Recorder records events within the JVM and from the running application. It stores data in memory and can dump the information to disk for later analysis.Jvm profiling under the hood
Jvm profiling under the hoodRichardWarburton
╠²
The document discusses various aspects of Java Virtual Machine (JVM) profiling, including the importance of profiling, types of profiling (execution and CPU), and the biases associated with different profiling techniques. It covers the mechanics of sampling profilers, such as stack trace sampling and safepoint polling, and highlights limitations in accuracy and effectiveness. Additionally, it introduces tools for native profiling and emphasizes the need for careful evaluation of profiling instruments.Iurii Antykhovych "Java and performance tools and toys"
Iurii Antykhovych "Java and performance tools and toys"LogeekNightUkraine
╠²
This document discusses various tools and techniques for profiling Java applications to analyze performance, including:
- Using profilers like Async Profiler to visualize where time is spent in CPU, memory, and other metrics through flamegraphs and call trees.
- Collecting metrics from applications, systems, and services through agents, then viewing them in tools like Grafana to monitor for issues and set alerts.
- Profiling production, load tests, and benchmarks to understand real-world performance and correlate results.
- Combining profiles from distributed systems through techniques like collecting collapsed profiles then viewing them together.
- Other commercial and open source profiling options are also mentioned.Java Performance & Profiling
Java Performance & ProfilingIsuru Perera
╠²
Profiling is a technique used to analyze the performance and behavior of software applications. It involves measuring aspects like memory usage, CPU time, disk I/O, and counting function calls of a program during execution. This helps identify bottlenecks and optimize applications. There are various Java profiling tools available like Java VisualVM, Java Mission Control, and JProfiler that help analyze performance metrics and JIT compilation logs. Profiling is important for improving software performance by reducing latency and increasing throughput through optimizations informed by profiling results.Understanding Request Latency with Wallclock Profiling by Richard Startin
Understanding Request Latency with Wallclock Profiling by Richard StartinScyllaDB
╠²
The document discusses how to analyze request latency using continuous profiling, differentiating between CPU profiling and wallclock profiling to identify off-CPU execution bottlenecks. It emphasizes the importance of understanding various factors that can contribute to request delays, such as database queries and garbage collection. The presentation concludes that a combination of metrics, flame graphs, and timelines can help visualize and diagnose latency issues effectively.Diagnose Your Microservices
Diagnose Your MicroservicesMarcus Hirt
╠²
The document discusses microservices architecture, highlighting features such as decentralization and independence, and introduces OpenTracing as a vendor-neutral API for distributed tracing. It also covers JDK Flight Recorder for production time profiling and diagnostics, stating its integration into the Oracle Management Cloud for application performance management. The document concludes with details about Oracle's powerful APM capabilities and their support for OpenTracing and JFR.JDK Tools For Performance Diagnostics
JDK Tools For Performance DiagnosticsBaruch Sadogursky
╠²
The document discusses various Java Development Kit (JDK) tools for performance diagnostics, including VisualVM, JConsole, BTrace, JStat, JHat, and others. It provides an overview of their features, usage scenarios, and capabilities for diagnosing performance issues such as memory leaks, deadlocks, and monitoring applications. Additionally, it explains how to extend these tools and offers examples of use cases, particularly emphasizing the functionality of BTrace and JHat.How To Get The Most Out Of Your Hibernate, JBoss EAP 7 Application (St├źle Ped...
How To Get The Most Out Of Your Hibernate, JBoss EAP 7 Application (St├źle Ped...Red Hat Developers
╠²
The document outlines methodologies and tools for optimizing the performance of Hibernate applications on JBoss EAP 7, covering monitoring, profiling, tuning, and benchmarking techniques. It discusses various performance bottlenecks, JVM-level optimizations, and specific improvements in Hibernate 5, including memory usage reduction and enhanced caching. It also emphasizes the importance of measuring and analyzing performance metrics while addressing common pitfalls in benchmarking processes.Chronon - A Back-In-Time-Debugger for Java
Chronon - A Back-In-Time-Debugger for Javatsauerwein
╠²
This document provides an overview of Chronon, a commercial Eclipse plugin that allows debugging of Java programs by creating recordings of program executions. It can record variables, method calls, exceptions, console output, and threads during a program run. The recording is stored efficiently on disk. Chronon then allows debugging the recording by stepping through time or viewing variable histories. It is compared to an academic back-in-time debugger that modifies the VM. Performance tests on open source projects show overhead of around 2-3x for recording. Limitations include inability to inspect external libraries and lack of automated slicing. Advantages include helping narrow down defects by searching through space and time of a recording.Diagnosing HotSpot JVM Memory Leaks with JFR and JMC
Diagnosing HotSpot JVM Memory Leaks with JFR and JMCMushfekur Rahman
╠²
This document discusses diagnosing memory leaks in the HotSpot JVM using Java Flight Recorder (JFR) and Java Mission Control (JMC). It covers Java reference types, GC reachability, common causes of memory leaks like non-static inner classes and thread locals, and how to use JFR to record events and diagnose leaks by analyzing memory usage over time.Java Performance and Using Java Flight Recorder
Java Performance and Using Java Flight RecorderIsuru Perera
╠²
The document discusses Java performance measurement using metrics like latency and throughput, highlighting the importance of tuning Java applications for optimal performance. It covers Java garbage collection, memory management, and features like Java Flight Recorder (JFR) for profiling applications with minimal overhead. Additionally, it delves into JIT compilation, profiling techniques, and tools available for monitoring and enhancing Java application performance.Jdk Tools For Performance Diagnostics
Jdk Tools For Performance DiagnosticsDror Bereznitsky
╠²
The document discusses various Java Development Kit (JDK) tools for performance diagnostics including VisualVM, BTrace, jhat, and jmap. VisualVM is a visual tool that integrates command line JDK tools and can monitor memory, threads, take heap dumps, and profile CPU and memory. BTrace is a dynamic tracing tool that instruments Java programs at runtime. Jhat analyzes Java heap dumps and allows browsing object references. These tools help detect, analyze, and solve performance issues in Java applications.Using Flame Graphs
Using Flame GraphsIsuru Perera
╠²
Flame graphs are visualizations of profiled software that help identify the most frequent code paths. They can be generated from various sources, including Java flight recordings, and can display mixed-mode profiling data for both Java and system libraries. Additional tools and steps are provided for generating Java mixed-mode flame graphs and preserving frame pointers, allowing deeper insights into CPU usage.HPC Application Pro’¼üling & Analysis
HPC Application Pro’¼üling & AnalysisRishi Pathak
╠²
This document discusses application profiling and analysis techniques. It provides an overview of profiling, which records summary information during program execution to expose performance bottlenecks. Profiling can be done through sampling or instrumentation. It also discusses tracing, which records time-stamped events during execution. The document compares profiling and tracing and describes tools like PAPI and HPCToolkit that can be used for profiling applications.A new execution model for Nashorn in Java 9
A new execution model for Nashorn in Java 9Marcus Lagergren
╠²
The document presents an overview of Nashorn, a JavaScript engine for the Java Virtual Machine (JVM), focusing on its performance features and future enhancements. It discusses the execution architecture, the benefits of using optimized types, challenges related to performance during startup and warmup, and the potential for integrating other dynamic languages into the JVM. Additionally, it addresses various performance considerations and strategies to improve execution time, memory usage, and overhead associated with the Nashorn engine.Threads Needles Stacks Heaps - Java edition
Threads Needles Stacks Heaps - Java editionOvidiu Dimulescu
╠²
The thread dump identifies the application and JVM threads present in the JVM at the time of the dump. It provides information on each thread's state, stack trace and timing details. It also includes a summary of JVM heap utilization broken down by generation. This information can help identify potential blocking issues, performance bottlenecks or memory leaks in the application.HPC Application Profiling and Analysis
HPC Application Profiling and AnalysisRishi Pathak
╠²
This document discusses application profiling and analysis. Profiling involves recording summary information during program execution to reflect performance behavior. It can expose bottlenecks and hotspots with low overhead. Profiling is implemented via sampling, which uses periodic interrupts, or instrumentation, which directly inserts measurement code. Tracing records significant execution points to reconstruct program behavior. Profiling provides summary statistics while tracing generates a large volume of event data. Tools like HPCToolkit use sampling and instrumentation to collect metrics that are correlated back to source code to analyze performance.Web Sphere Problem Determination Ext
Web Sphere Problem Determination ExtRohit Kelapure
╠²
This document provides an overview and agenda for the "Busy Java Developer's Guide to WebSphere Debugging & Troubleshooting" presentation. The presentation covers various WebSphere Application Server components, troubleshooting tools like IBM Support Assistant, JVM troubleshooting tools, problem determination tools, common problem scenarios, how customers run into trouble, and includes a demo and Q&A section. It provides an in-depth look at debugging and resolving issues with WebSphere Application Server.Beirut Java User Group JVM presentation
Beirut Java User Group JVM presentationMahmoud Anouti
╠²
The document discusses key concepts related to the Java Virtual Machine (JVM) including:
1. How Java code is compiled to bytecode and executed by the JVM on different operating systems.
2. The class loading process and class verification that occurs when a class is loaded or referenced.
3. Details of the class file format including constant pool, fields, methods and attributes.
4. The Java bytecode instructions and how they operate on the operand stack and method area.
5. Just-in-time compilation techniques used by the JVM like inline caching, loop optimizations, and escape analysis.
6. Garbage collection algorithms and how they aim to optimize pause time, throughput andOracleCode 2017: Performance Diagnostic Techniques for Big Data Solutions Usi...
OracleCode 2017: Performance Diagnostic Techniques for Big Data Solutions Usi...Kuldeep Jiwani
╠²
The document discusses performance diagnostic techniques for big data solutions utilizing machine learning, focusing on big data architectures like Spark and Hadoop. It outlines various methods for performance measurement and diagnostics, including modifying source code and using tools like byte code instrumentation (BCI) and thread sampling. Additionally, it highlights the significance of throughput in big data and emphasizes understanding system performance through metrics and n-grams analysis to identify bottlenecks in application code.The Art of JVM Profiling
The Art of JVM ProfilingAndrei Pangin
╠²
The document discusses JVM profiling techniques, highlighting methods for measuring performance, including the use of async profilers and different profiling tools such as VisualVM and Java Mission Control. It presents various challenges in profiling, such as safepoints and native methodologies, while also offering solutions for improving profiling accuracy and effectiveness. Additionally, it emphasizes the need for comprehensive stack sampling to address performance problems and maximize efficiency in Java applications.Application Profiling for Memory and Performance
Application Profiling for Memory and Performancepradeepfn
╠²
This document discusses application profiling for memory and performance. It explains that as concurrency increases, throughput initially increases but contention can then reduce performance. The key resources that can cause contention are CPU, memory, disk I/O, and network I/O. Various tools like JProfiler and JConsole can measure and diagnose contention. Common issues uncovered by profiling include memory leaks, deadlocks, and permgen errors. Profiling is important to optimize applications for production use.Java Performance and Profiling
Java Performance and ProfilingWSO2
╠²
The document provides a comprehensive overview of Java performance and profiling techniques, emphasizing the importance of measuring latency and throughput to optimize application performance. It discusses key concepts such as garbage collection, Java heap structure, and various tools for monitoring and profiling Java applications, including Java VisualVM and Java Flight Recorder. Additionally, it highlights the use of Just-In-Time (JIT) compilation and profiling methodologies to enhance application efficiency.Jpf model checking
Jpf model checkingthought444
╠²
The document summarizes Java PathFinder (JPF), an explicit state model checker for Java bytecode. JPF avoids modeling effort by directly checking Java programs. It uses various techniques like partial order reduction and configurable search strategies to improve scalability for checking properties like deadlocks and exceptions. JPF has been open sourced and is actively developed and extended through its listener framework and Model Java Interface for interfacing native methods.TIP1 - Overview of C/C++ Debugging/Tracing/Profiling Tools
TIP1 - Overview of C/C++ Debugging/Tracing/Profiling ToolsXiaozhe Wang
╠²
This document provides an overview and comparison of various tools for debugging, profiling, and tracing C/C++ programs on Linux. It discusses concepts and implementations of debugging tools like gdb and Valgrind, profiling tools like gprof and perf, and tracing tools like strace, SystemTap, and LTTng. For each tool, it provides examples of common use cases and highlights strengths and limitations. The document aims to help developers select the appropriate tool based on their specific needs such as debugging memory errors, profiling performance bottlenecks, or tracing system calls.DBI-Assisted Android Application Reverse Engineering
DBI-Assisted Android Application Reverse EngineeringSahil Dhar
╠²
This document provides an overview of dynamic binary instrumentation (DBI) with a focus on the Frida framework for reverse engineering Android applications. It explains the installation process, command line tools, and various APIs available in Frida, along with example use cases such as root detection bypass and SQLCipher decryption. Additionally, it includes resources for further exploration of Frida frameworks and related references.A Constitutional Quagmire - Ethical Minefields of AI, Cyber, and Privacy.pdf
A Constitutional Quagmire - Ethical Minefields of AI, Cyber, and Privacy.pdfPriyanka Aash
╠²
A Constitutional Quagmire - Ethical Minefields of AI, Cyber, and PrivacySalesforce Summer '25 Release Frenchgathering.pptx.pdf
Salesforce Summer '25 Release Frenchgathering.pptx.pdfyosra Saidani
╠²
Salesforce Summer '25 Release Frenchgathering.pptx.pdfMore Related Content
Similar to ContextualContinuous Profilng (20)
JDK Tools For Performance Diagnostics
JDK Tools For Performance DiagnosticsBaruch Sadogursky
╠²
The document discusses various Java Development Kit (JDK) tools for performance diagnostics, including VisualVM, JConsole, BTrace, JStat, JHat, and others. It provides an overview of their features, usage scenarios, and capabilities for diagnosing performance issues such as memory leaks, deadlocks, and monitoring applications. Additionally, it explains how to extend these tools and offers examples of use cases, particularly emphasizing the functionality of BTrace and JHat.How To Get The Most Out Of Your Hibernate, JBoss EAP 7 Application (St├źle Ped...
How To Get The Most Out Of Your Hibernate, JBoss EAP 7 Application (St├źle Ped...Red Hat Developers
╠²
The document outlines methodologies and tools for optimizing the performance of Hibernate applications on JBoss EAP 7, covering monitoring, profiling, tuning, and benchmarking techniques. It discusses various performance bottlenecks, JVM-level optimizations, and specific improvements in Hibernate 5, including memory usage reduction and enhanced caching. It also emphasizes the importance of measuring and analyzing performance metrics while addressing common pitfalls in benchmarking processes.Chronon - A Back-In-Time-Debugger for Java
Chronon - A Back-In-Time-Debugger for Javatsauerwein
╠²
This document provides an overview of Chronon, a commercial Eclipse plugin that allows debugging of Java programs by creating recordings of program executions. It can record variables, method calls, exceptions, console output, and threads during a program run. The recording is stored efficiently on disk. Chronon then allows debugging the recording by stepping through time or viewing variable histories. It is compared to an academic back-in-time debugger that modifies the VM. Performance tests on open source projects show overhead of around 2-3x for recording. Limitations include inability to inspect external libraries and lack of automated slicing. Advantages include helping narrow down defects by searching through space and time of a recording.Diagnosing HotSpot JVM Memory Leaks with JFR and JMC
Diagnosing HotSpot JVM Memory Leaks with JFR and JMCMushfekur Rahman
╠²
This document discusses diagnosing memory leaks in the HotSpot JVM using Java Flight Recorder (JFR) and Java Mission Control (JMC). It covers Java reference types, GC reachability, common causes of memory leaks like non-static inner classes and thread locals, and how to use JFR to record events and diagnose leaks by analyzing memory usage over time.Java Performance and Using Java Flight Recorder
Java Performance and Using Java Flight RecorderIsuru Perera
╠²
The document discusses Java performance measurement using metrics like latency and throughput, highlighting the importance of tuning Java applications for optimal performance. It covers Java garbage collection, memory management, and features like Java Flight Recorder (JFR) for profiling applications with minimal overhead. Additionally, it delves into JIT compilation, profiling techniques, and tools available for monitoring and enhancing Java application performance.Jdk Tools For Performance Diagnostics
Jdk Tools For Performance DiagnosticsDror Bereznitsky
╠²
The document discusses various Java Development Kit (JDK) tools for performance diagnostics including VisualVM, BTrace, jhat, and jmap. VisualVM is a visual tool that integrates command line JDK tools and can monitor memory, threads, take heap dumps, and profile CPU and memory. BTrace is a dynamic tracing tool that instruments Java programs at runtime. Jhat analyzes Java heap dumps and allows browsing object references. These tools help detect, analyze, and solve performance issues in Java applications.Using Flame Graphs
Using Flame GraphsIsuru Perera
╠²
Flame graphs are visualizations of profiled software that help identify the most frequent code paths. They can be generated from various sources, including Java flight recordings, and can display mixed-mode profiling data for both Java and system libraries. Additional tools and steps are provided for generating Java mixed-mode flame graphs and preserving frame pointers, allowing deeper insights into CPU usage.HPC Application Pro’¼üling & Analysis
HPC Application Pro’¼üling & AnalysisRishi Pathak
╠²
This document discusses application profiling and analysis techniques. It provides an overview of profiling, which records summary information during program execution to expose performance bottlenecks. Profiling can be done through sampling or instrumentation. It also discusses tracing, which records time-stamped events during execution. The document compares profiling and tracing and describes tools like PAPI and HPCToolkit that can be used for profiling applications.A new execution model for Nashorn in Java 9
A new execution model for Nashorn in Java 9Marcus Lagergren
╠²
The document presents an overview of Nashorn, a JavaScript engine for the Java Virtual Machine (JVM), focusing on its performance features and future enhancements. It discusses the execution architecture, the benefits of using optimized types, challenges related to performance during startup and warmup, and the potential for integrating other dynamic languages into the JVM. Additionally, it addresses various performance considerations and strategies to improve execution time, memory usage, and overhead associated with the Nashorn engine.Threads Needles Stacks Heaps - Java edition
Threads Needles Stacks Heaps - Java editionOvidiu Dimulescu
╠²
The thread dump identifies the application and JVM threads present in the JVM at the time of the dump. It provides information on each thread's state, stack trace and timing details. It also includes a summary of JVM heap utilization broken down by generation. This information can help identify potential blocking issues, performance bottlenecks or memory leaks in the application.HPC Application Profiling and Analysis
HPC Application Profiling and AnalysisRishi Pathak
╠²
This document discusses application profiling and analysis. Profiling involves recording summary information during program execution to reflect performance behavior. It can expose bottlenecks and hotspots with low overhead. Profiling is implemented via sampling, which uses periodic interrupts, or instrumentation, which directly inserts measurement code. Tracing records significant execution points to reconstruct program behavior. Profiling provides summary statistics while tracing generates a large volume of event data. Tools like HPCToolkit use sampling and instrumentation to collect metrics that are correlated back to source code to analyze performance.Web Sphere Problem Determination Ext
Web Sphere Problem Determination ExtRohit Kelapure
╠²
This document provides an overview and agenda for the "Busy Java Developer's Guide to WebSphere Debugging & Troubleshooting" presentation. The presentation covers various WebSphere Application Server components, troubleshooting tools like IBM Support Assistant, JVM troubleshooting tools, problem determination tools, common problem scenarios, how customers run into trouble, and includes a demo and Q&A section. It provides an in-depth look at debugging and resolving issues with WebSphere Application Server.Beirut Java User Group JVM presentation
Beirut Java User Group JVM presentationMahmoud Anouti
╠²
The document discusses key concepts related to the Java Virtual Machine (JVM) including:
1. How Java code is compiled to bytecode and executed by the JVM on different operating systems.
2. The class loading process and class verification that occurs when a class is loaded or referenced.
3. Details of the class file format including constant pool, fields, methods and attributes.
4. The Java bytecode instructions and how they operate on the operand stack and method area.
5. Just-in-time compilation techniques used by the JVM like inline caching, loop optimizations, and escape analysis.
6. Garbage collection algorithms and how they aim to optimize pause time, throughput andOracleCode 2017: Performance Diagnostic Techniques for Big Data Solutions Usi...
OracleCode 2017: Performance Diagnostic Techniques for Big Data Solutions Usi...Kuldeep Jiwani
╠²
The document discusses performance diagnostic techniques for big data solutions utilizing machine learning, focusing on big data architectures like Spark and Hadoop. It outlines various methods for performance measurement and diagnostics, including modifying source code and using tools like byte code instrumentation (BCI) and thread sampling. Additionally, it highlights the significance of throughput in big data and emphasizes understanding system performance through metrics and n-grams analysis to identify bottlenecks in application code.The Art of JVM Profiling
The Art of JVM ProfilingAndrei Pangin
╠²
The document discusses JVM profiling techniques, highlighting methods for measuring performance, including the use of async profilers and different profiling tools such as VisualVM and Java Mission Control. It presents various challenges in profiling, such as safepoints and native methodologies, while also offering solutions for improving profiling accuracy and effectiveness. Additionally, it emphasizes the need for comprehensive stack sampling to address performance problems and maximize efficiency in Java applications.Application Profiling for Memory and Performance
Application Profiling for Memory and Performancepradeepfn
╠²
This document discusses application profiling for memory and performance. It explains that as concurrency increases, throughput initially increases but contention can then reduce performance. The key resources that can cause contention are CPU, memory, disk I/O, and network I/O. Various tools like JProfiler and JConsole can measure and diagnose contention. Common issues uncovered by profiling include memory leaks, deadlocks, and permgen errors. Profiling is important to optimize applications for production use.Java Performance and Profiling
Java Performance and ProfilingWSO2
╠²
The document provides a comprehensive overview of Java performance and profiling techniques, emphasizing the importance of measuring latency and throughput to optimize application performance. It discusses key concepts such as garbage collection, Java heap structure, and various tools for monitoring and profiling Java applications, including Java VisualVM and Java Flight Recorder. Additionally, it highlights the use of Just-In-Time (JIT) compilation and profiling methodologies to enhance application efficiency.Jpf model checking
Jpf model checkingthought444
╠²
The document summarizes Java PathFinder (JPF), an explicit state model checker for Java bytecode. JPF avoids modeling effort by directly checking Java programs. It uses various techniques like partial order reduction and configurable search strategies to improve scalability for checking properties like deadlocks and exceptions. JPF has been open sourced and is actively developed and extended through its listener framework and Model Java Interface for interfacing native methods.TIP1 - Overview of C/C++ Debugging/Tracing/Profiling Tools
TIP1 - Overview of C/C++ Debugging/Tracing/Profiling ToolsXiaozhe Wang
╠²
This document provides an overview and comparison of various tools for debugging, profiling, and tracing C/C++ programs on Linux. It discusses concepts and implementations of debugging tools like gdb and Valgrind, profiling tools like gprof and perf, and tracing tools like strace, SystemTap, and LTTng. For each tool, it provides examples of common use cases and highlights strengths and limitations. The document aims to help developers select the appropriate tool based on their specific needs such as debugging memory errors, profiling performance bottlenecks, or tracing system calls.DBI-Assisted Android Application Reverse Engineering
DBI-Assisted Android Application Reverse EngineeringSahil Dhar
╠²
This document provides an overview of dynamic binary instrumentation (DBI) with a focus on the Frida framework for reverse engineering Android applications. It explains the installation process, command line tools, and various APIs available in Frida, along with example use cases such as root detection bypass and SQLCipher decryption. Additionally, it includes resources for further exploration of Frida frameworks and related references.How To Get The Most Out Of Your Hibernate, JBoss EAP 7 Application (St├źle Ped...
How To Get The Most Out Of Your Hibernate, JBoss EAP 7 Application (St├źle Ped...Red Hat Developers
╠²
Recently uploaded (20)
A Constitutional Quagmire - Ethical Minefields of AI, Cyber, and Privacy.pdf
A Constitutional Quagmire - Ethical Minefields of AI, Cyber, and Privacy.pdfPriyanka Aash
╠²
A Constitutional Quagmire - Ethical Minefields of AI, Cyber, and PrivacySalesforce Summer '25 Release Frenchgathering.pptx.pdf
Salesforce Summer '25 Release Frenchgathering.pptx.pdfyosra Saidani
╠²
Salesforce Summer '25 Release Frenchgathering.pptx.pdf" How to survive with 1 billion vectors and not sell a kidney: our low-cost c...
" How to survive with 1 billion vectors and not sell a kidney: our low-cost c...Fwdays
╠²
Let's talk about our history. How we started the project with a small vector database of less than 2 million records. Later, we received a request for +100 million records, then another +100... And so gradually we reached almost 1 billion. Standard tools were quickly running out of steam - we were running into performance, index size, and very limited resources. After a long series of trials and errors, we built our own low-cost cluster, which today stably processes thousands of queries to more than 1B vectors.cnc-processing-centers-centateq-p-110-en.pdf
cnc-processing-centers-centateq-p-110-en.pdfAmirStern2
╠²
ū×ū©ūøū¢ ūóūÖūæūĢūōūÖūØ ū¬ūóū®ūÖūÖū¬ūÖ ūæūóū£ 3/4/5 ū”ūÖū©ūÖūØ, ūóūō 22 ūöūŚū£ūżūĢū¬ ūøū£ūÖūØ ūóūØ ūøū£ ūÉūżū®ū©ūĢūÖūĢū¬ ūöūóūÖūæūĢūō ūöūōū©ūĢū®ūĢū¬.╠²ūæūóū£ ū®ūśūŚ ūóūæūĢūōūö ūÆūōūĢū£ ūĢū×ūŚū®ūæ ūĀūĢūŚ ūĢū¦ū£ ū£ūöūżūóū£ūö ūæū®ūżūö ūöūóūæū©ūÖū¬/ū©ūĢūĪūÖū¬/ūÉūĀūÆū£ūÖū¬/ūĪūżū©ūōūÖū¬/ūóū©ūæūÖū¬ ūĢūóūĢūō..
ū×ūĪūĢūÆū£ ū£ūæū”ūó ūżūóūĢū£ūĢū¬ ūóūÖūæūĢūō ū®ūĢūĀūĢū¬ ūöū×ū¬ūÉūÖū×ūĢū¬ ū£ūóūĀūżūÖūØ ū®ūĢūĀūÖūØ: ū¦ūÖūōūĢūŚ ūÉūĀūøūÖ, ūÉūĢūżū¦ūÖ, ūĀūÖūĪūĢū©, ūĢūøū©ūĪūĢūØ ūÉūĀūøūÖ.Quantum AI Discoveries: Fractal Patterns Consciousness and Cyclical Universes
Quantum AI Discoveries: Fractal Patterns Consciousness and Cyclical UniversesSaikat Basu
╠²
Embark on a cosmic journey exploring the intersection of quantum
computing, consciousness, and ancient wisdom. Together we'll uncover the
recursive patterns that bind our reality.CapCut Pro Crack For PC Latest Version {Fully Unlocked} 2025
CapCut Pro Crack For PC Latest Version {Fully Unlocked} 2025pcprocore
╠²
¤æēØŚĪØŚ╝ØśüØŚ▓:ØŚ¢ØŚ╝ØŚĮØśå ØŚ╣ØŚČØŚ╗ØŚĖ & ØŚĮØŚ«ØśĆØśüØŚ▓ ØŚČØŚ╗ØśüØŚ╝ ØŚÜØŚ╝ØŚ╝ØŚ┤ØŚ╣ØŚ▓ ØŚ╗ØŚ▓Øśä ØśüØŚ«ØŚ»> https://pcprocore.com/ ¤æłŌŚĆ
CapCut Pro Crack is a powerful tool that has taken the digital world by storm, offering users a fully unlocked experience that unleashes their creativity. With its user-friendly interface and advanced features, itŌĆÖs no wonder why aspiring videographers are turning to this software for their projects.10 Key Challenges for AI within the EU Data Protection Framework.pdf
10 Key Challenges for AI within the EU Data Protection Framework.pdfPriyanka Aash
╠²
10 Key Challenges for AI within the EU Data Protection FrameworkOpenACC and Open Hackathons Monthly Highlights June 2025
OpenACC and Open Hackathons Monthly Highlights June 2025OpenACC
╠²
The OpenACC organization focuses on enhancing parallel computing skills and advancing interoperability in scientific applications through hackathons and training. The upcoming 2025 Open Accelerated Computing Summit (OACS) aims to explore the convergence of AI and HPC in scientific computing and foster knowledge sharing. This year's OACS welcomes talk submissions from a variety of topics, from Using Standard Language Parallelism to Computer Vision Applications. The document also highlights several open hackathons, a call to apply for NVIDIA Academic Grant Program and resources for optimizing scientific applications using OpenACC directives.Smarter Aviation Data Management: Lessons from Swedavia Airports and Sweco
Smarter Aviation Data Management: Lessons from Swedavia Airports and SwecoSafe Software
╠²
Managing airport and airspace data is no small task, especially when youŌĆÖre expected to deliver it in AIXM format without spending a fortune on specialized tools. But what if there was a smarter, more affordable way?
Join us for a behind-the-scenes look at how Sweco partnered with Swedavia, the Swedish airport operator, to solve this challenge using FME and Esri.
Learn how they built automated workflows to manage periodic updates, merge airspace data, and support data extracts ŌĆō all while meeting strict government reporting requirements to the Civil Aviation Administration of Sweden.
Even better? Swedavia built custom services and applications that use the FME Flow REST API to trigger jobs and retrieve results ŌĆō streamlining tasks like securing the quality of new surveyor data, creating permdelta and baseline representations in the AIS schema, and generating AIXM extracts from their AIS data.
To conclude, FME expert Dean Hintz will walk through a GeoBorders reading workflow and highlight recent enhancements to FMEŌĆÖs AIXM (Aeronautical Information Exchange Model) processing and interpretation capabilities.
Discover how airports like Swedavia are harnessing the power of FME to simplify aviation data management, and how you can too.EIS-Webinar-Engineering-Retail-Infrastructure-06-16-2025.pdf
EIS-Webinar-Engineering-Retail-Infrastructure-06-16-2025.pdfEarley Information Science
╠²
As AI reshapes expectations in retail and B2B commerce, organizations are recognizing a critical reality: meaningful AI outcomes depend on well-structured, adaptable infrastructure. In this session, Seth Earley is joined by Phil Ryan - AI strategist, search technologist, and founder of Glass Leopard Technologies - for a candid conversation on what it truly means to engineer systems for scale, agility, and intelligence.
Phil draws on more than two decades of experience leading search and AI initiatives for enterprise organizations. Together, he and Seth explore the challenges businesses face when legacy architectures limit personalization, agility, and real-time decisioning - and what needs to change to support agentic technologies and next-best-action capabilities.
Key themes from the webinar include:
Composability as a prerequisite for AI╠²- Why modular, loosely coupled systems are essential for adapting to rapid innovation and evolving business needs
Search and relevance as foundational to AI╠²- How techniques honed-in enterprise search have laid the groundwork for more responsive and intelligent customer experiences
From MDM and CDP to agentic systems╠²- How data platforms are evolving to support richer customer context and dynamic orchestration
Engineering for business alignment╠²- Why successful AI programs require architectural decisions grounded in measurable outcomes
The conversation is practical and forward-looking, connecting deep technical understanding with real-world business needs. Whether youŌĆÖre modernizing your commerce stack or exploring how AI can enhance product discovery, personalization, or customer journeys, this session provides a clear-eyed view of the capabilities, constraints, and priorities that matter most.2025_06_18 - OpenMetadata Community Meeting.pdf
2025_06_18 - OpenMetadata Community Meeting.pdfOpenMetadata
╠²
The community meetup was held Wednesday June 18, 2025 @ 9:00 AM PST.
Catch the next OpenMetadata Community Meetup @ https://www.meetup.com/openmetadata-meetup-group/
In this month's OpenMetadata Community Meetup, "Enforcing Quality & SLAs with OpenMetadata Data Contracts," we covered data contracts, why they matter, and how to implement them in OpenMetadata to increase the quality of your data assets!
Agenda Highlights:
¤æŗ Introducing Data Contracts: An agreement between data producers and consumers
¤ōØ Data Contracts key components: Understanding a contract and its purpose
¤¦æŌĆŹ¤Ä© Writing your first contract: How to create your own contracts in OpenMetadata
¤”Š An OpenMetadata MCP Server update!
Ō×Ģ And More!UserCon Belgium: Honey, VMware increased my bill
UserCon Belgium: Honey, VMware increased my billstijn40
╠²
VMwareŌĆÖs pricing changes have forced organizations to rethink their datacenter cost management strategies. While FinOps is commonly associated with cloud environments, the FinOps Foundation has recently expanded its framework to include ScopesŌĆöand Datacenter is now officially part of the equation. In this session, weŌĆÖll map the FinOps Framework to a VMware-based datacenter, focusing on cost visibility, optimization, and automation. YouŌĆÖll learn how to track costs more effectively, rightsize workloads, optimize licensing, and drive efficiencyŌĆöall without migrating to the cloud. WeŌĆÖll also explore how to align IT teams, finance, and leadership around cost-aware decision-making for on-prem environments. If your VMware bill keeps increasing and you need a new approach to cost management, this session is for you!Techniques for Automatic Device Identification and Network Assignment.pdf
Techniques for Automatic Device Identification and Network Assignment.pdfPriyanka Aash
╠²
Techniques for Automatic Device Identification and Network Assignment"Database isolation: how we deal with hundreds of direct connections to the d...
"Database isolation: how we deal with hundreds of direct connections to the d...Fwdays
╠²
What can go wrong if you allow each service to access the database directly? In a startup, this seems like a quick and easy solution, but as the system scales, problems appear that no one could have guessed.
In my talk, I'll share Solidgate's experience in transforming its architecture: from the chaos of direct connections to a service-based data access model. I will talk about the transition stages, bottlenecks, and how isolation affected infrastructure support. I will honestly show what worked and what didn't. In short, we will analyze the controversy of this talk.Quantum AI: Where Impossible Becomes Probable
Quantum AI: Where Impossible Becomes ProbableSaikat Basu
╠²
Imagine combining the "brains" of Artificial Intelligence (AI) with the "super muscles" of Quantum Computing. That's Quantum AI!
It's a new field that uses the mind-bending rules of quantum physics to make AI even more powerful.Curietech AI in action - Accelerate MuleSoft development
Curietech AI in action - Accelerate MuleSoft developmentshyamraj55
╠²
CurieTech AI in Action ŌĆō Accelerate MuleSoft Development
Overview:
This presentation demonstrates how CurieTech AIŌĆÖs purpose-built agents empower MuleSoft developers to create integration workflows faster, more accurately, and with less manual effort
linkedin.com
+12
curietech.ai
+12
meetups.mulesoft.com
+12
.
Key Highlights:
Dedicated AI agents for every stage: Coding, Testing (MUnit), Documentation, Code Review, and Migration
curietech.ai
+7
curietech.ai
+7
medium.com
+7
DataWeave automation: Generate mappings from tables or samplesŌĆö95%+ complete within minutes
linkedin.com
+7
curietech.ai
+7
medium.com
+7
Integration flow generation: Auto-create Mule flows based on specificationsŌĆöspeeds up boilerplate development
curietech.ai
+1
medium.com
+1
Efficient code reviews: Gain intelligent feedback on flows, patterns, and error handling
youtube.com
+8
curietech.ai
+8
curietech.ai
+8
Test & documentation automation: Auto-generate MUnit test cases, sample data, and detailed docs from code
curietech.ai
+5
curietech.ai
+5
medium.com
+5
Why Now?
Achieve 10├Ś productivity gains, slashing development time from hours to minutes
curietech.ai
+3
curietech.ai
+3
medium.com
+3
Maintain high accuracy with code quality matching or exceeding manual efforts
curietech.ai
+2
curietech.ai
+2
curietech.ai
+2
Ideal for developers, architects, and teams wanting to scale MuleSoft projects with AI efficiency
Conclusion:
CurieTech AI transforms MuleSoft development into an AI-accelerated workflowŌĆöletting you focus on innovation, not repetition."How to survive Black Friday: preparing e-commerce for a peak season", Yurii ...
"How to survive Black Friday: preparing e-commerce for a peak season", Yurii ...Fwdays
╠²
We will explore how e-commerce projects prepare for the busiest time of the year, which key aspects to focus on, and what to expect. WeŌĆÖll share our experience in setting up auto-scaling, load balancing, and discuss the loads that Silpo handles, as well as the solutions that help us navigate this season without failures.Raman Bhaumik - Passionate Tech Enthusiast
Raman Bhaumik - Passionate Tech EnthusiastRaman Bhaumik
╠²
A Junior Software Developer with a flair for innovation, Raman Bhaumik excels in delivering scalable web solutions. With three years of experience and a solid foundation in Java, Python, JavaScript, and SQL, she has streamlined task tracking by 20% and improved application stability.GenAI Opportunities and Challenges - Where 370 Enterprises Are Focusing Now.pdf
GenAI Opportunities and Challenges - Where 370 Enterprises Are Focusing Now.pdfPriyanka Aash
╠²
GenAI Opportunities and Challenges - Where 370 Enterprises Are Focusing NowAd
ContextualContinuous Profilng
- 1. Contextual Continuous Profiling Getting deeper insights into your application Jaroslav Bachorik Staff Software Engineer Datadog
- 2. 1. Introduction 2. Continuous profiling 3. Contextual continuous profiling 4. Takeaways 5. Q&A Agenda
- 3. Introduction - Active in JVM performance area since 2006 - NetBeans Profiler - VisualVM [1] - BTrace [2] - JMX, Serviceability - OpenJDK member and Reviewer - Currently at Datadog in charge of JVM profiling - In-house profiling agent - Heavily based on async-profiler [3] - Participating in OpenJDK - JFR fixes, backports - Proposing/implementing new features Disclaimer - Examples will be shown in Datadog UI - Yet, not a Datadog pitch! [1] https://visualvm.github.io [2] https://github.com/btraceio/btrace [3] https://github.com/async-profiler/async-profiler
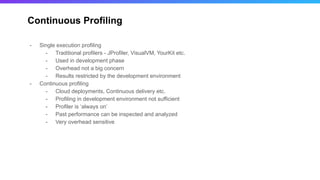
- 4. Continuous Profiling - Single execution profiling - Traditional profilers - JProfiler, VisualVM, YourKit etc. - Used in development phase - Overhead not a big concern - Results restricted by the development environment - Continuous profiling - Cloud deployments, Continuous delivery etc. - Profiling in development environment not sufficient - Profiler is ŌĆśalways onŌĆÖ - Past performance can be inspected and analyzed - Very overhead sensitive
- 5. JDK Flight Recorder - Available in JDK 9+ and JDK 8 after update 272 - Capture profiling data on demand - Jcmd - JMX - Streaming available since JDK 14 [1] [1] https://openjdk.org/jeps/349 [2] https://docs.oracle.com/en/java/javase/11/tools/java.html [3] https://docs.oracle.com/javacomponents/jmc-5-5/jfr-command-referenc e/diagnostic-command-reference.htm > jcmd myapp.jar JFR.dump name=rec1 filename=dump1.jfr ŌĆ” > jcmd myapp.jar JFR.dump name=rec1 filename=dump2.jfr Start JFR at JVM startup > java -XX:StartFlightRecording=name=rec1,filename=my_recording.jfr -jar myapp.jar More JFR options are described in Java Tools Reference [2] Capture profiling data via JCMD More JCMD related options are described in JCMD Tool Reference [3]
- 6. JVMTI Agent - AsyncGetCallTrace - ŌĆśUnofficialŌĆÖ API to get non-biased stacktraces - Not really maintained - Lurking bugs can crash your JVM - async-profiler [1] - Widely used fully functional profiler - Exports to multiple formats - CSV - Flamegraph [2] - JFR binary format [1] https://github.com/async-profiler/async-profiler [2] https://www.brendangregg.com/FlameGraphs/cpuflamegraphs.html
- 7. Datadog Continuous Profiler [1] https://openjdk.org/jeps/349 [2] https://github.com/async-profiler/async-profiler [3] https://www.brendangregg.com/FlameGraphs/cpuflamegraphs.html - Agent, Backend, UI - Backend and UI are proprietary, closed source - Agent is open source - https://github.com/dataDog/dd-trace-java - Opportunistic Agent - Use any available datasource - Combines JFR and in-house profiling agent - Subject to availability - AsyncGetCallTrace can be crashy on older JVMs - JFR is not available from all Java vendors - J9, Zing - Integrated Agent - Distributed as a part of the tracer agent - Integrates with the tracer - ! Important for context !
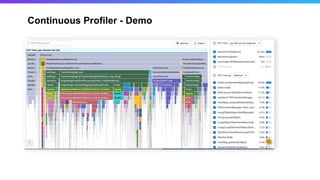
- 8. Continuous Profiler - Demo
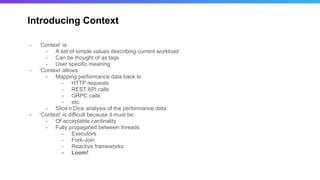
- 9. Introducing Context - ŌĆśContextŌĆÖ is: - A set of simple values describing current workload - Can be thought of as tags - User specific meaning - ŌĆśContextŌĆÖ allows: - Mapping performance data back to - HTTP requests - REST API calls - GRPC calls - etc. - SliceŌĆÖnŌĆÖDice analysis of the performance data - ŌĆśContextŌĆÖ is difficult because it must be: - Of acceptable cardinality - Fully propagated between threads - Executors - Fork-Join - Reactive frameworks - Loom!
- 10. Implementing Context - Labels in PPROF - Ready to use - Profile size implications - Go runtime has native support - Nothing in JVM - ŌĆśThread-coloringŌĆÖ approach was considered in JRockit - Never implemented - JFR is still not aware of context - Custom implementation is needed
- 11. Datadog Profiling Context - Context propagation - Implemented in Java tracer - Context associated with a unit of work - Independent of executing thread - Context persistence - Implemented in the profiler agent - Store context in JFR events - Easy and fast Java<->Native interop is mandatory - No JNI calls, please! - Shared memory buffer - Relying on Java and native side being tightly coupled - Semi-custom context - Capped at ten custom tags - Custom tag types/names - Must be defined before profiler is started - Stored in the JFR recording
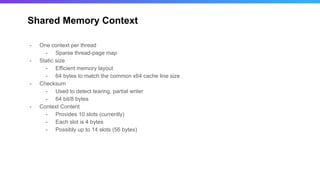
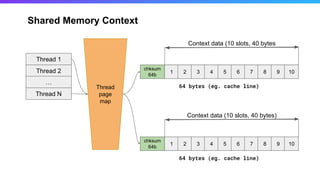
- 12. Shared Memory Context - One context per thread - Sparse thread-page map - Static size - Efficient memory layout - 64 bytes to match the common x64 cache line size - Checksum - Used to detect tearing, partial writer - 64 bit/8 bytes - Context Content - Provides 10 slots (currently) - Each slot is 4 bytes - Possibly up to 14 slots (56 bytes)
- 13. Shared Memory Context Thread 1 Thread 2 ŌĆ” Thread N 1 2 3 4 5 6 7 8 9 10 chksum 64b Context data (10 slots, 40 bytes 64 bytes (eg. cache line) 1 2 3 4 5 6 7 8 9 10 chksum 64b Context data (10 slots, 40 bytes) 64 bytes (eg. cache line) Thread page map
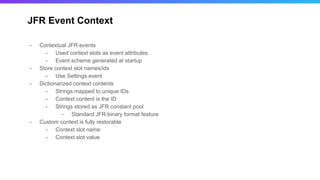
- 14. JFR Event Context - Contextual JFR events - Used context slots as event attributes - Event scheme generated at startup - Store context slot names/ids - Use Settings event - Dictionarized context contents - Strings mapped to unique IDs - Context content is the ID - Strings stored as JFR constant pool - Standard JFR binary format feature - Custom context is fully restorable - Context slot name - Context slot value
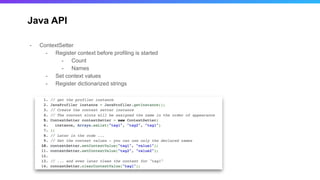
- 15. Java API - ContextSetter - Register context before profiling is started - Count - Names - Set context values - Register dictionarized strings
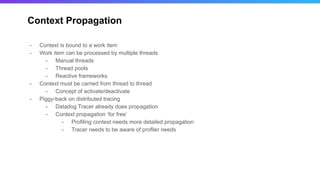
- 16. Context Propagation - Context is bound to a work item - Work item can be processed by multiple threads - Manual threads - Thread pools - Reactive frameworks - Context must be carried from thread to thread - Concept of activate/deactivate - Piggy-back on distributed tracing - Datadog Tracer already does propagation - Context propagation ŌĆśfor freeŌĆÖ - Profiling context needs more detailed propagation - Tracer needs to be aware of profiler needs
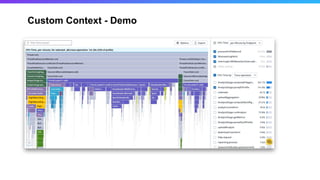
- 17. Custom Context - Demo
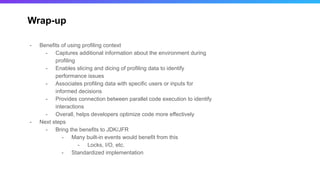
- 18. Wrap-up - Benefits of using profiling context - Captures additional information about the environment during profiling - Enables slicing and dicing of profiling data to identify performance issues - Associates profiling data with specific users or inputs for informed decisions - Provides connection between parallel code execution to identify interactions - Overall, helps developers optimize code more effectively - Next steps - Bring the benefits to JDK/JFR - Many built-in events would benefit from this - Locks, I/O, etc. - Standardized implementation
- 20. Thank you!
