1 of 5
Download to read offline


Recommended
Lkm transormasi fungsi rev (1)
Lkm transormasi fungsi rev (1)DavisKurnia
╠²
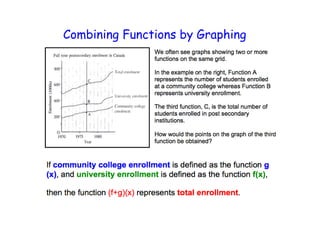
1. The document discusses types of transformations of graphs of functions, including translations, scale changes, and reflections. It uses the example of the path of a basketball shot into the air to illustrate these transformations.
2. The basketball shooting example provides data that is used to determine the parabolic function that models the ball's height over time. This function is then transformed through various translations, scale changes, and reflections using GeoGebra to analyze the effects on the graph.
3. Key effects of the transformations include changing the graph's position (translations), stretching or shrinking along the axes (scale changes), and flipping the graph across an axis (reflections when the scale factor is -1). The domain and range mayCore 3 Functions 1
Core 3 Functions 1davidmiles100
╠²
This document discusses identifying the domain and range of functions using function notation. It defines domain as the set of x-values and range as the set of y-values. Examples are given of functions, including f(x) = 2x - 10 and g(x) = 3/(x-2). Students are asked to find the domain, range, and values of A, B, and C using the information given about two functions f and g.Core 3 Functions 3
Core 3 Functions 3davidmiles100
╠²
The document defines functions f and g and asks to find an expression for their composition gf in terms of x and state its domain and range. It also asks to sketch the graph of y = gf(x), show any intersection points with the axes, and show that if gf(x) - 2f(x) = a has no real roots, then a < -10. It provides background on inverse functions, including that the inverse only exists if the original function is one-to-one, and that the graphs of a function and its inverse are reflections over y = x.H Alg2 091409
H Alg2 091409Mr. Smith
╠²
The document discusses functions and function notation. It begins by reviewing the slope-intercept form of a linear equation. It then defines different types of functions including polynomial, exponential, logarithmic, and trigonometric functions. It explains that a function relates an input to a unique output and can be represented by f(x) = mx + b or other notations like g(x) or h(x). The document demonstrates how to evaluate functions by plugging in values for x and concludes by assigning homework problems on functions.Ch 7 tutoring notes quadratics
Ch 7 tutoring notes quadraticssrobbins4
╠²
The document discusses transformations of quadratic functions in vertex form f(x) = a(x-h)2 + k. It explains how changing the coefficients a, h, and k affects the graph of the quadratic function. Specifically, it states that changing a widens or narrows the graph, changing h shifts the graph left or right, and changing k shifts the graph up or down. It also provides examples of writing equations for quadratic functions based on given graphs and finding the vertex of a quadratic function in standard form.Mahaviracharya (hindi)
Mahaviracharya (hindi)dgupta330
╠²
The document discusses different mathematical concepts including operations, formulas, shapes, and calculations. It covers topics such as permutations, combinations, fractions, areas, volumes, squares, ellipses, and cyclic quadrilaterals. Formulas are provided for combinations, areas, perimeters, and the sums of sides and diagonals of cyclic quadrilaterals. A variety of mathematical terms and concepts are defined.SMU BCA SEM 1 FALL 2016 ASSIGNMENTS
SMU BCA SEM 1 FALL 2016 ASSIGNMENTSsolved_assignments
╠²
This document is a summary of an assignment for a Digital Logic course in the Bachelor of Computer Application program during the Fall 2016 semester. It includes 4 questions worth a total of 30 marks. Question 1 is worth 5 marks and asks how to represent a binary value in decimal format. Question 2 has 2 parts worth a total of 10 marks, part a asks to draw a logic circuit diagram and part b asks to draw a truth table and Karnaugh map. Question 3 also has 2 parts worth 10 marks total, part a asks to draw a logic table and circuit diagram for a half adder and part b defines a digital comparator. Question 4 is worth 5 marks and asks to draw the truth table and explain the output changes for anņ£äņä▒ņØ┤ļ»Ėņ¦Ć Ļ░Øņ▓┤ Ļ▓ĆņČ£ ļīĆĒÜī - 2ļō▒
ņ£äņä▒ņØ┤ļ»Ėņ¦Ć Ļ░Øņ▓┤ Ļ▓ĆņČ£ ļīĆĒÜī - 2ļō▒DACON AI ļŹ░ņØ┤ņĮś
╠²
The document discusses object detection in aerial images using rotated bounding boxes (RBOX). It describes how traditional horizontal bounding boxes (HBOX) are limited for aerial images and introduces RBOX defined by center point, height, angle, and width. It also presents a new "Gliding Vertex" method to calculate RBOX that improves stability over using angle alone. The document outlines the dataset features, preprocessing methods including splitting large images and oversampling rare classes, and an ensemble Faster R-CNN model with RBOX and Feature Pyramid Network that achieved a mAP score of 0.750.Monday graphs for systems of equations
Monday graphs for systems of equationsDeborah Johnson
╠²
This document lists 15 graphs labeled from A to O, with each graph on its own line. It provides a simple alphabetical listing of graphs without any additional context or details about the graphs.Data Visualization With R: Learn To Modify Font Of Graphical Parameters
Data Visualization With R: Learn To Modify Font Of Graphical ParametersRsquared Academy
╠²
In this tutorial, we learn to modify the font type and size of different graphical parameters like title, axis labels and range.Data Visualization With R: Learn To Modify Color Of Plots
Data Visualization With R: Learn To Modify Color Of PlotsRsquared Academy
╠²
In this tutorial, we learn to modify the color of different graphical parameters of a plot like title, axis labels and range.Principles of programming languages(Functional programming Languages using LISP)
Principles of programming languages(Functional programming Languages using LISP)Preethi T G
╠²
This topic is about LISP Language in Functional Programming.IT was interesting topic. Here I was posted the topics were history of lisp language, Lisp features , example program, Advantages,disadvantages and applications of lisp language. Thank you. keep learning.Matlab bode diagram_instructions
Matlab bode diagram_instructionsKeihin de Mexico S.A. de C.V.
╠²
This document describes three methods for creating Bode plots of a transfer function in MATLAB:
1. Using the Control Toolbox with the tf and Bode functions
2. Creating arrays of the transfer function coefficients and using freqs to calculate the frequency response
3. Calculating the magnitude and phase directly from the transfer function and plotting the results7. 3x3 matrixaddmulttouchpad
7. 3x3 matrixaddmulttouchpadMedia4math
╠²
This document provides instructions for adding and multiplying 3x3 matrices using the TI-Nspire calculator. It outlines how to create a 3x3 matrix shell using the NEWMAT command, populate the matrices by inputting data, and then perform addition and multiplication operations on the matrices by using the matrix variables.8th TUC Meeting | Lijun Chang (University of New South Wales). Efficient Subg...
8th TUC Meeting | Lijun Chang (University of New South Wales). Efficient Subg...LDBC council
╠²
Lijun Chang, DECRA Fellow at the University of New South Wales talked about how to make subgraph matching more efficient thanks to postponing Cartesian products. Compound Structure Detection
Compound Structure DetectionHuseyin Gokhan Akcay
╠²
This document proposes a method for automatically detecting compound structures from multiple hierarchical image segmentations. Compound structures consist of spatial arrangements of primitive objects. The method models compound structures as probabilistic region processes and learns their characteristics. Candidate regions are extracted from hierarchical segmentations and the most coherent subsets are selected that constitute compound structure instances. The selection is formulated as optimizing a constrained region selection framework.R Data Visualization: Learn To Add Text Annotations To Plots
R Data Visualization: Learn To Add Text Annotations To PlotsRsquared Academy
╠²
In this tutorial, we learn to add text annotations to plots using the text() and mtext() functions from the Graphics package.2
2┘ģžŁ┘ģž» ž╣ž©ž» ž¦┘äž╣ž▓┘Ŗž▓
╠²
This MATLAB code calculates depreciation costs over time using 3 different methods: 1) the straight-line method plots accumulated depreciation and book value as straight lines, 2) the diminishing-balance method plots accumulated depreciation and book value as curves, and 3) the sinking fund method plots accumulated depreciation and book value where deposits are made each period at an interest rate.Compound Structure Detection
Compound Structure DetectionHuseyin Gokhan Akcay
╠²
This document proposes a method for automatically detecting compound structures from multiple hierarchical segmentations of remote sensing images. Compound structures contain spatial arrangements of primitive objects like buildings, trees, and roads. The method models compound structures as probabilistic region processes and learns their appearance and spatial models from training data. Candidate regions are extracted from hierarchical segmentations, and a constrained region selection framework is used to detect compound structure instances by selecting coherent subsets of regions that satisfy constraints. Approximate inference is performed using Markov chain Monte Carlo sampling or quadratic programming under constraints.R Data Visualization Tutorial: Bar Plots
R Data Visualization Tutorial: Bar PlotsRsquared Academy
╠²
In this tutorial, we learn to create univariate bar plots using the Graphics package in R. We also learn to modify graphical parameters associated with the bar plot.TensorFlow London 11: Gema Parreno 'Use Cases of TensorFlow'
TensorFlow London 11: Gema Parreno 'Use Cases of TensorFlow'Seldon
╠²
Use Cases of TensorFlow
Speaker: Gema Parreno, Data scientist at BBVA
Gema has more than 10 national and international projects for digital product design and had her own videogame startup. She has developed significant Tensorflow use cases and have been awarded by NASA Space Apps Challenge 2016 for a Neural Network Architecture for Asteroid Classification and Impact prediction.
Abstract:
The talk covers cases of use for TensorFlow, going from Convolutional Neural Nets for image classification, wide+deep learning for recommendation systems and NASA Space apps challenge project.
Thanks to all TensorFlow London meetup organisers and supporters:
Seldon.io
Altoros
Rewired
Google Developers
Rise LondonData Visualization With R: Introduction
Data Visualization With R: IntroductionRsquared Academy
╠²
In this tutorial, we explore the plot function from the Graphics package. We look at the different types of plots generated as the data is varied.AP Calculus ║▌║▌▀Żs December 13, 2007
AP Calculus ║▌║▌▀Żs December 13, 2007Darren Kuropatwa
╠²
The document discusses accumulation functions and provides an example of sketching the graph of the function f(t)=t and using that to complete the table of values for the accumulation function A(x). It also mentions that the accumulation function will have the same domain as the integrand function and describes the sign convention used when the accumulation function makes sense for values left of the lower bound.130701 04-01-2013
130701 04-01-2013Sampath Reddy
╠²
This document contains an exam for a Digital Logic Design course, with 5 multiple choice questions covering various topics in digital logic including number conversion, adders, decoders, Boolean logic, counters, and microprocessor architecture. The exam contains a total of 70 marks and tests the students' knowledge of key concepts in digital circuits and systems.peRm R group. Review of packages for r for market data downloading and analysis
peRm R group. Review of packages for r for market data downloading and analysisVyacheslav Arbuzov
╠²
This document summarizes R packages for downloading market data. It discusses packages such as quantmod, tseries, rdatamarket, and rBloomberg that can be used to access stock, economic, and financial time series data from various sources including Yahoo Finance, Google Finance, FRED, DataMarket, and Bloomberg. It provides examples of functions to download and visualize different types of market data using these packages.4 ce6a quantity surveying & valuation
4 ce6a quantity surveying & valuationVikas Yadav
╠²
This document appears to be an exam for a civil engineering course on quantity surveying and valuation. It contains 5 units with multiple choice questions in each unit. Unit 1 discusses the importance of quantity surveys and valuation techniques for construction projects. Unit 2 covers rate analysis and analyzing rates for items like brickwork. Unit 3 involves estimating quantities of materials for an RCC slab. Unit 4 discusses various cost estimation topics. Unit 5 covers the purpose of valuation, types of outgoings, and concepts like year's purchase and sinking fund. The document provides instructions to candidates and requests calculations and explanations be shown for full marks.Monad and Algebraic Design in Functional Programming
Monad and Algebraic Design in Functional ProgrammingNamuk Park
╠²
This document discusses functional programming concepts including SOLID design principles, strategy pattern, composition over inheritance, algebraic design, functors, monads, applicatives, and how monads can be used for railway oriented programming. It provides code examples for defining functors and monads in Scala as well as examples of type representations for monomorphism, epimorphism, and isomorphism.Math
Mathdxchicaizar
╠²
This document discusses the integral from a to b of the function f(x) dx, which represents the area under the curve of f(x) between the bounds a and b. The notation shown is the mathematical notation for a definite integral, evaluating the area between two bounds under the graph of a function.
Day 6 examples
Day 6 examplesjchartiersjsd
╠²
This document provides examples of graphing composite functions. It explains that to find the domain of a composite function f(g(x)), you must consider the restrictions on the domains of both the inner and outer functions. It then gives three examples of determining the composite functions f(g(x)) and g(f(x)) for various functions f and g, and calculating or graphing their domains and ranges. The final example asks to determine possible functions f and g that satisfy three given composite functions.More Related Content
What's hot (20)
Monday graphs for systems of equations
Monday graphs for systems of equationsDeborah Johnson
╠²
This document lists 15 graphs labeled from A to O, with each graph on its own line. It provides a simple alphabetical listing of graphs without any additional context or details about the graphs.Data Visualization With R: Learn To Modify Font Of Graphical Parameters
Data Visualization With R: Learn To Modify Font Of Graphical ParametersRsquared Academy
╠²
In this tutorial, we learn to modify the font type and size of different graphical parameters like title, axis labels and range.Data Visualization With R: Learn To Modify Color Of Plots
Data Visualization With R: Learn To Modify Color Of PlotsRsquared Academy
╠²
In this tutorial, we learn to modify the color of different graphical parameters of a plot like title, axis labels and range.Principles of programming languages(Functional programming Languages using LISP)
Principles of programming languages(Functional programming Languages using LISP)Preethi T G
╠²
This topic is about LISP Language in Functional Programming.IT was interesting topic. Here I was posted the topics were history of lisp language, Lisp features , example program, Advantages,disadvantages and applications of lisp language. Thank you. keep learning.Matlab bode diagram_instructions
Matlab bode diagram_instructionsKeihin de Mexico S.A. de C.V.
╠²
This document describes three methods for creating Bode plots of a transfer function in MATLAB:
1. Using the Control Toolbox with the tf and Bode functions
2. Creating arrays of the transfer function coefficients and using freqs to calculate the frequency response
3. Calculating the magnitude and phase directly from the transfer function and plotting the results7. 3x3 matrixaddmulttouchpad
7. 3x3 matrixaddmulttouchpadMedia4math
╠²
This document provides instructions for adding and multiplying 3x3 matrices using the TI-Nspire calculator. It outlines how to create a 3x3 matrix shell using the NEWMAT command, populate the matrices by inputting data, and then perform addition and multiplication operations on the matrices by using the matrix variables.8th TUC Meeting | Lijun Chang (University of New South Wales). Efficient Subg...
8th TUC Meeting | Lijun Chang (University of New South Wales). Efficient Subg...LDBC council
╠²
Lijun Chang, DECRA Fellow at the University of New South Wales talked about how to make subgraph matching more efficient thanks to postponing Cartesian products. Compound Structure Detection
Compound Structure DetectionHuseyin Gokhan Akcay
╠²
This document proposes a method for automatically detecting compound structures from multiple hierarchical image segmentations. Compound structures consist of spatial arrangements of primitive objects. The method models compound structures as probabilistic region processes and learns their characteristics. Candidate regions are extracted from hierarchical segmentations and the most coherent subsets are selected that constitute compound structure instances. The selection is formulated as optimizing a constrained region selection framework.R Data Visualization: Learn To Add Text Annotations To Plots
R Data Visualization: Learn To Add Text Annotations To PlotsRsquared Academy
╠²
In this tutorial, we learn to add text annotations to plots using the text() and mtext() functions from the Graphics package.2
2┘ģžŁ┘ģž» ž╣ž©ž» ž¦┘äž╣ž▓┘Ŗž▓
╠²
This MATLAB code calculates depreciation costs over time using 3 different methods: 1) the straight-line method plots accumulated depreciation and book value as straight lines, 2) the diminishing-balance method plots accumulated depreciation and book value as curves, and 3) the sinking fund method plots accumulated depreciation and book value where deposits are made each period at an interest rate.Compound Structure Detection
Compound Structure DetectionHuseyin Gokhan Akcay
╠²
This document proposes a method for automatically detecting compound structures from multiple hierarchical segmentations of remote sensing images. Compound structures contain spatial arrangements of primitive objects like buildings, trees, and roads. The method models compound structures as probabilistic region processes and learns their appearance and spatial models from training data. Candidate regions are extracted from hierarchical segmentations, and a constrained region selection framework is used to detect compound structure instances by selecting coherent subsets of regions that satisfy constraints. Approximate inference is performed using Markov chain Monte Carlo sampling or quadratic programming under constraints.R Data Visualization Tutorial: Bar Plots
R Data Visualization Tutorial: Bar PlotsRsquared Academy
╠²
In this tutorial, we learn to create univariate bar plots using the Graphics package in R. We also learn to modify graphical parameters associated with the bar plot.TensorFlow London 11: Gema Parreno 'Use Cases of TensorFlow'
TensorFlow London 11: Gema Parreno 'Use Cases of TensorFlow'Seldon
╠²
Use Cases of TensorFlow
Speaker: Gema Parreno, Data scientist at BBVA
Gema has more than 10 national and international projects for digital product design and had her own videogame startup. She has developed significant Tensorflow use cases and have been awarded by NASA Space Apps Challenge 2016 for a Neural Network Architecture for Asteroid Classification and Impact prediction.
Abstract:
The talk covers cases of use for TensorFlow, going from Convolutional Neural Nets for image classification, wide+deep learning for recommendation systems and NASA Space apps challenge project.
Thanks to all TensorFlow London meetup organisers and supporters:
Seldon.io
Altoros
Rewired
Google Developers
Rise LondonData Visualization With R: Introduction
Data Visualization With R: IntroductionRsquared Academy
╠²
In this tutorial, we explore the plot function from the Graphics package. We look at the different types of plots generated as the data is varied.AP Calculus ║▌║▌▀Żs December 13, 2007
AP Calculus ║▌║▌▀Żs December 13, 2007Darren Kuropatwa
╠²
The document discusses accumulation functions and provides an example of sketching the graph of the function f(t)=t and using that to complete the table of values for the accumulation function A(x). It also mentions that the accumulation function will have the same domain as the integrand function and describes the sign convention used when the accumulation function makes sense for values left of the lower bound.130701 04-01-2013
130701 04-01-2013Sampath Reddy
╠²
This document contains an exam for a Digital Logic Design course, with 5 multiple choice questions covering various topics in digital logic including number conversion, adders, decoders, Boolean logic, counters, and microprocessor architecture. The exam contains a total of 70 marks and tests the students' knowledge of key concepts in digital circuits and systems.peRm R group. Review of packages for r for market data downloading and analysis
peRm R group. Review of packages for r for market data downloading and analysisVyacheslav Arbuzov
╠²
This document summarizes R packages for downloading market data. It discusses packages such as quantmod, tseries, rdatamarket, and rBloomberg that can be used to access stock, economic, and financial time series data from various sources including Yahoo Finance, Google Finance, FRED, DataMarket, and Bloomberg. It provides examples of functions to download and visualize different types of market data using these packages.4 ce6a quantity surveying & valuation
4 ce6a quantity surveying & valuationVikas Yadav
╠²
This document appears to be an exam for a civil engineering course on quantity surveying and valuation. It contains 5 units with multiple choice questions in each unit. Unit 1 discusses the importance of quantity surveys and valuation techniques for construction projects. Unit 2 covers rate analysis and analyzing rates for items like brickwork. Unit 3 involves estimating quantities of materials for an RCC slab. Unit 4 discusses various cost estimation topics. Unit 5 covers the purpose of valuation, types of outgoings, and concepts like year's purchase and sinking fund. The document provides instructions to candidates and requests calculations and explanations be shown for full marks.Monad and Algebraic Design in Functional Programming
Monad and Algebraic Design in Functional ProgrammingNamuk Park
╠²
This document discusses functional programming concepts including SOLID design principles, strategy pattern, composition over inheritance, algebraic design, functors, monads, applicatives, and how monads can be used for railway oriented programming. It provides code examples for defining functors and monads in Scala as well as examples of type representations for monomorphism, epimorphism, and isomorphism.Math
Mathdxchicaizar
╠²
This document discusses the integral from a to b of the function f(x) dx, which represents the area under the curve of f(x) between the bounds a and b. The notation shown is the mathematical notation for a definite integral, evaluating the area between two bounds under the graph of a function.Viewers also liked (10)
Day 6 examples
Day 6 examplesjchartiersjsd
╠²
This document provides examples of graphing composite functions. It explains that to find the domain of a composite function f(g(x)), you must consider the restrictions on the domains of both the inner and outer functions. It then gives three examples of determining the composite functions f(g(x)) and g(f(x)) for various functions f and g, and calculating or graphing their domains and ranges. The final example asks to determine possible functions f and g that satisfy three given composite functions.
New day 1 examples
New day 1 examplesjchartiersjsd
╠²
A polynomial function contains terms of variables raised to whole number powers that are added or subtracted. Examples of polynomials are x^2 + 5x + 3 and 3x^4 - 2x^3 + x^2 - 4. Long division can be used to divide polynomials, with the process being similar to dividing numbers. The result of polynomial division is the quotient polynomial and a remainder.

Day 3 examples u2f14
Day 3 examples u2f14jchartiersjsd
╠²
The document discusses key concepts related to the unit circle and circular functions including: 1) the standard position of an angle places the initial side on the x-axis with the terminal side extending in the clockwise direction from the initial side, 2) reference angles which are the acute angles formed between the terminal side and the nearest x-axis, and 3) coterminal angles which are angles that share the same terminal side but can differ by full rotations of 360 degrees.
New day 10 examples
New day 10 examplesjchartiersjsd
╠²
This document discusses double angle identities in trigonometry. It provides examples of double angle identities for cosine and sine functions involving 2╬Ė. The document appears to be notes for an assignment on practicing double angle identities given on two separate dates.Day 2a examples
Day 2a examplesjchartiersjsd
╠²
To graph the combination of functions h(x) = (f + g)x, add the y-values of f(x) and g(x) at each x, and multiply the sum by x. The domain of h(x) is the intersection of the domains of f(x) and g(x), and the range is all real numbers since adding and multiplying real numbers results in real numbers.More from jchartiersjsd (20)


Day 8 examples u7w14
Day 8 examples u7w14jchartiersjsd
╠²
This document contains 5 problems involving finding terms in expansions of polynomials. The problems involve finding specific terms that contain a given power of x in expansions of polynomials such as (3x^4 - 1)^9, (-x^3 + 2)^6, (x + 1)^3x, (x + 1)^x, and determining the value of m if one term in the expansion of (2x - m)^7 is -262500x^2y^5.Day 7 examples u7w14
Day 7 examples u7w14jchartiersjsd
╠²
The document discusses binomial expansion, which is the process of multiplying out terms with two variables according to their power using the binomial theorem. It provides examples of expanding binomial expressions like (x + y)2, (x + y)3, and (x + y)4. It also notes that the sum of the exponents in each term equals the overall power, and the number of terms is always one more than the power. Finally, it provides the binomial theorem for expanding any binomial expression and finding a particular term.Day 4 examples u7w14
Day 4 examples u7w14jchartiersjsd
╠²
This document discusses how to calculate arrangements when some items must be together or apart. It explains that when items need to be together, they should be counted as a single item to reduce the total items being arranged. Then the total number of arrangements is calculated by finding the total possible arrangements and subtracting the arrangements that do not satisfy the constraints of certain items being together or apart. Examples provided include arranging people in a row when some must or cannot sit together and arranging books on a shelf keeping books of each subject together.Day 3 examples u7w14
Day 3 examples u7w14jchartiersjsd
╠²
Permutations refer to arrangements of objects in a definite order. Some key points:
- Permutations are represented by "nPn" where n is the total number of objects and r is the number being arranged.
- Permutations are used to calculate possibilities like license plates, phone numbers, and locker combinations.
- Restrictions like starting/ending conditions or requiring alternating arrangements reduce the number of possible permutations.
- Objects that are identical only count once toward the total number of permutations rather than being distinguishable.Day 2 examples u7w14
Day 2 examples u7w14jchartiersjsd
╠²
Factorial notation represents the product of all positive integers less than or equal to the given number. For example, 5! = 5 x 4 x 3 x 2 x 1 and 8! = 8 x 7 x 6 x 5 x 4 x 3 x 2 x 1. The document also provides examples of simplifying factorials without a calculator by using properties such as 5! + 4! = 6 x 4! and (k + 1)! + k! = (k + 2)k!.Day 1 examples u7w14
Day 1 examples u7w14jchartiersjsd
╠²
This document provides examples and explanations of the fundamental counting principle and addition counting principle to solve combinatorics problems. It gives 8 examples of using the fundamental counting principle to count the number of possible outcomes of independent events. These include counting the number of volleyball shoe combinations, outfits that can be created from different clothing items, ways to select committees from groups of people, and 3-digit numbers with no repeating digits. It also provides 5 examples of using the addition counting principle to count outcomes when events are dependent, such as selecting a president and vice president of opposite sexes from a group.
Day 7 examples u6w14
Day 7 examples u6w14jchartiersjsd
╠²
This document discusses graphing composite functions. It provides examples of determining the composite functions f(g(x)) and g(f(x)) for various functions f(x) and g(x), sketching the graphs of the composite functions, and stating their domains. It also gives examples of determining possible functions f(x) and g(x) that satisfy given composite functions.Day 5 examples u6w14
Day 5 examples u6w14jchartiersjsd
╠²
1. The document discusses composite functions, which involve combining two functions f(x) and g(x) where the output of one is used as the input of the other. It provides examples of evaluating composite functions using tables and graphs.
2. Key steps for evaluating composite functions are: 1) Substitute the inner function into the outer function and 2) Simplify the expression. Order matters as f(g(x)) and g(f(x)) may have different values.
3. Examples are worked through to find composite functions given basic functions like f(x) = x + 1 and g(x) = 2x as well as more complex rational functions.Day 4 examples u6w14
Day 4 examples u6w14jchartiersjsd
╠²
The graph is a linear function with a domain of all real numbers and a range of real numbers greater than or equal to 3. The graph is a line with a y-intercept of 3 that increases at a rate of 1 as x increases.Day 3 examples u6w14
Day 3 examples u6w14jchartiersjsd
╠²
Rational functions are functions of the form f(x) = p(x)/q(x) where p(x) and q(x) are polynomials. For example, comparing rational functions like 2x/(x^2 - 4) and (x-1)/(x+1). Horizontal asymptotes of rational functions occur when the degree of the polynomial in the numerator is less than the degree of the polynomial in the denominator.Day 1 examples u6w14
Day 1 examples u6w14jchartiersjsd
╠²
This document discusses how to find the sum, difference, product, and quotient of functions. The sum of functions is found by adding the y-coordinates of each function. The difference is found by subtracting the y-coordinates. The product is represented as h(x) = f(x)g(x) and the quotient is represented as h(x) = f(x)/g(x). Examples are provided for adding and subtracting functions.Mental math test outline
Mental math test outlinejchartiersjsd
╠²
The document outlines a mental math test covering polynomials. It includes short answer questions testing long division, synthetic division, the remainder theorem, and finding the degree, leading coefficient, and y-intercept of polynomials. The test also covers matching graphs to polynomial equations and word problems involving fully factoring polynomials and two graphs. Multiple choice questions will require explaining solutions, while long answer questions involve fully factoring polynomials and word problems.Day 8 examples u5w14
Day 8 examples u5w14jchartiersjsd
╠²
The document contains two polynomial word problems. The first asks to write a function V(x) to express the volume of a box with dimensions x, x+2, x+10 in terms of x, and find possible x values if the volume is 96 cm^3. The second problem describes a block of ice that is initially 3 ft by 4 ft by 5 ft, and asks to write a function to model reducing each dimension by the same amount to reach a volume of 24 ft^3, and determine how much to remove from each dimension.Day 7 examples u5w14
Day 7 examples u5w14jchartiersjsd
╠²
The document provides 3 polynomial word problems: 1) finding the equation for a polynomial given its graph f(x) = -(x - 2)2(x + 1), 2) determining the polynomial P(x) when divided by (x - 3) with a quotient of 2x^2 + x - 6 and remainder of 4, and 3) finding the value of a if (x - 2) is a factor of ax^3 + 4x^2 + x - 2. It also gives a 4th problem of determining the value of k when 2x^3 + kx^2 - 3x + 2 is divided by x - 2 with a remainder of 4.Day 5 examples u5w14
Day 5 examples u5w14jchartiersjsd
╠²
Polynomial functions are described by their degree and have certain characteristics. The graph of a polynomial is smooth and continuous without sharp corners. Odd degree polynomials rise on the left and fall on the right, while even degree polynomials rise on both sides. The number of x-intercepts and local maxima/minima are limited by the degree. Polynomials can be matched based on their degree, leading coefficient, even/odd nature, and number of x-intercepts and local extrema. The x-intercepts of a polynomial correspond to the roots of the equation, and a repeated root indicates a zero of higher multiplicity which affects the graph.Day 3 examples u5w14
Day 3 examples u5w14jchartiersjsd
╠²
This document asks which of the following binomials are factors of the expression 9x - 12. The options given are x + 3 and x - 2. Of these two options, x - 2 is a factor of 9x - 12, since (3x - 4)(3x - 4) = 9x^2 - 12x + 12 = 9x - 12.Day 2 examples u6w14
- 1. Combining Functions by Graphing
- 4. f(x)g(x)