Decon va
- 2. DECONVOLUTION ANALYSIS OF RENOGRAPHIC CURVES AND TRANSIT TIME ASSESSMENT Dr V Sivasubramaniyan Dept. of Nuclear Medicine SSSIHMS * Dr G Venkataraman Mr Hari Nanda Kumar SSSIHL *
- 3. AIMS ŌĆó REPORT INDIGENOUS SOFTWARE ŌĆó CREATED BY OUR OWN STUDENTS ŌĆó Renal Parenchymal Transit Time Analysis ŌĆó UTILITY & CLINICAL SIGNIFICANCE
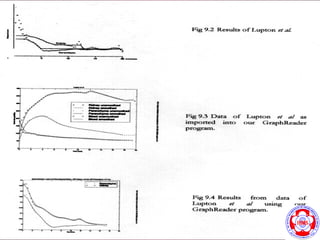
- 4. DECONVOLUTION ANALYSIS OF RENOGRAM. ŌĆóKenny et al ŌĆō BMJ 1975. ŌĆóDiffey et al ŌĆō JNM 1976. ŌĆóPiepsy et al ŌĆō BJR 1982. ŌĆóLupton et al ŌĆō NMC 1984 ŌĆóBritton et al ŌĆō BJU 1987.
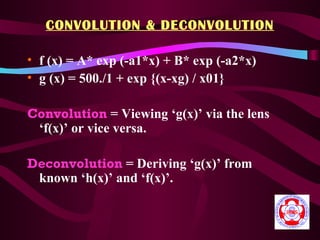
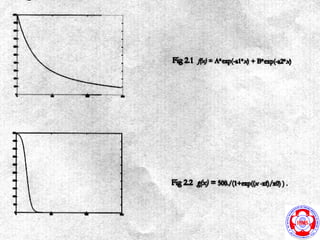
- 5. CONVOLUTION & DECONVOLUTION ŌĆó f (x) = A* exp (-a1*x) + B* exp (-a2*x) ŌĆó g (x) = 500./1 + exp {(x-xg) / x01} Convolution = Viewing ŌĆśg(x)ŌĆÖ via the lens ŌĆśf(x)ŌĆÖ or vice versa. Deconvolution = Deriving ŌĆśg(x)ŌĆÖ from known ŌĆśh(x)ŌĆÖ and ŌĆśf(x)ŌĆÖ.
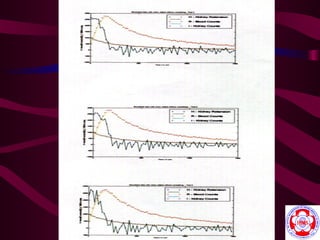
- 6. METHODOLOGY Platform : MATLAB Ver 5.0 ŌĆó Simulation studies. ŌĆó Deconvolution with discrete data sets. ŌĆó Randomness checking. ŌĆó Smoothing procedures. ŌĆó Check out analysis from literature.
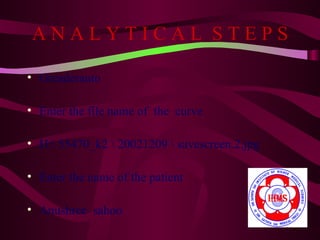
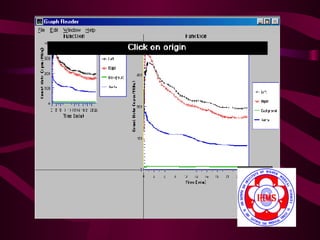
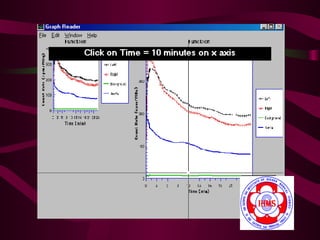
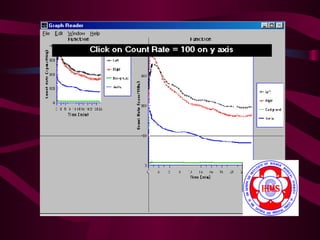
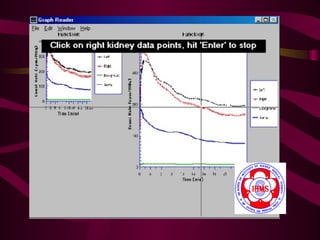
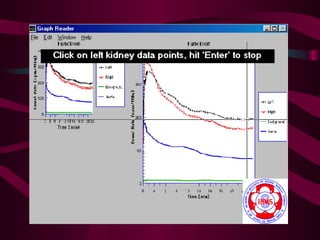
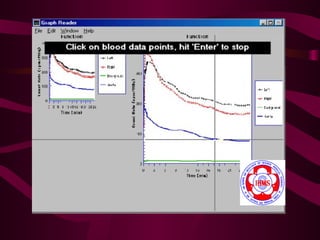
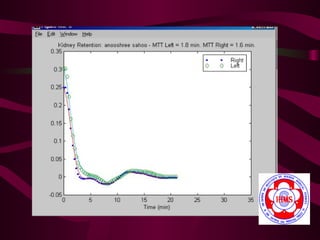
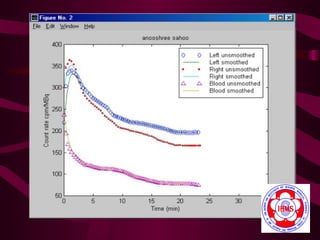
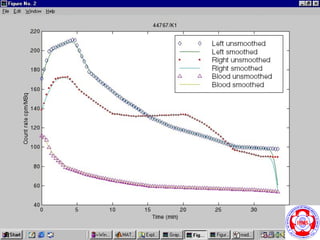
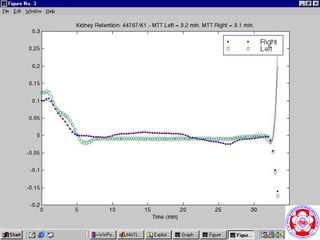
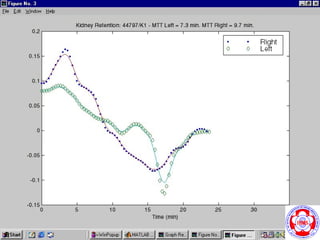
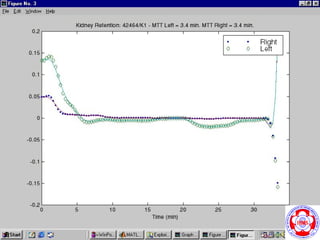
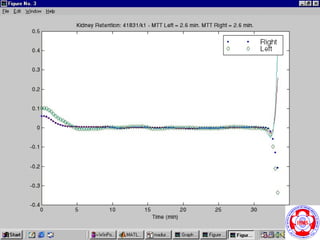
- 12. ANALYTICAL STEPS ŌĆó Greaderauto ŌĆó Enter the file name of the curve ŌĆó H: 55470_k2 20021209 savescreen.2.jpg ŌĆó Enter the name of the patient ŌĆó Anushree sahoo
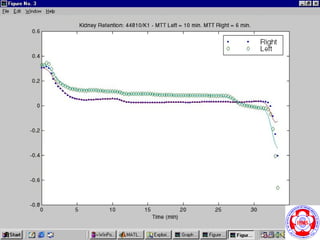
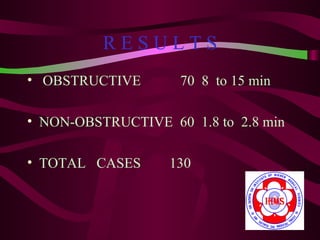
- 29. RESULTS ŌĆó OBSTRUCTIVE 70 8 to 15 min ŌĆó NON-OBSTRUCTIVE 60 1.8 to 2.8 min ŌĆó TOTAL CASES 130
- 30. MERITS ŌĆó INDIGENOUSLY MADE ŌĆó BASED ON NATIVE PATIENT DATA ŌĆó WORKS ON P. C PLATFORM ŌĆó EASY & EFFECTIVE
- 31. DEMERITS ŌĆó MULTIPLE STEPS INVOLVED ŌĆó OPERATOR DEPENDANT ŌĆó REPRODUCIBILITY DIFFICULT ŌĆó REQUIRES PATIENCE & TRAINING


