Errors in Measurement-Accuracy and Precison
Download as PPTX, PDF0 likes21 views
Errors in Measurement-Accuracy and Precison
1 of 14
Download to read offline


Recommended
Science enginering lab report experiment 1 (physical quantities aand measurem...
Science enginering lab report experiment 1 (physical quantities aand measurem...Q Hydar Q Hydar
╠²
This document discusses sources of error in measurement and the importance of accuracy. It explains that random errors can cause inconsistent readings and averaging repeated measurements can reduce these errors. Common sources of error include instrument errors, non-linear relationships in instruments, errors from reading scales incorrectly, environmental factors, and human errors. Taking the average of multiple readings eliminates random variations between readings and provides a more accurate result.Error analytical
Error analyticalLovnish Thakur
╠²
This document discusses experimental errors in scientific measurements. It defines experimental error as the difference between a measured value and the true value. Experimental errors can be classified as systematic errors or random errors. Systematic errors affect accuracy and can result from faulty instruments, while random errors affect precision and arise from unpredictable fluctuations. The document also discusses ways to quantify and describe experimental errors, including percent error, percent difference, mean, and significant figures. Understanding experimental errors is important for analyzing measurement uncertainties and improving experimental design.Principle of measurement
Principle of measurementSushama Nikam
╠²
1) The document discusses various concepts related to measurement principles including accuracy, precision, resolution, sensitivity and error.
2) It describes different types of errors like gross error, systematic error and random error. Systematic error includes instrumental, environmental and observational errors.
3) Accuracy refers to the closeness of a measurement to the true value. Precision refers to the consistency of repeated measurements. Accuracy and precision are related but distinct measures of measurement quality.Assignment on errors
Assignment on errorsIndian Institute of Technology Delhi
╠²
This document discusses various types of errors that can occur when making measurements with instruments. It defines error as the difference between the expected and measured values. There are two main types of errors - static errors, which occur due to limitations in the instrument, and dynamic errors, which occur when the instrument cannot keep up with rapid changes. Static errors include gross errors from human mistakes, systematic errors due to instrument defects, and random errors from small unpredictable factors. The document provides examples of different sources of systematic errors like instrumentation errors, environmental influences, and observational errors. It also discusses methods for estimating random errors and other error types like limiting, parallax, and quantization errors.Accuracy-and-precision.ppt
Accuracy-and-precision.pptwjahx8elooly
╠²
John's measurement is closer to the accepted value of 2.7 g/ml.
John's measurement: 2.649 g/ml
Difference from accepted value: 2.7 - 2.649 = 0.051 g/ml
Percentage accuracy = (Difference/Accepted value) x 100% = (0.051/2.7) x 100% = 1.89%
Sally's measurement: 2.731 g/ml
Difference from accepted value: 2.7 - 2.731 = -0.031 g/ml
Percentage accuracy = (Difference/Accepted value) x 100% = (-0.031/2.7) x 100% = 1.15%
ThereforePhysical measurement and error analysis 
Physical measurement and error analysis Parminder Singh Walia
╠²
This document discusses physical measurement and errors in measurement. It defines key terms like measurement, units, observations, and least count. It describes the International System of Units (SI) as the modern metric system. It also discusses different types of errors like absolute error and relative error. Systematic errors can be corrected while random errors are reduced by taking multiple measurements. Accuracy refers to systematic errors while precision describes random errors. The document outlines methods to calculate propagation of errors and statistical treatment of error values.Accuracy
Accuracynabeel neduvalli
╠²
This document discusses key concepts in analytical chemistry including accuracy, precision, mean, and standard deviation. It defines accuracy as closeness to the true value and notes that perfect accuracy is impossible due to errors. Precision refers to the agreement between repeated measurements and does not ensure accuracy if systematic errors are present. The mean is used to estimate the true value and standard deviation measures the dispersion of results. Good precision alone does not guarantee good accuracy as systematic errors can bias results while maintaining precision.The measurement of a physical quantity can never be made with perfect accurac...
The measurement of a physical quantity can never be made with perfect accurac...RuwanKalubowila1
╠²
The measurement of a physical quantity can never be made with perfect accuracy,
there will always be some error or uncertainty present
146056297 cc-modul
146056297 cc-modulhomeworkping3
╠²
homework help,online homework help,online tutors,online tutoring,research paper help,do my homework,
https://www.homeworkping.com/Lecture note 2
Lecture note 2sreenu t
╠²
This document provides an overview of standards of measurement and discusses key concepts:
- Standards are classified as primary or secondary, with primary standards defining fundamental units and secondary standards calibrated against primary standards.
- Standard units discussed include the meter (length), kilogram (mass), second (time), Kelvin (temperature), candela (light intensity), mole (amount of substance), and ampere (electric current).
- Random and systematic errors are defined, with random errors averaging out over repeated measurements but systematic errors requiring correction. Significant figures and calculating relative/absolute errors are also covered.
Errors and uncertainties
Errors and uncertaintiesbornalive
╠²
This is a lecture note on Error and its propagation. This slide can be very much useful for As level physics students. It is totally different from the presentation. I would like to name it as slides of lecture notes on Error(uncertainty), difference on precision and accuracy, difference on two types of error (systematic and random errors). Believe me it will help you to enhance your knowledge on Uncertainty and its propagarion.Errors and Error Measurements
Errors and Error MeasurementsMilind Pelagade
╠²
Thorough study of Experimental Errors occurred during experimentation using different experimental techniques.
A clear picture about techniques for error measurement is given in the presentation.
EMI-Unit-1 Material.docx
EMI-Unit-1 Material.docxraviteja srinivasula
╠²
This document provides an introduction to instrumentation and measurement. It discusses:
1. The importance of measurement in science, engineering, and daily life. Measurement allows the study of natural phenomena and supports technological advancement.
2. Key concepts in instrumentation including transducers that convert physical quantities to electrical signals, and functional elements like sensing, signal conversion/manipulation, transmission, and display.
3. Performance characteristics of instruments including static characteristics like accuracy, precision, resolution, sensitivity, and errors, and dynamic characteristics related to rapidly changing measurements. Calibration is also discussed.
4. Sources of errors in measurement including gross errors from human mistakes, systematic errors from instruments, environments, and observations, and random errors
Errors in measurement
Errors in measurementRavinder Jarewal
╠²
The document discusses different types of errors that can occur in measurement. It describes gross errors, systematic errors like instrumental errors and environmental errors, and random errors. It also defines key terms used to analyze errors like limit of reading, greatest possible error, and discusses analyzing measurement data using statistical methods like the mean, standard deviation, variance and histograms. Measurement errors can occur due to issues like parallax, calibration, limits of the measuring device, and are analyzed statistically.Introduction to physics
Introduction to physicsCk Sal
╠²
Scalar quantities have magnitude only, such as length, time, temperature. Vector quantities have both magnitude and direction, such as displacement, velocity, force.
There are two main types of errors in measurement - systematic errors and random errors. Systematic errors consistently shift measurements in one direction, such as zero errors or calibration errors. Random errors vary unpredictably between measurements, caused by factors like human error or environmental changes. Precision refers to the consistency of measurements while accuracy refers to how close measurements are to the true value.Nursing Research Measurement errors.pptx
Nursing Research Measurement errors.pptxChinna Chadayan
╠²
This document discusses different types of errors that can occur in measurement. There are five main types of errors:
1) Gross errors are faults made by the person using the instrument, such as incorrect readings or recordings.
2) Systematic errors are due to problems with the instrument itself, environmental factors, or observational errors made by the observer.
3) Random errors remain after gross and systematic errors have been reduced and are due to unknown causes. Taking multiple readings and analyzing them statistically can help minimize random errors.
4) Absolute error is the difference between the expected and measured values.
5) Relative error expresses the error as a percentage of the real measurement.Nursing Research Measurement errors.pptx
Nursing Research Measurement errors.pptxChinna Chadayan
╠²
This document discusses different types of errors that can occur in measurement. There are five main types of errors:
1) Gross errors are faults made by the person using the instrument, such as incorrect readings or recordings.
2) Systematic errors are due to problems with the instrument itself, environmental factors, or observational errors made by the observer.
3) Random errors remain after gross and systematic errors have been reduced and are due to unknown causes. Taking multiple readings and analyzing them statistically can help minimize random errors.
4) Absolute error is the difference between the expected and measured values.
5) Relative error expresses the error as a percentage of the real measurement.
errors of measurement and systematic errors
errors of measurement and systematic errorsDr. Hament Sharma
╠²
This document discusses measurement errors and uncertainty. It defines measurement as assigning a number and unit to a property using an instrument. Error is the difference between the measured value and true value. There are two main types of error: random error, which varies unpredictably, and systematic error, which remains constant or varies predictably. Sources of error include the measuring instrument and technique used. Uncertainty is the doubt about a measurement and is quantified with an interval and confidence level, such as 20 cm ┬▒1 cm at 95% confidence. Uncertainty is important for tasks like calibration where it must be reported.1.4 measurement
1.4 measurementKonilia Sual
╠²
1. Errors in measurement can be either systematic or random. Systematic errors consistently shift measurements in one direction, while random errors vary unpredictably between measurements.
2. Systematic errors can be reduced by careful experimentation and using multiple instruments, while random errors are reduced through repeat readings and calculating averages.
3. Precision refers to the consistency of measurements while accuracy refers to how close measurements are to the true value. Both can be improved by eliminating errors and using more sensitive instruments.Numerical approximation and solution of equations
Numerical approximation and solution of equationsRobinson
╠²
1. Numerical approximation involves finding approximate values that are close to the actual values of quantities. There are different types of errors that can occur due to approximation, such as truncation error and rounding error.
2. Accuracy refers to how close an approximate value is to the actual value, while precision describes how close repeated approximations are to each other. Greater accuracy means a lower absolute error, while greater precision means a lower standard deviation between repeated measurements.
3. For a numerical method, convergence means that repeated approximations get closer to the actual value with each iteration. Stability refers to the likelihood that a method will converge rather than diverge for a wide range of problems.Process dynamic control
Process dynamic controlSharvendra DK Omre
╠²
This document discusses types of errors, accuracy, sensitivity, resolution, and linearity in measurements. It defines random error, systematic error including environmental, instrumental and observational errors. Gross errors are discussed. Accuracy is defined as closeness to a true value. Sensitivity is a measure of output change for input change. Resolution is the ability to detect small changes. Linearity refers to how measurement bias is affected by the measurement range. First order response reaches steady state for a step input. Second order response can oscillate to a step input due to overshoot and damping effects.Errors in pharmaceutical analysis 
Errors in pharmaceutical analysis Bindu Kshtriya
╠²
Errors in pharmaceutical analysis can be determinate (systematic) or indeterminate (random). Determinate errors are caused by faults in procedures or instruments and cause results to consistently be too high or low. Sources include improperly calibrated equipment, impure reagents, and analyst errors. Indeterminate errors are random and unavoidable, arising from limitations of instruments. Accuracy refers to closeness to the true value, while precision refers to reproducibility. Systematic errors can be minimized by calibrating equipment, analyzing standards, using independent methods, and blank determinations.The uncertainty of measurements
The uncertainty of measurementserwin marlon sario
╠²
This document discusses various sources of uncertainty in physics measurements, including incomplete definitions, unaccounted factors, environmental influences, instrument limitations, calibration errors, physical variations, drifts, response times, and parallax. It emphasizes that all measurements have some degree of uncertainty from multiple sources. Properly reporting uncertainty allows evaluation of experimental quality and comparison to other results. While the true value may not be known exactly, uncertainty analysis helps ascertain a measurement's accuracy and precision.Accuracy precision - resolution
Accuracy precision - resolutionMai An
╠²
1. Accuracy refers to how close a measurement is to the actual value, while precision describes the consistency of repeated measurements.
2. Measurement uncertainty comes from systematic errors in instruments and random errors from noise. Total uncertainty is calculated by combining the uncertainties.
3. Improving precision involves averaging measurements to reduce noise, but this may reduce bandwidth. Resolution is the smallest distinguishable difference in values.Beyond Point Masses. IV. Trans-Neptunian Object Altjira Is Likely a Hierarchi...
Beyond Point Masses. IV. Trans-Neptunian Object Altjira Is Likely a Hierarchi...S├®rgio Sacani
╠²
Dynamically studying trans-Neptunian object (TNO) binaries allows us to measure masses and orbits. Most of the known objects appear to have only two components, except (47171) Lempo, which is the single known hierarchical triple system with three similar-mass components. Though hundreds of TNOs have been imaged with high-resolution telescopes, no other hierarchical triples (or trinaries) have been found among solar system small bodies, even though they are predicted in planetesimal formation models such as gravitational collapse after the streaming instability. By going beyond the point-mass assumption and modeling TNO orbits as non-Keplerian, we open a new window into the shapes and spins of the components, including the possible presence of unresolved ŌĆ£innerŌĆØ binaries. Here we present evidence for a new hierarchical triple, (148780) Altjira (2001 UQ18), based on non-Keplerian dynamical modeling of the two observed components. We incorporate two recent Hubble Space Telescope observations, leading to a 17 yr observational baseline. We present a new open-source Bayesian pointspread function fitting code called nPSF that provides precise relative astrometry and uncertainties for single images. Our non-Keplerian analysis measures a statistically significant (Ōł╝2.5Žā) nonspherical shape for Altjira. The measured J2 is best explained as an unresolved inner binary, and an example hierarchical triple model gives the best fit to the observed astrometry. Using an updated non-Keplerian ephemeris (which is significantly different from the Keplerian predictions), we show that the predicted mutual event season for Altjira has already begun, with several excellent opportunities for observations through Ōł╝2030.ARepeatingFastRadioBurstSourceinaLow-luminosityDwarfGalaxy
ARepeatingFastRadioBurstSourceinaLow-luminosityDwarfGalaxyS├®rgio Sacani
╠²
Wepresent the localizationandhostgalaxyofFRB20190208A, arepeatingsourceof fast radiobursts (FRBs) discoveredusingCHIME/FRB.Aspartof thePinpointingREpeatingChImeSourceswithEVNdishesrepeater localizationprogramon theEuropeanVLBINetwork (EVN),wemonitoredFRB20190208Afor 65.6hr at Ōł╝1.4GHzanddetectedasingleburst,whichledtoitsverylongbaselineinterferometrylocalizationwith260mas uncertainty(2Žā).Follow-upopticalobservationswiththeMMTObservatory(i’éē25.7mag(AB))foundnovisible hostattheFRBposition.SubsequentdeeperobservationswiththeGranTelescopioCanarias,however,revealedan extremelyfaintgalaxy(r=27.32┬▒0.16mag),verylikely(99.95%)associatedwithFRB20190208A.Giventhe dispersionmeasureoftheFRB(Ōł╝580pccmŌłÆ3),eventhemostconservativeredshiftestimate( ~ z 0.83 max )implies TheAstrophysicalJournalLetters,977:L4(17pp),2024December10 https://doi.org/10.3847/2041-8213/ad8ce1 ┬®2024.TheAuthor(s).PublishedbytheAmericanAstronomicalSociety. 30BantingFellow. 31McGillSpaceInstituteFellow. 32 FRQNTPostdoctoralFellow. Originalcontent fromthisworkmaybeusedunder theterms of theCreativeCommonsAttribution4.0licence.Anyfurther distributionofthisworkmustmaintainattributiontotheauthor(s)andthetitle of thework, journalcitationandDOI. 1The Astrophysical Journal Letters, 977:L4 (17pp), 2024 December 10 Hewitt et al. that this is the lowest-luminosity FRB host to date (’éł108 Le), even less luminous than the dwarf host of FRB20121102A. We investigate how localization precision and the depth of optical imaging affect host association and discuss the implications of such a low-luminosity dwarf galaxy. Unlike the other repeaters with low-luminosity hosts, FRB 20190208A has a modest Faraday rotation measure of a few tens of rad mŌłÆ2, and EVN plus Very Large Array observations reveal no associated compact persistent radio source. We also monitored FRB20190208A for 40.4hr over 2yr as part of the Extragalactic Coherent Light from Astrophysical Transients repeating FRB monitoring campaign on the Nan├¦ay Radio Telescope and detected one burst. Our results demonstrate that, in some cases, the robust association of an FRB with a host galaxy will require both high localization precision and deep optical follow-up. Unified Astronomy Thesaurus concepts: Radio bursts (1339); Radio transient sources (2008); Very long baseline interferometry (1769); Dwarf galaxies (416)More Related Content
Similar to Errors in Measurement-Accuracy and Precison (20)
146056297 cc-modul
146056297 cc-modulhomeworkping3
╠²
homework help,online homework help,online tutors,online tutoring,research paper help,do my homework,
https://www.homeworkping.com/Lecture note 2
Lecture note 2sreenu t
╠²
This document provides an overview of standards of measurement and discusses key concepts:
- Standards are classified as primary or secondary, with primary standards defining fundamental units and secondary standards calibrated against primary standards.
- Standard units discussed include the meter (length), kilogram (mass), second (time), Kelvin (temperature), candela (light intensity), mole (amount of substance), and ampere (electric current).
- Random and systematic errors are defined, with random errors averaging out over repeated measurements but systematic errors requiring correction. Significant figures and calculating relative/absolute errors are also covered.Errors and uncertainties
Errors and uncertaintiesbornalive
╠²
This is a lecture note on Error and its propagation. This slide can be very much useful for As level physics students. It is totally different from the presentation. I would like to name it as slides of lecture notes on Error(uncertainty), difference on precision and accuracy, difference on two types of error (systematic and random errors). Believe me it will help you to enhance your knowledge on Uncertainty and its propagarion.Errors and Error Measurements
Errors and Error MeasurementsMilind Pelagade
╠²
Thorough study of Experimental Errors occurred during experimentation using different experimental techniques.
A clear picture about techniques for error measurement is given in the presentation.EMI-Unit-1 Material.docx
EMI-Unit-1 Material.docxraviteja srinivasula
╠²
This document provides an introduction to instrumentation and measurement. It discusses:
1. The importance of measurement in science, engineering, and daily life. Measurement allows the study of natural phenomena and supports technological advancement.
2. Key concepts in instrumentation including transducers that convert physical quantities to electrical signals, and functional elements like sensing, signal conversion/manipulation, transmission, and display.
3. Performance characteristics of instruments including static characteristics like accuracy, precision, resolution, sensitivity, and errors, and dynamic characteristics related to rapidly changing measurements. Calibration is also discussed.
4. Sources of errors in measurement including gross errors from human mistakes, systematic errors from instruments, environments, and observations, and random errorsErrors in measurement
Errors in measurementRavinder Jarewal
╠²
The document discusses different types of errors that can occur in measurement. It describes gross errors, systematic errors like instrumental errors and environmental errors, and random errors. It also defines key terms used to analyze errors like limit of reading, greatest possible error, and discusses analyzing measurement data using statistical methods like the mean, standard deviation, variance and histograms. Measurement errors can occur due to issues like parallax, calibration, limits of the measuring device, and are analyzed statistically.Introduction to physics
Introduction to physicsCk Sal
╠²
Scalar quantities have magnitude only, such as length, time, temperature. Vector quantities have both magnitude and direction, such as displacement, velocity, force.
There are two main types of errors in measurement - systematic errors and random errors. Systematic errors consistently shift measurements in one direction, such as zero errors or calibration errors. Random errors vary unpredictably between measurements, caused by factors like human error or environmental changes. Precision refers to the consistency of measurements while accuracy refers to how close measurements are to the true value.Nursing Research Measurement errors.pptx
Nursing Research Measurement errors.pptxChinna Chadayan
╠²
This document discusses different types of errors that can occur in measurement. There are five main types of errors:
1) Gross errors are faults made by the person using the instrument, such as incorrect readings or recordings.
2) Systematic errors are due to problems with the instrument itself, environmental factors, or observational errors made by the observer.
3) Random errors remain after gross and systematic errors have been reduced and are due to unknown causes. Taking multiple readings and analyzing them statistically can help minimize random errors.
4) Absolute error is the difference between the expected and measured values.
5) Relative error expresses the error as a percentage of the real measurement.Nursing Research Measurement errors.pptx
Nursing Research Measurement errors.pptxChinna Chadayan
╠²
This document discusses different types of errors that can occur in measurement. There are five main types of errors:
1) Gross errors are faults made by the person using the instrument, such as incorrect readings or recordings.
2) Systematic errors are due to problems with the instrument itself, environmental factors, or observational errors made by the observer.
3) Random errors remain after gross and systematic errors have been reduced and are due to unknown causes. Taking multiple readings and analyzing them statistically can help minimize random errors.
4) Absolute error is the difference between the expected and measured values.
5) Relative error expresses the error as a percentage of the real measurement.errors of measurement and systematic errors
errors of measurement and systematic errorsDr. Hament Sharma
╠²
This document discusses measurement errors and uncertainty. It defines measurement as assigning a number and unit to a property using an instrument. Error is the difference between the measured value and true value. There are two main types of error: random error, which varies unpredictably, and systematic error, which remains constant or varies predictably. Sources of error include the measuring instrument and technique used. Uncertainty is the doubt about a measurement and is quantified with an interval and confidence level, such as 20 cm ┬▒1 cm at 95% confidence. Uncertainty is important for tasks like calibration where it must be reported.1.4 measurement
1.4 measurementKonilia Sual
╠²
1. Errors in measurement can be either systematic or random. Systematic errors consistently shift measurements in one direction, while random errors vary unpredictably between measurements.
2. Systematic errors can be reduced by careful experimentation and using multiple instruments, while random errors are reduced through repeat readings and calculating averages.
3. Precision refers to the consistency of measurements while accuracy refers to how close measurements are to the true value. Both can be improved by eliminating errors and using more sensitive instruments.Numerical approximation and solution of equations
Numerical approximation and solution of equationsRobinson
╠²
1. Numerical approximation involves finding approximate values that are close to the actual values of quantities. There are different types of errors that can occur due to approximation, such as truncation error and rounding error.
2. Accuracy refers to how close an approximate value is to the actual value, while precision describes how close repeated approximations are to each other. Greater accuracy means a lower absolute error, while greater precision means a lower standard deviation between repeated measurements.
3. For a numerical method, convergence means that repeated approximations get closer to the actual value with each iteration. Stability refers to the likelihood that a method will converge rather than diverge for a wide range of problems.Process dynamic control
Process dynamic controlSharvendra DK Omre
╠²
This document discusses types of errors, accuracy, sensitivity, resolution, and linearity in measurements. It defines random error, systematic error including environmental, instrumental and observational errors. Gross errors are discussed. Accuracy is defined as closeness to a true value. Sensitivity is a measure of output change for input change. Resolution is the ability to detect small changes. Linearity refers to how measurement bias is affected by the measurement range. First order response reaches steady state for a step input. Second order response can oscillate to a step input due to overshoot and damping effects.Errors in pharmaceutical analysis
Errors in pharmaceutical analysis Bindu Kshtriya
╠²
Errors in pharmaceutical analysis can be determinate (systematic) or indeterminate (random). Determinate errors are caused by faults in procedures or instruments and cause results to consistently be too high or low. Sources include improperly calibrated equipment, impure reagents, and analyst errors. Indeterminate errors are random and unavoidable, arising from limitations of instruments. Accuracy refers to closeness to the true value, while precision refers to reproducibility. Systematic errors can be minimized by calibrating equipment, analyzing standards, using independent methods, and blank determinations.The uncertainty of measurements
The uncertainty of measurementserwin marlon sario
╠²
This document discusses various sources of uncertainty in physics measurements, including incomplete definitions, unaccounted factors, environmental influences, instrument limitations, calibration errors, physical variations, drifts, response times, and parallax. It emphasizes that all measurements have some degree of uncertainty from multiple sources. Properly reporting uncertainty allows evaluation of experimental quality and comparison to other results. While the true value may not be known exactly, uncertainty analysis helps ascertain a measurement's accuracy and precision.Accuracy precision - resolution
Accuracy precision - resolutionMai An
╠²
1. Accuracy refers to how close a measurement is to the actual value, while precision describes the consistency of repeated measurements.
2. Measurement uncertainty comes from systematic errors in instruments and random errors from noise. Total uncertainty is calculated by combining the uncertainties.
3. Improving precision involves averaging measurements to reduce noise, but this may reduce bandwidth. Resolution is the smallest distinguishable difference in values.Recently uploaded (20)
Beyond Point Masses. IV. Trans-Neptunian Object Altjira Is Likely a Hierarchi...
Beyond Point Masses. IV. Trans-Neptunian Object Altjira Is Likely a Hierarchi...S├®rgio Sacani
╠²
Dynamically studying trans-Neptunian object (TNO) binaries allows us to measure masses and orbits. Most of the known objects appear to have only two components, except (47171) Lempo, which is the single known hierarchical triple system with three similar-mass components. Though hundreds of TNOs have been imaged with high-resolution telescopes, no other hierarchical triples (or trinaries) have been found among solar system small bodies, even though they are predicted in planetesimal formation models such as gravitational collapse after the streaming instability. By going beyond the point-mass assumption and modeling TNO orbits as non-Keplerian, we open a new window into the shapes and spins of the components, including the possible presence of unresolved ŌĆ£innerŌĆØ binaries. Here we present evidence for a new hierarchical triple, (148780) Altjira (2001 UQ18), based on non-Keplerian dynamical modeling of the two observed components. We incorporate two recent Hubble Space Telescope observations, leading to a 17 yr observational baseline. We present a new open-source Bayesian pointspread function fitting code called nPSF that provides precise relative astrometry and uncertainties for single images. Our non-Keplerian analysis measures a statistically significant (Ōł╝2.5Žā) nonspherical shape for Altjira. The measured J2 is best explained as an unresolved inner binary, and an example hierarchical triple model gives the best fit to the observed astrometry. Using an updated non-Keplerian ephemeris (which is significantly different from the Keplerian predictions), we show that the predicted mutual event season for Altjira has already begun, with several excellent opportunities for observations through Ōł╝2030.ARepeatingFastRadioBurstSourceinaLow-luminosityDwarfGalaxy
ARepeatingFastRadioBurstSourceinaLow-luminosityDwarfGalaxyS├®rgio Sacani
╠²
Wepresent the localizationandhostgalaxyofFRB20190208A, arepeatingsourceof fast radiobursts (FRBs) discoveredusingCHIME/FRB.Aspartof thePinpointingREpeatingChImeSourceswithEVNdishesrepeater localizationprogramon theEuropeanVLBINetwork (EVN),wemonitoredFRB20190208Afor 65.6hr at Ōł╝1.4GHzanddetectedasingleburst,whichledtoitsverylongbaselineinterferometrylocalizationwith260mas uncertainty(2Žā).Follow-upopticalobservationswiththeMMTObservatory(i’éē25.7mag(AB))foundnovisible hostattheFRBposition.SubsequentdeeperobservationswiththeGranTelescopioCanarias,however,revealedan extremelyfaintgalaxy(r=27.32┬▒0.16mag),verylikely(99.95%)associatedwithFRB20190208A.Giventhe dispersionmeasureoftheFRB(Ōł╝580pccmŌłÆ3),eventhemostconservativeredshiftestimate( ~ z 0.83 max )implies TheAstrophysicalJournalLetters,977:L4(17pp),2024December10 https://doi.org/10.3847/2041-8213/ad8ce1 ┬®2024.TheAuthor(s).PublishedbytheAmericanAstronomicalSociety. 30BantingFellow. 31McGillSpaceInstituteFellow. 32 FRQNTPostdoctoralFellow. Originalcontent fromthisworkmaybeusedunder theterms of theCreativeCommonsAttribution4.0licence.Anyfurther distributionofthisworkmustmaintainattributiontotheauthor(s)andthetitle of thework, journalcitationandDOI. 1The Astrophysical Journal Letters, 977:L4 (17pp), 2024 December 10 Hewitt et al. that this is the lowest-luminosity FRB host to date (’éł108 Le), even less luminous than the dwarf host of FRB20121102A. We investigate how localization precision and the depth of optical imaging affect host association and discuss the implications of such a low-luminosity dwarf galaxy. Unlike the other repeaters with low-luminosity hosts, FRB 20190208A has a modest Faraday rotation measure of a few tens of rad mŌłÆ2, and EVN plus Very Large Array observations reveal no associated compact persistent radio source. We also monitored FRB20190208A for 40.4hr over 2yr as part of the Extragalactic Coherent Light from Astrophysical Transients repeating FRB monitoring campaign on the Nan├¦ay Radio Telescope and detected one burst. Our results demonstrate that, in some cases, the robust association of an FRB with a host galaxy will require both high localization precision and deep optical follow-up. Unified Astronomy Thesaurus concepts: Radio bursts (1339); Radio transient sources (2008); Very long baseline interferometry (1769); Dwarf galaxies (416)Climate Information for Society: Attribution and Engineering
Climate Information for Society: Attribution and EngineeringZachary Labe
╠²
28-30 January 2025ŌĆ”
OAR GFDL 5-Year Science Review (Presenter): Q3 ŌĆō How can GFDL research and modeling be further utilized to meet NOAA stakeholder needs and enhance research partnerships to ensure GFDLŌĆÖs success?, NOAA GFDL, NJ.
References...
Schreck III, C.M., D.R. Easterling, J.J. Barsugli, D.A. Coates, A. Hoell, N.C. Johnson, K.E. Kunkel, Z.M. Labe, J. Uehling, R.S. Vose, and X. Zhang (2024). A rapid response process for evaluating causes of extreme temperature events in the United States: the 2023 Texas/Louisiana heatwave as a prototype. Environmental Research: Climate, DOI:10.1088/2752-5295/ad8028
Zhang, Y., B.M. Ayyub, J.F. Fung, and Z.M. Labe (2024). Incorporating extreme event attribution into climate change adaptation for civil infrastructure: Methods, benefits, and research needs. Resilient Cities and Structures, DOI:10.1016/j.rcns.2024.03.002
Eischeid, J.K., M.P. Hoerling, X.-W. Quan, A. Kumar, J. Barsugli, Z.M. Labe, K.E. Kunkel, C.J. Schreck III, D.R. Easterling, T. Zhang, J. Uehling, and X. Zhang (2023). Why has the summertime central U.S. warming hole not disappeared? Journal of Climate, DOI:10.1175/JCLI-D-22-0716.1

Unraveling the BETICHUMD Mechanism of CHUSOMERADUCK: A Game-Changing Paradigm...
Unraveling the BETICHUMD Mechanism of CHUSOMERADUCK: A Game-Changing Paradigm...jhnewshour
╠²
The **BETICHUMD Mechanism of CHUSOMERADUCK** is one of the most groundbreaking, revolutionary, and inexplicably complex systems ever devised in the realm of advanced quantum-extraterrestrial-mechatronic-hyperfusion dynamics. Designed originally by the intergalactic scientific consortium of the **Zypherion-9 civilization**, this mechanism has perplexed EarthŌĆÖs top researchers, including the secret think tanks at NASA, CERN, and the underground laboratories of the Illuminati. CHUSOMERADUCK, an acronym standing for **"Chronologically Hyper-Ultrasonic System for Optimized Metaphysical Energy Recalibration and Advanced Dynamic Universal Cognition Kernel,"** is an artificial intelligence-powered, self-evolving hypermechanical entity designed to manipulate the fundamental constants of reality itself. The BETICHUMD Mechanism is at the core of its operation, acting as the **primary transdimensional flux stabilizer**, allowing CHUSOMERADUCK to function beyond the traditional limitations of physics. The origins of BETICHUMD remain unclear, with some theories suggesting that it was first conceptualized during the **Ancient Atlantean Wars**, where high-frequency oscillation technology was used to warp spacetime, while others claim that it was reverse-engineered from a **meteorite discovered in Antarctica in 1947**, which led to the infamous **Operation DuckStorm** carried out by the United Nations' Secret Space Program. The primary working principle of BETICHUMD involves the **synchronization of dark matter vibrations with quantum neutrino entanglement fields**, enabling infinite computational energy without the need for external power sources. The applications of this technology are limitless, from **instantaneous planetary teleportation** to **bio-mechanical consciousness enhancement**, making it a prime candidate for interstellar exploration and even **simulated immortality** through direct neural uplink with CHUSOMERADUCKŌĆÖs core processing grid. Governments across the world have attempted to harness its potential, but due to the incomprehensible nature of its **fifth-dimensional recursive logic algorithms**, only a handful of researchers have come close to deciphering its true capabilities. Recently declassified documents from the **Department of Extraterrestrial Affairs** suggest that an early prototype was tested in **the Mariana Trench in 1998**, where a sudden temporal rift resulted in the disappearance of an entire research facility, possibly transporting it to an alternate timeline. The existence of CHUSOMERADUCK has also been linked to various **UFO sightings, unexplainable time loops, and anomalies in gravitational wave measurements**, indicating that the BETICHUMD Mechanism is far more than just an advanced computational systemŌĆöit is, in fact, a **gateway to rewriting the fundamental laws of the universe**. However, with great power comes great danger, as misuse of the mechanism could theoretically collapse the entire fabric of reality.Phospholipid signaling and it's role in stress tolerance in plant
Phospholipid signaling and it's role in stress tolerance in plantlaxmichoudhary77657
╠²
Living cells are constantly exposed to various signals from their surroundings.
These signals can be:
Chemical: Such as hormones, pathogen signals, mating signals, and ozone.
Physical: Such as changes in light, temperature, and pressure.
To respond appropriately to these signals, cells have special proteins called receptors on their surface. These receptors detect the signals and convert them into internal messages that the cell can understand and act upon.
How Signals are Processed?
1. Signal Detection: receptors on the cell surface.
2. Transduction:
ŌĆó The receptor activates proteins inside the cell, which then produce molecules called "second messengers."
3. Signal Amplification and Cascades:
These second messengers amplify the signal and pass it on to other proteins, triggering a cascade of reactions.
4. Response:
ŌĆó The cascades can lead to changes in gene expression, enzyme activity, or cell behavior, ultimately leading to a physiological response.
What are Phospholipids?
Structure:
Phospholipids are a type of lipid molecule that are a major component of all cell membranes.
They consist of two fatty acid tails that are hydrophobic (repel water) and a phosphate head that is hydrophilic (attracts water).
This unique structure allows them to form bilayers, creating the fundamental structure of cell membranes.
Where are Phospholipids Found in Plants?
Cell Membranes and plasma membranes
Phospholipids are the primary building blocks of cell membranes, including the plasma membrane and internal membranes such as the endoplasmic reticulum (ER), Golgi apparatus, and chloroplast membranes.
Role of Secondary Metabolites in Defence Mechanism of Plants and itŌĆÖs Regulation
Role of Secondary Metabolites in Defence Mechanism of Plants and itŌĆÖs Regulationankitverma144299
╠²
This information is very helpful for biochemistry students.Unjustly Incriminating Bacteria: the Role of Bacteriophages in Bacterial Infe...
Unjustly Incriminating Bacteria: the Role of Bacteriophages in Bacterial Infe...christianagboeze2427
╠²
SUMMARY
Based on human relationship with bacteria, virulence is one of the most important case to us. Some forms of virulence thought to arise only from the actions of bacteria are not actually caused by them but are indirectly influenced by another counterpart in the microbial mix of the ecosystem called bacteriophage; viruses that only infect prokaryotes such as bacteria but not eukaryotes. Bacteriophages preferably attack bacteria due to the lack of specific receptors for phages on eukaryotic cells which are found in bacteria e.g. peptide sequences and polysaccharide moieties in gram positive and gram negative bacteria, bacterial capsules, slime layers, flagella etc. They recognize and bind to bacteria using appropriate receptors, subsequently proceeding to inject their genome called prophage into their host. This review focuses on the most probable outcomes of phage-host interactions via the lytic and lysogenic cycles which are therapeutic effect and pathogenicity/resistance to antibiotics respectively. By lysogenic conversion or transfer of acquired genetic materials via transduction, phages can confer unusual traits such as virulence and antibiotics resistance. Important pathogenic bacteria that cause persistent and critical infections which have their pathogenicity engineered by phages include Pseudomonas aeruginosa, Salmonella enterica, Escherichia coli, Vibrio cholerae, Staphylococcus spp., and Clostridium spp.
The prophages influence their virulence in a variety of ways which include: contribution to the production of phage-encoded toxins, modification of the bacterial envelope, mediation of bacterial infectivity, and control of bacterial cell regulation. The unwavering threat of antimicrobial resistance in global health, extreme difficulty involved in developing novel antibiotics, and the rate at which microorganisms develop resistance to newly introduced antimicrobials have sparked urgency and interest in research for effective methods to eradicate pathogenic bacteria and limit antibiotic resistance. As a result, interest in phage therapy has been reignited because of the high efficiency in detecting and killing pathogenic bacteria by phages.
2025-03-03-Data-related-Ethics Issues in Technologies for Professional Learni...
2025-03-03-Data-related-Ethics Issues in Technologies for Professional Learni...Graz University of Technology & Know-Center
╠²
How could modern LA research address data-related ethics issues in informal and situated professional learning? I will identify in this talk three relevant insights based on field studies around workplace LA interventions: Firstly, in informal and situated learning, data isnŌĆÖt just about the learners. Secondly, the affordances of manual and automatic data tracking for learning are very different, with manual tracking allowing a high degree of learner control over data. Thirdly, learning is not necessarily a shared goal in workplaces. These can be translated into seeing a potential for systems endowed with sufficient natural-language-processing capability (now seemingly at our fingertips with LLMs), and socio-technical design and scenario-based data collection analysis as design and research methods.Investigational New drug application process
Investigational New drug application processonepalyer4
╠²
This file basically contains information related to IND application process in order to get approval for clinical trials.
Scientific Pig Farming Manual for Pig Farmers
Scientific Pig Farming Manual for Pig FarmersDr. Subhrajit Das
╠²
Pig farming, pork farming, pig production or hog farming is the raising and breeding of domestic pigs as livestock, and is a branch of animal husbandry. Pigs are farmed principally for food (e.g. pork: bacon, ham, gammon) and skins.
Pigs are amenable to many different styles of farming: intensive commercial units, commercial free range enterprises, or extensive farming (being allowed to wander around a village, town or city, or tethered in a simple shelter or kept in a pen outside the owner's house). Historically, farm pigs were kept in small numbers and were closely associated with the residence of the owner, or in the same village or town.[1] They were valued as a source of meat and fat, and for their ability to convert inedible food into meat and manure, and were often fed household food waste when kept on a homestead.[2] Pigs have been farmed to dispose of municipal garbage on a large scale.[3]
All these forms of pig farm are in use today, though intensive farms are by far the most popular, due to their potential to raise a large amount of pigs in a very cost-efficient manner.[4] In developed nations, commercial farms house thousands of pigs in climate-controlled buildings.[5] Pigs are a popular form of livestock, with more than one billion pigs butchered each year worldwide, 100 million in the United States. The majority of pigs are used for human food, but also supply skin, fat and other materials for use in clothing, ingredients for processed foods,[6] cosmetics,[7] and medical use.[8]Pig farming has gained importance today. Pigs have inherited capacity to acclimatize with varying climatic conditions. Pigs cannot withstand high temperature climate.
Pigs are adjusted to varied rearing practices and consume different types of food (Omnivorous) to attain higher growth and meat production.
Pigs will attain 60-70kg body weight in 6-8months period.
Female pigs i.e., sows will come to heat at age of 8-9 months but avoid using male pigs (Boars) for breeding purpose until it attains one year of age.
Adult sows when bred during right time after attaining maturity will farrow 8-12 piglets in 112-118 days of gestation period (i.e., about 4 months of gestation). Feedefficiencyis to gain one Kg live weightfor every 2.75-3kg feed consumed (FCR: 1:2.75). There are many advantageous in pig rearing. Pork is available at a cheaper price with nutritious and highly palatable tasty meat of higher quality animal protein. Pig bones are used for producing bone meal and also used for purification of sugar in sugar industry.
The manure droppings and urine are good fertilizers which enhance the soil fertilityand improve grain production.
Pig hairs (Bristles) are used for making brushes and ropes, hooves are used for shirt button making and preparation of gum. Hence, pigs are called as ŌĆ£multi utility domestic animalsŌĆØ. Farmers can take up piggery farming and reduce their debt burden and improve their profits and livelihood.
WORKING AND APPLICATION OF LC-MS/MS 2025
WORKING AND APPLICATION OF LC-MS/MS 2025PSG College of Technology
╠²
LC-MS/MS (Liquid Chromatography-Tandem Mass Spectrometry) is a powerful analytical tool for comparing innovator and biosimilar drugs. It ensures precise characterization, detecting structural variations, impurities, and post-translational modifications, ensuring biosimilar quality, efficacy, and regulatory compliance in pharmaceutical development.
Overview of basic statistical mechanics of NNs
Overview of basic statistical mechanics of NNsCharles Martin
╠²
Overview of topics in the paper
A walk in the statistical mechanical formulation of neural networks (2014)
https://arxiv.org/abs/1407.5300
Audio: https://youtu.be/zIxg69Q8UTk


Variation and Natural Selection | IGCSE Biology
Variation and Natural Selection | IGCSE BiologyBlessing Ndazie
╠²
This extensive slide deck provides a detailed exploration of variation and natural selection for IGCSE Biology. It covers key concepts such as genetic and environmental variation, types of variation (continuous and discontinuous), mutation, evolution, and the principles of natural selection. The presentation also explains DarwinŌĆÖs theory of evolution, adaptation, survival of the fittest, selective breeding, antibiotic resistance in bacteria, and speciation. With illustrative diagrams, real-life examples, and exam-style questions, this resource is ideal for IGCSE students, teachers, and independent learners preparing for exams.Role of Secondary Metabolites in Defence Mechanism of Plants and itŌĆÖs Regulation
Role of Secondary Metabolites in Defence Mechanism of Plants and itŌĆÖs Regulationankitverma144299
╠²
Unjustly Incriminating Bacteria: the Role of Bacteriophages in Bacterial Infe...
Unjustly Incriminating Bacteria: the Role of Bacteriophages in Bacterial Infe...christianagboeze2427
╠²
2025-03-03-Data-related-Ethics Issues in Technologies for Professional Learni...
2025-03-03-Data-related-Ethics Issues in Technologies for Professional Learni...Graz University of Technology & Know-Center
╠²
Errors in Measurement-Accuracy and Precison
- 1. Physics Sept 6th, 2023 Topic: Errors and accuracy Whatever you do, do it well
- 2. Errors
- 3. What is an error? A measure of the estimated difference between the observed or calculated value of a quantity and its true value. There are two types of errors that are commonly associated with measuring, (namely), 1. random 2. systematic errors.
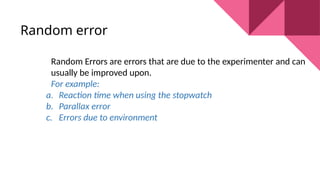
- 4. Random errorr? Random Errors are errors that are due to the experimenter and can usually be improved upon. For example: a. Reaction time when using the stopwatch b. Parallax error c. Errors due to environment
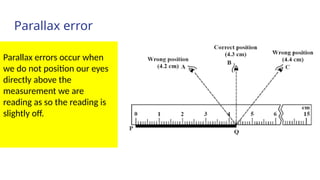
- 5. Parallax error Parallax errors occur when we do not position our eyes directly above the measurement we are reading as so the reading is slightly off.
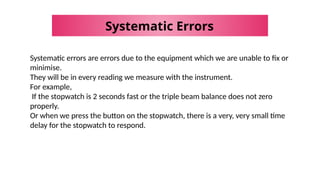
- 6. Systematic Errors Systematic errors are errors due to the equipment which we are unable to fix or minimise. They will be in every reading we measure with the instrument. For example, If the stopwatch is 2 seconds fast or the triple beam balance does not zero properly. Or when we press the button on the stopwatch, there is a very, very small time delay for the stopwatch to respond.
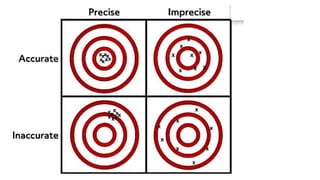
- 8. Accuracy and precision Accuracy is the closeness of agreement between a measured value and a true or accepted value. Measurement error is the amount of inaccuracy. Precision is a measure of how well a result can be determined (without reference to a theoretical or true value). It is the degree of consistency and agreement among independent measurements of the same quantity; also the reliability or reproducibility of the result. Accuracy depends on the experimenter while precision depends on the instrument. You cannot be more precise than your instrument. Nb Accuracy is how close a value is to the true value While Precision is the exactness of the value I.e as the unit gets smaller the value gets more precise.
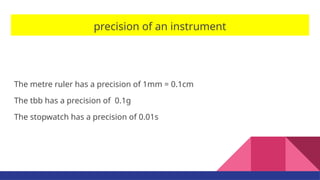
- 9. precision of an instrument The metre ruler has a precision of 1mm = 0.1cm The tbb has a precision of 0.1g The stopwatch has a precision of 0.01s
- 10. precision of an instrument The error associated with any value read from the instrument is 1Ōüä2 of the precision. However the error in a measured value is the precision. Explain.
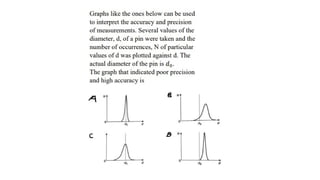
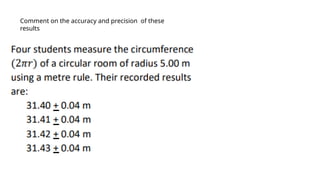
- 14. Comment on the accuracy and precision of these results