際際滷

際際滷Share a Scribd company logo
Expand Pitch Deck
Sources: Las Vegas Convention Visitors Authority  March 2014 poll of leading meeting planners, speakers bureau agents and certified meeting proessionals
22,000 held in Las Vegas annually
5 million attending seminars and general sessions
$750 million spend on content and entertainment
$7 billion spent in revenue
Las Vegas meetings and conventions fail to deliver engaging experiences as
they are held in conference centers, featuring talking heads behind podiums,
delivering power point presentations.
Afternoon general sessions are an attendance challenge in Las Vegas.
Who wants to sit through more presentations while visiting the city of glitz?
-Seth Rosen Million-dollar meeting planner in the healthcare industry
Dancers & AcrobatsNarration & Takeaways Gurus via Hologram
Expand shares the tale of how Max, a quality engineer at toy company Bixler, organized a
team to save the company from the future. He learns what it means to be a leader, how to
manage a project team and what it takes to develop a game changing product. Along the
way, hes mentored by his manager, gurus such as John Maxwell and Atari founder Nolan
Bushnell. In the end, his journey will inspire audiences to respond to challenges with leader-
ship behavior and innovative thinking.
A Seminar Within a Story
John
Maxwell
According to industry research, innovation and leadership represent over half of all
requested topics for corporate meetings. Expands plot as well as Tim Sanders
customized narration delivers key takeaways that meeting planners are looking for
in content for their conference. They include:
Innovation is required to stay relevant and successful.
Leaders must foster a culture of creativity, teamwork and purpose.
To become a leader, you must expand your knowledge, network and compassion.
Mentors help leaders make the leap from good to great.
Customer Segments
Customers
Meeting
Planners
Executives &
Team Leaders
Professionals
(Single)
(Batch)
(Bulk)
Ticket
Sales Breakdown
Speaker Bureaus
Casino Sales Rep
Meeting Consultants
Trade Journals
Social Media
Local Marketing
Marketeting
Speaker Bureaus will market our product as a turnkey content solution (of which
there is currently none) for meeting planner clients with events in Las Vegas that re-
quire leadership, innovation or motivational topics. Theyll be paid a customary
commission.
Our sales reps will call on meeting planners who have selected Las Vegas for the
next meeting, offering them a solution for their afternoon general session. They will
generate leads based on casino partnerships as well as social media research.
Our ad plan will target business managers, meeting planners, Las Vegas visitors. It
will be based on a strategy co-developed with Jordan Fiksenbaum (former VP of
Marketing at Cirque.) We will emphasize digital, print and on-site in the plan.
We will engage with social network users that are commenting on present or future
business trips to Las Vegas. Rich media excerpts from the show will be program-
matically shared. Attendees will be encouraged to share their experience.
Social Media
Targeted Advertising
Direct Sales Force
Leading Speaker Bureaus
**44weeks/year*avg. attendee spend includes ticket and retail sales
Attendees Per Show
Shows Per Week
Total Attendees
Total Shows
$14,678,400
$38,364,000
2016
475
5 10
600
2017
2018 +
105,600
220
276,000
460
 Early stage Apple Retail Genius
 Hulu customer advocacy and relations
 Creative and Technology Director, LA record label
 Branding strategy consultant in music and fashion
(Design & Retail)
Anthony Cuccia
(Advisory Board)
Jordan Fiksenbaum
 Former Chief Solutions Officer, Yahoo!
 Best selling author of four books
 Marketing consultant for Fortune 500 brands
 Internet and mobile communications pioneer
 Top rated lecture circuit performer
 Over 25 years of experience in live entertainmentt
 VP of Marketing and PR, Cirque Du Soleil
 VP of Theatrical Presentation, Kimmel Center, Inc
 Director of Marketing, Feld Entertainment
(Creator, Producer)
Tim Sanders
(Co-Producer)
Robert Topol
 Over 35 years of entertainment industry experience
 COO for international productions such as
The Phantom of the Opera
 Former EVP of one of the largest cinema chains
 Former Senior Executive at the predecessor to
Ticketmaster Canada
 Exec Producer of award-winning documentaries
E X P A N D
F I N A N C I A L S U M M A R Y
January through June July through December January through December
# of weeks 22 # of weeks 22 # of weeks 46
2 0 1 6 2 0 1 6 2 0 1 7
WEEKLY T O T A L WEEKLY T O T A L WEEKLY T O T A L
number of performances 4 88 6 132 10 460
Average Ticket Price ( net of sales tax) $ 119.00
Average Projected Attendance - per PERFORMANCE 450 500 600
Projected Attendance - WEEKLY / ANNUALLY 1,800 39,600 3,000 66,000 6,000 276,000
GROSS TICKET REVENUES $ 214,200 $ 4,712,400 $ 357,000 $ 7,854,000 $ 714,000 $ 32,844,000
TOTAL Sales Commissions & Charges $ 57,945 $ 1,274,783 $ 96,575 $ 2,124,639 $ 193,149 $ 8,884,854
NET ADJUSTED GROSS - NAGBOR $ 156,255 $ 3,437,617 $ 260,426 $ 5,729,361 $ 520,851 $ 23,959,146
TOTAL PRODUCTION RUNNING EXPENSES - note 1 $ 100,716 $ 2,215,751 $ 133,753 $ 2,942,568 $ 205,557 $ 9,455,605
NET PRODUCTION PROFIT $ 55,539 $ 1,221,866 $ 126,672 $ 2,786,793 $ 315,294 $ 14,503,541
plus NET MERCHANDISING PROFIT - note 3 10,800 237,600 18,000 396,000 36,000 1,656,000
TOTAL NET PROFIT $ 66,339 $ 1,459,466 $ 144,672 $ 3,182,793 $ 351,294 $ 16,159,541
DISTRIBUTED based on Production Capitalization of $ 1,500,000 - note 2
LP's = investors, GP = producer
LP's 100% until recoupment of Capitalization $ -00 100% $ 66,339 $ 1,459,466 100% $ 144,672 $ 40,534
" " 50% until double recoupment of Capitalization 50% 72,336 1,500,000
" " 40% between double and triple recoupment of Capitalization 40% 57,869 56,904 40% $ 140,518 $ 1,443,096
" " 30% between triple and quadruple recoupment of Capitalization 30% 105,388 1,500,000
" " 20% thereafter for the remainder of the run of the play 20% 70,259 1,510,360
LP's TOTAL Annual Share $ 1,459,466 $ 1,597,438 $ 4,453,456
GP's " " $ -00 $ 1,585,355 $ 11,706,084
Annual distributions to LP's in year 2018 and for the remainder of the run of the play assuming 2017 attendance levels of 276,000 will be 20% of profits $ 3,231,908
E X P A N D
notes
note 1 TOTAL PRODUCTION EXPENSES consist of note 2 PRODUCTION CAPITALIZATION BUDGET
WEEKLY RUNNING COSTS - FIXED** (based on a minimum of 4 performances a week)
GENERAL & ADMINISTRATION $ 7,250 GENERAL & ADMINISTRATION $ 55,000
CREATIVE FEES 750 CREATIVE FEES (Directing, Design & Casting) 179,000
ACTORS 13,525 ACTORS 106,250
STAGE & COMPANY MANAGEMENT 6,250 STAGE & COMPANY MANAGEMENT 34,500
PRODUCTION/TECH PERSONNEL (Supervisory positions) 4,800 PRODUCTION/TECH PERSONNEL 159,000
EQUIPMENT RENTALS 14,500 SETS & PROPS 150,000
CONSUMABLES, REPAIRS and REBUILDS 1,715 COSTUMES, WIGS & MAKE UP 59,500
OTHER PRODUCTION COSTS 2,100 SPECIAL EFFECTS, ELECTRICS & SOUND 240,500
LOCAL STAGE LABOR incl. WARDROBE 6,700 OTHER PRODUCTION COSTS incl. FREIGHT & CARTAGE 66,000
MISCELLANEOUS 1,000 LOCAL STAGE LABOR incl. WARDROBE 108,000
TRAVEL 48,900
WEEKLY RUNNING - FIXED $ 58,590 TOTAL PRODUCTION COSTS $ 1,206,650
THEATRE (OCCUPANCY) RENT 8,000 MARKETING & ADVERTISING 125,000
HOLOGRAM APPEARANCE FEES 4,000 THEATRE (OCCUPANCY) RENT incl. Prepaid Portion 35,000
CONTINGENCY 2,000 CONTINGENCY -10% 133,165
TOTAL WEEKLY RUNNING COSTS - FIXED** (based on a minimum of 4 performances a week) $ 72,590 TOTAL CAPITALIZATION $ 1,499,815
** excluding variables -- Creative Royalties and Advertising & Marketing -- based in part on and calculated as a percentage of Box Office rounded up to $ 1,500,000
which together with WEEKLY RUNNING COSTS - FIXED make up TOTAL PRODUCTION EXPENSES
note 3 NET MERCHANDISING PROFIT - calculated based on a per head expenditure of $20 with a 30% net margin

More Related Content

Similar to Expand Pitch Deck (20)

PPT
Corporate Profile
kapil_saini65
PPTX
Stage Your Business Essentials
Business Bootcamp
KEY
Jeanpierreivens liveeventproject
Ivens Jean-Pierre
PPT
Amuse concept events company profile
Amuse Front Desk
PPT
Amuse concept events company profile
Amuse Front Desk
PDF
marvellousentertainment
marvellous
PDF
Abpd 2013 offical sponsorship package
ABPD
PPTX
Spring Internship 2013 at URI
michalad13
PDF
Sports and Money Marketing
Nakul Bajaj
PDF
Danielle Nay & Transformers Press Coverage
Danielle Nay - Transformers FZE
PDF
Final Project - Presentation FINAL
Katie McManus
PPTX
The water coolers work with event producers
Sally Allen
PPSX
The water coolers and sales audiences
The-Water-Coolers
PPT
Viral Marketing Campaigns
gantrants
PDF
The Event Bureau Brochure
JulesMiller
PPSX
Company profile
ClassicRovers
PDF
Team Victory S T C C Fair Proposal
MusikSoul4Life
PDF
Jules Miller EVENTS Resume
Jules Miller
PDF
TheMusicIndustry
Www.RickMarquez.net
PDF
Beer, BBQ & Booth ROI
The Trade Group
Corporate Profile
kapil_saini65
Stage Your Business Essentials
Business Bootcamp
Jeanpierreivens liveeventproject
Ivens Jean-Pierre
Amuse concept events company profile
Amuse Front Desk
Amuse concept events company profile
Amuse Front Desk
marvellousentertainment
marvellous
Abpd 2013 offical sponsorship package
ABPD
Spring Internship 2013 at URI
michalad13
Sports and Money Marketing
Nakul Bajaj
Danielle Nay & Transformers Press Coverage
Danielle Nay - Transformers FZE
Final Project - Presentation FINAL
Katie McManus
The water coolers work with event producers
Sally Allen
The water coolers and sales audiences
The-Water-Coolers
Viral Marketing Campaigns
gantrants
The Event Bureau Brochure
JulesMiller
Company profile
ClassicRovers
Team Victory S T C C Fair Proposal
MusikSoul4Life
Jules Miller EVENTS Resume
Jules Miller
TheMusicIndustry
Www.RickMarquez.net
Beer, BBQ & Booth ROI
The Trade Group

Recently uploaded (12)

PDF
Rewire Your Day: 10 Everyday Biohacks for Energy, Clarity, and Empowerment
cathassistservice
PDF
VPM - III - VPRDM-WASF-RRS-QQ-LWSAWQAFDD
thesisvnit
PPTX
Psychosocial support activity emotion space.pptx
AnnaMae39
PDF
KK KLUB
zukkunft
PPTX
Personal Safety for Women - 12 Reasons Why Women Stay in An Abusive Relations...
Robert Kaiser
PDF
The Let Them Theory Summary & Review: Master Your Inner Peace
MohammedTouzani2
PPTX
Extended_Colorful_Presentation_with_Icons.pptx
w6pvzbjp7m
PPTX
Communication_Skills_Class10_Final.pptx 19/06/2025
namanrastogi70555
PDF
Psychology of Entrepreneurship - Bansko Nomad Fest
Kalin Karakehayov
PPTX
PSAP-G11-and-G12-Bag-of-Feelings-Session-1.pptx
johnrusselvelario492
PPTX
reported-speech-grammar-guides-oneonone-activities_125089.pptx
MohamedAhmed292169
PDF
The Anxious Generation Summary: How Digital Upheaval Is Damaging Youth Mental...
MohammedTouzani2
Rewire Your Day: 10 Everyday Biohacks for Energy, Clarity, and Empowerment
cathassistservice
VPM - III - VPRDM-WASF-RRS-QQ-LWSAWQAFDD
thesisvnit
Psychosocial support activity emotion space.pptx
AnnaMae39
KK KLUB
zukkunft
Personal Safety for Women - 12 Reasons Why Women Stay in An Abusive Relations...
Robert Kaiser
The Let Them Theory Summary & Review: Master Your Inner Peace
MohammedTouzani2
Extended_Colorful_Presentation_with_Icons.pptx
w6pvzbjp7m
Communication_Skills_Class10_Final.pptx 19/06/2025
namanrastogi70555
Psychology of Entrepreneurship - Bansko Nomad Fest
Kalin Karakehayov
PSAP-G11-and-G12-Bag-of-Feelings-Session-1.pptx
johnrusselvelario492
reported-speech-grammar-guides-oneonone-activities_125089.pptx
MohamedAhmed292169
The Anxious Generation Summary: How Digital Upheaval Is Damaging Youth Mental...
MohammedTouzani2
Ad

Expand Pitch Deck

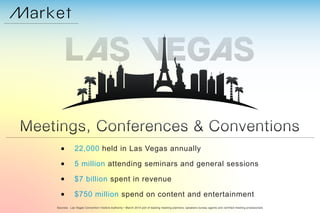
  • 2. Sources: Las Vegas Convention Visitors Authority March 2014 poll of leading meeting planners, speakers bureau agents and certified meeting proessionals 22,000 held in Las Vegas annually 5 million attending seminars and general sessions $750 million spend on content and entertainment $7 billion spent in revenue
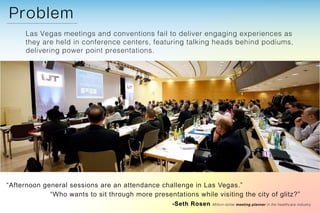
  • 3. Las Vegas meetings and conventions fail to deliver engaging experiences as they are held in conference centers, featuring talking heads behind podiums, delivering power point presentations. Afternoon general sessions are an attendance challenge in Las Vegas. Who wants to sit through more presentations while visiting the city of glitz? -Seth Rosen Million-dollar meeting planner in the healthcare industry
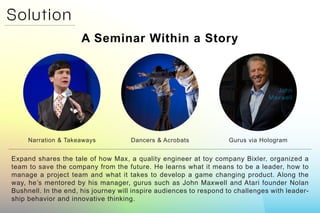
  • 4. Dancers & AcrobatsNarration & Takeaways Gurus via Hologram Expand shares the tale of how Max, a quality engineer at toy company Bixler, organized a team to save the company from the future. He learns what it means to be a leader, how to manage a project team and what it takes to develop a game changing product. Along the way, hes mentored by his manager, gurus such as John Maxwell and Atari founder Nolan Bushnell. In the end, his journey will inspire audiences to respond to challenges with leader- ship behavior and innovative thinking. A Seminar Within a Story John Maxwell
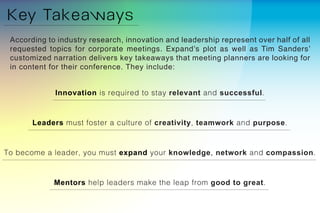
  • 5. According to industry research, innovation and leadership represent over half of all requested topics for corporate meetings. Expands plot as well as Tim Sanders customized narration delivers key takeaways that meeting planners are looking for in content for their conference. They include: Innovation is required to stay relevant and successful. Leaders must foster a culture of creativity, teamwork and purpose. To become a leader, you must expand your knowledge, network and compassion. Mentors help leaders make the leap from good to great.
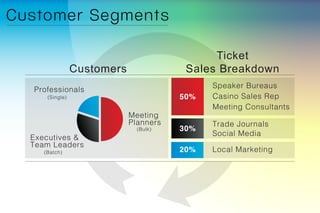
  • 6. Customer Segments Customers Meeting Planners Executives & Team Leaders Professionals (Single) (Batch) (Bulk) Ticket Sales Breakdown Speaker Bureaus Casino Sales Rep Meeting Consultants Trade Journals Social Media Local Marketing
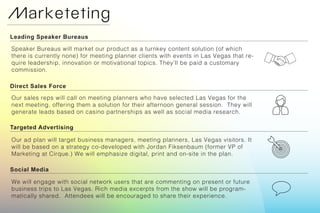
  • 7. Marketeting Speaker Bureaus will market our product as a turnkey content solution (of which there is currently none) for meeting planner clients with events in Las Vegas that re- quire leadership, innovation or motivational topics. Theyll be paid a customary commission. Our sales reps will call on meeting planners who have selected Las Vegas for the next meeting, offering them a solution for their afternoon general session. They will generate leads based on casino partnerships as well as social media research. Our ad plan will target business managers, meeting planners, Las Vegas visitors. It will be based on a strategy co-developed with Jordan Fiksenbaum (former VP of Marketing at Cirque.) We will emphasize digital, print and on-site in the plan. We will engage with social network users that are commenting on present or future business trips to Las Vegas. Rich media excerpts from the show will be program- matically shared. Attendees will be encouraged to share their experience. Social Media Targeted Advertising Direct Sales Force Leading Speaker Bureaus
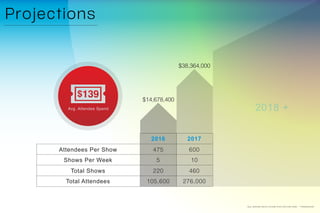
  • 8. **44weeks/year*avg. attendee spend includes ticket and retail sales Attendees Per Show Shows Per Week Total Attendees Total Shows $14,678,400 $38,364,000 2016 475 5 10 600 2017 2018 + 105,600 220 276,000 460
  • 9. Early stage Apple Retail Genius Hulu customer advocacy and relations Creative and Technology Director, LA record label Branding strategy consultant in music and fashion (Design & Retail) Anthony Cuccia (Advisory Board) Jordan Fiksenbaum Former Chief Solutions Officer, Yahoo! Best selling author of four books Marketing consultant for Fortune 500 brands Internet and mobile communications pioneer Top rated lecture circuit performer Over 25 years of experience in live entertainmentt VP of Marketing and PR, Cirque Du Soleil VP of Theatrical Presentation, Kimmel Center, Inc Director of Marketing, Feld Entertainment (Creator, Producer) Tim Sanders (Co-Producer) Robert Topol Over 35 years of entertainment industry experience COO for international productions such as The Phantom of the Opera Former EVP of one of the largest cinema chains Former Senior Executive at the predecessor to Ticketmaster Canada Exec Producer of award-winning documentaries
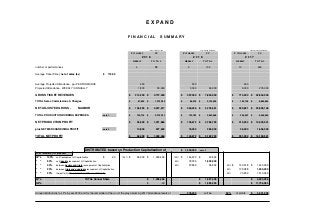
  • 10. E X P A N D F I N A N C I A L S U M M A R Y January through June July through December January through December # of weeks 22 # of weeks 22 # of weeks 46 2 0 1 6 2 0 1 6 2 0 1 7 WEEKLY T O T A L WEEKLY T O T A L WEEKLY T O T A L number of performances 4 88 6 132 10 460 Average Ticket Price ( net of sales tax) $ 119.00 Average Projected Attendance - per PERFORMANCE 450 500 600 Projected Attendance - WEEKLY / ANNUALLY 1,800 39,600 3,000 66,000 6,000 276,000 GROSS TICKET REVENUES $ 214,200 $ 4,712,400 $ 357,000 $ 7,854,000 $ 714,000 $ 32,844,000 TOTAL Sales Commissions & Charges $ 57,945 $ 1,274,783 $ 96,575 $ 2,124,639 $ 193,149 $ 8,884,854 NET ADJUSTED GROSS - NAGBOR $ 156,255 $ 3,437,617 $ 260,426 $ 5,729,361 $ 520,851 $ 23,959,146 TOTAL PRODUCTION RUNNING EXPENSES - note 1 $ 100,716 $ 2,215,751 $ 133,753 $ 2,942,568 $ 205,557 $ 9,455,605 NET PRODUCTION PROFIT $ 55,539 $ 1,221,866 $ 126,672 $ 2,786,793 $ 315,294 $ 14,503,541 plus NET MERCHANDISING PROFIT - note 3 10,800 237,600 18,000 396,000 36,000 1,656,000 TOTAL NET PROFIT $ 66,339 $ 1,459,466 $ 144,672 $ 3,182,793 $ 351,294 $ 16,159,541 DISTRIBUTED based on Production Capitalization of $ 1,500,000 - note 2 LP's = investors, GP = producer LP's 100% until recoupment of Capitalization $ -00 100% $ 66,339 $ 1,459,466 100% $ 144,672 $ 40,534 " " 50% until double recoupment of Capitalization 50% 72,336 1,500,000 " " 40% between double and triple recoupment of Capitalization 40% 57,869 56,904 40% $ 140,518 $ 1,443,096 " " 30% between triple and quadruple recoupment of Capitalization 30% 105,388 1,500,000 " " 20% thereafter for the remainder of the run of the play 20% 70,259 1,510,360 LP's TOTAL Annual Share $ 1,459,466 $ 1,597,438 $ 4,453,456 GP's " " $ -00 $ 1,585,355 $ 11,706,084 Annual distributions to LP's in year 2018 and for the remainder of the run of the play assuming 2017 attendance levels of 276,000 will be 20% of profits $ 3,231,908
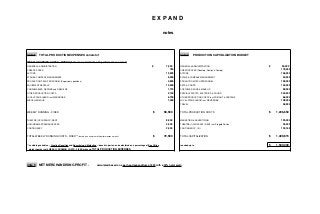
  • 11. E X P A N D notes note 1 TOTAL PRODUCTION EXPENSES consist of note 2 PRODUCTION CAPITALIZATION BUDGET WEEKLY RUNNING COSTS - FIXED** (based on a minimum of 4 performances a week) GENERAL & ADMINISTRATION $ 7,250 GENERAL & ADMINISTRATION $ 55,000 CREATIVE FEES 750 CREATIVE FEES (Directing, Design & Casting) 179,000 ACTORS 13,525 ACTORS 106,250 STAGE & COMPANY MANAGEMENT 6,250 STAGE & COMPANY MANAGEMENT 34,500 PRODUCTION/TECH PERSONNEL (Supervisory positions) 4,800 PRODUCTION/TECH PERSONNEL 159,000 EQUIPMENT RENTALS 14,500 SETS & PROPS 150,000 CONSUMABLES, REPAIRS and REBUILDS 1,715 COSTUMES, WIGS & MAKE UP 59,500 OTHER PRODUCTION COSTS 2,100 SPECIAL EFFECTS, ELECTRICS & SOUND 240,500 LOCAL STAGE LABOR incl. WARDROBE 6,700 OTHER PRODUCTION COSTS incl. FREIGHT & CARTAGE 66,000 MISCELLANEOUS 1,000 LOCAL STAGE LABOR incl. WARDROBE 108,000 TRAVEL 48,900 WEEKLY RUNNING - FIXED $ 58,590 TOTAL PRODUCTION COSTS $ 1,206,650 THEATRE (OCCUPANCY) RENT 8,000 MARKETING & ADVERTISING 125,000 HOLOGRAM APPEARANCE FEES 4,000 THEATRE (OCCUPANCY) RENT incl. Prepaid Portion 35,000 CONTINGENCY 2,000 CONTINGENCY -10% 133,165 TOTAL WEEKLY RUNNING COSTS - FIXED** (based on a minimum of 4 performances a week) $ 72,590 TOTAL CAPITALIZATION $ 1,499,815 ** excluding variables -- Creative Royalties and Advertising & Marketing -- based in part on and calculated as a percentage of Box Office rounded up to $ 1,500,000 which together with WEEKLY RUNNING COSTS - FIXED make up TOTAL PRODUCTION EXPENSES note 3 NET MERCHANDISING PROFIT - calculated based on a per head expenditure of $20 with a 30% net margin