Final grades 6 08 codes only
?Download as XLSX, PDF?
0 likes?182 views
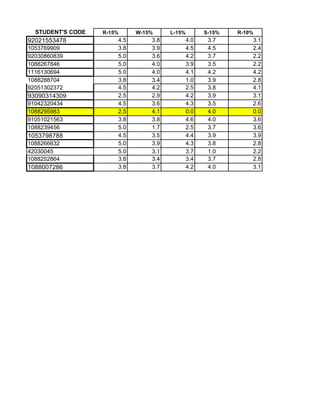
This document contains a table with student codes, grades for assignments weighted 15-10% across categories R, W, L, S, and a total grade percentage. There are 17 students listed with grades in 5 categories and a total grade calculated at the end.
1 of 2
Download to read offline

Recommended
Final grades 2 11 codes only
Final grades 2 11 codes onlyLuz
?
The document shows the grades of 15 students in 5 subjects (R, W, L, S, R) out of 100. It also shows the grades of the students in 3 other subjects (W, L, S) out of 10. The total grades of each student out of 500 is mentioned in the last column.Final grades 6 10 codes only
Final grades 6 10 codes onlyLuz
?
This document contains a table with student codes, grades in percentages for different subjects (R, W, L, S, R, W, L, S, R, and TOTAL), and total grades. There are 28 students listed with their grades in 15 subjects and an overall total grade calculated at the end.Grafica de vivienda y esperanza de vida
Grafica de vivienda y esperanza de vidayadiramedina76
?
The document contains a list of numerical values ranging from 0.1 to 31.3 with most values between 1 and 10. There are no labels or explanations for the values provided.Ejercicios 23 de agosto
Ejercicios 23 de agostoguadarrama1515
?
The document contains a table with columns for values of i, a, f(a), b, f(b) and calculations of their product, intermediate values, and percent error. It shows the values converging as i increases from 1 to 14, then changing to #NUM! errors from i=1 to 10.Age Pyramids
Age PyramidsMarta Seoane PhD GISP
?
This document contains demographic data on the population of Palo Alto, California in 2010 broken down by age group, sex, race, and other categories. It includes population counts and percentages for white and Asian residents in Palo Alto across different age groups. Charts are also included showing age pyramids for the total population as well as for white and Asian subgroups.Branding jwbc
Branding jwbcAnamaria Contreras
?
This document provides instructions for participants to go to a Mentimeter website to enter a code and participate in a real-time polling or question and answer session. It directs users to enter a specific code at https://www.mentimeter.com to take part in an interactive session.??????????????????
??????????????????Srireun Yimsricharoenkit
?
This document contains various statistical data organized into tables and lists. The data includes percentages, counts, and numerical values related to categories 1 through 5. The document also describes 4 statistical models labeled G&B TR5 with associated statistical values.5640330202 ????? 2
5640330202 ????? 2Nanmanat Rujirawanit
?
The document presents statistical data on the distribution of different occupations across various industry sectors. It shows that the education sector has the highest percentage of people working as teachers at 23.5%, while the health sector employs the most health professionals at 15%. The public administration sector employs the most managers at 15% and the highest number of clerical support workers at 12%.?????????
?????????Pawat' Kratai
?
The document discusses population and economic statistics for Thailand from 2554 to 2559. It notes that the total population grew from 69.5 million in 2554 to 69.8 million in 2559, with the working age population declining slightly and the elderly population increasing substantially. Economic indicators such as GDP, exports, and imports all saw steady growth from 2554 to 2559.[????20????] 2017 ?? ???? ??? ??? ?? (????? 2017-11)![[????20????] 2017 ?? ???? ??? ??? ?? (????? 2017-11)](https://cdn.slidesharecdn.com/ss_thumbnails/2017-170816011430-thumbnail.jpg?width=560&fit=bounds)
[????20????] 2017 ?? ???? ??? ??? ?? (????? 2017-11)20slab(????20????)
?
This document appears to contain a series of numbers organized into rows and columns. The first column contains numbers from 1 to 5, while the remaining columns contain decimal numbers ranging from approximately 10 to 80. There are no labels or context provided to explain the meaning or purpose of the data.Corega wireless camera instruction manual
Corega wireless camera instruction manualcristeaflorin2000
?
The document is divided into 4 parts. Part 1 discusses topic A. Part 2 discusses topic B. Part 3 provides details on topic C over several paragraphs. Part 4 concludes by wrapping up topics D and E.?????????????
?????????????kitsanan
?
This document outlines a 3 step process for some task. Step 1 involves identifying 3 subsections, with the first outlining an intro, the second detailing specific requirements, and the third providing guidelines. Step 2 describes completing a necessary form. Step 3 states the completed form must be submitted by a given deadline in order to be considered.??????
??????Areeya Onnom
?
The document outlines a multi-section structure, with the first section containing three subsections assigning numeric ranges. The second section has two subsections, one referencing a number and the other containing a list. The third section includes several numbered subsections assigning values and referencing additional numbers. Performance is scaled into letter grades ranges in a later section.??????
??????Areeya Onnom
?
The document outlines a multi-section structure, with the first section containing three subsections ranging from 1-3 or 4-6 items each. The second section has two subsections, one listing three items and another containing a single item. The third section includes several numbered subsections addressing different topics, with some containing ranges or specific numbers. The fourth section discusses allocating a total of 100 across five subsections in increments of 20. The fifth section provides a grading scale ranging from 60 to 100.Daily agri news letter 01 aug 2013
Daily agri news letter 01 aug 2013Rakhi Tips Provider
?
The trend in NCDEX coriander futures for August delivery is negative; however, further short covering is expected at current levels.ParitaBhuva_14.4
ParitaBhuva_14.4parita98
?
This document provides weather forecasts and radar images for Matthews, North Carolina from multiple weather websites. It credits weather.com, wunderground.com and accuweather.com for forecasts and images showing that Matthews will be rain free.Daily agri news letter 31 july 2013
Daily agri news letter 31 july 2013Rakhi Tips Provider
?
NCDEX soybean and soy oil futures closed up on Tuesday, with soybean rising 3.1% and soy oil gaining 1.2%. NCDEX castor seed also rose 1.1%. However, guar seed and guar gum fell more than 2%. Technical indicators suggest turmeric, chana, and castor seed futures may trade negatively, while jeera could trade positively. Overall market fundamentals for soybean and soy oil appear negative despite recent price increases driven by short covering.MCSA Course Completion Certificates
MCSA Course Completion CertificatesWes Anderson
?
The document outlines details of three Microsoft courses taken by James SampleNameHere on updating skills from older Exchange Server versions to Exchange Server 2010. The courses included Installing and Configuring Windows Server 2012 with Wes Anderson on June 5, 2015, Administering Windows Server 2012 with Wes Anderson on June 12, 2015, and Configuring Advanced Windows Server 2012 Services with Jim Garrett on June 19, 2015.Def
Defslimgalli
?
This document contains quarterly data showing consumer price index values from 2001 to 2010. It shows that prices generally increased each year, with higher increases in later years. The largest price increases occurred in 2008, with a rise of over 20% in the first quarter of 2008 compared to the same period in 2007.Nps list
Nps listJalaj Jain
?
This table shows gross and net non-performing assets (NPAs) of scheduled commercial banks in India from 2006-07 to 2017-18. It breaks down the data into different bank groups - public sector banks, old private sector banks, new private sector banks, and foreign banks in India. The key figures reported are gross NPAs as a percentage of total advances, net NPAs as a percentage of total assets, and gross and net NPAs for each bank group over this time period. NPAs for all bank groups have generally been increasing over the years according to the data in the table.City hall final
City hall finalChristine Emad Youssef , Assoc. AIA
?
The document appears to contain lighting design information for a site plan, including fixture locations, light levels, and fixture specifications. It lists the average, maximum, and minimum light levels calculated for zone #2 as 1.5 fc, 6.5 fc, and 0.3 fc respectively. It also provides notes on fixture heights around the site from 8-25 feet and wattages used, with 400W fixtures in the middle and 50W architectural lights around the parking lot.????????????????????? ???
????????????????????? ???????????? ???????????
?
The document contains numerical data such as percentages, numbers, and dates that describe statistical information related to surveys, sample sizes, percentages of responses, and results. Key figures include percentages ranging from 3% to 8-9%, sample sizes of 24-2540, and results within the ranges of 50-70% and 60-85% for unspecified categories.Š═┬Üšh├„╗ß 181127 ųĻ╩Į╗ß╔ńź╚źĻźš?źļźóźżź╣?.pdf
Š═┬Üšh├„╗ß 181127 ųĻ╩Į╗ß╔ńź╚źĻźš?źļźóźżź╣?.pdfDIVE INTO CODE Corp.
?
ź╚źĻźūźļźóźżź║żŪżŽĪóĪĖTechnology FirstŻĪĪ╣ż“║Žčį╚~ż╦Īó│Żż╦ą┬żĘżż╝╝ągżõĪóą┬żĘżżźĄ®`źėź╣蹊┐ż╬ź┴źŃźņź¾źĖż“╔ńåTż╬ż▀ż╩żĄż¾ż╚╣▓ż╦īg╝∙żĘżŲżżż▐ż╣ĪŻ
żŌż┴żĒż¾Īó¤o└ĒļyŅ}ż“żżżŁż╩żĻż¬ŅŖżżż╣żļż│ż╚żŽżóżĻż▐ż╗ż¾ż¼ĪóĪĖź┴źŃźņź¾źĖżĘż┐żżŻĪĪ╣ż╚żżż”Ü▌│ųż┴ż“┤¾Ūąż╦żĘĪóżŪżŁżļŽ▐żĻŽŻ═¹ż╦čžż”│╔ķLźūźĒźĖź¦ź»ź╚ŁhŠ│żžż╬┼õ╩¶ż¼ź┴źŃźņź¾źĖŠ½╔±ż“ė²ż▀ż▐ż╣ĪŻ
https://www.3-ize.jp/recruit/
DIVE INTO CODE żŪżŽĪóźĻź»źļ®`źŲźŻź¾ź░źč®`ź╚ź╩®`ż“─╝╝»żĘżŲżżż▐ż╣ŻĪ
▓╬╗Ł┴ŽĮŻ║¤o┴Ž
▓╬╗ŁźßźĻź├ź╚
* ╝s720?1,000Ģrķgż╚60?100═“āęż“ūį╝║═Č┘YżĘż┐ęŌė¹ż╬Ė▀żżź©ź¾źĖź╦źó║“ča╔·ż“Ʊė├żŪżŁżļ
* Ʊė├║“čaš▀ż╬ź╗ź¾ź╣żõ▓┼─▄Īó╝╝┴┐ż“Š═śIšh├„╗ßż╬ū∙šä╗ßżŪų▒ĮėęŖśOżßżķżņżļ
* Į½└┤ż╬ęŖ▐zż▀╔ńåTż╦īØżĘżŲŪ¾╚╦Ūķł¾ż“š╣ķ_żŪżŁżļ
https://diveintocode.jp/recruiting_partner
įö╝ÜżŽĪó cs@diveintocode.jp ż▐żŪż¬Ü▌▌Xż╦ż¬å¢żż║Žż’ż╗ż»ż└żĄżżĪŻInvestigaci©«n I - Tercera Nota
Investigaci©«n I - Tercera NotaSALONVIRTUAL
?
The document appears to be performance data for multiple students over an academic period consisting of 12 grading periods. It includes a student code, their scores on a 1-5 scale for each period, and their final definitive grade. Most students received all 1s for each period and a final grade between 2.5-5, though some had lower individual period scores and final grades between 0.4-3.3.Descriptive adj. and present perfect
Descriptive adj. and present perfectLuz
?
Here are the sentences with the present perfect:
I have seen El Diario del Otun.
She has read the book.
It has been done.
We have already eaten.
Have you ever seen that movie?
Have they drunk the soda yet?
Have you read the book yet?
Has she gone to your house yet?
I haven't done my homework.Present perfect
Present perfectLuz
?
The document discusses the use of the present perfect tense in English. It is used to describe events that began in the past and continue in the present or events that happened at an unspecified time before now. Examples are provided to illustrate how the present perfect is used to talk about experiences, changes over time, accomplishments, uncompleted actions, and actions that occurred multiple times. Time expressions that can be used with the present perfect are also discussed.How To Write An Essay
How To Write An EssayLuz
?
This document provides instructions for writing an essay, including choosing a topic, outlining, drafting, revising, and finalizing the essay. It recommends that essays be 4-5 paragraphs long with 5-7 lines per paragraph. The topic should be something the writer enjoys and has researched. Brainstorming ideas related to the topic is suggested. The essay should include an introduction, body paragraphs with evidence and analysis, and a conclusion. Writers are advised to write continuously within paragraphs, read drafts aloud, and proofread the final draft before submission.Sentence Connectors
Sentence ConnectorsLuz
?
The document discusses various sentence connectors that can be used to link clauses and show different logical relationships between ideas. It provides examples of connectors that show addition, opposition, cause and effect, comparison, and contrast. It also includes a practice section with examples of correctly and incorrectly using connectors.How to write an Essay: Stuff you wished your teacher told you! By Jeni Mawter
How to write an Essay: Stuff you wished your teacher told you! By Jeni MawterJeni Mawter
?
You start writing an essay with the introduction. Right? Wrong! Never start your essay by writing the introduction first. Confused? In How to Write an Essay, Jeni Mawter shares years of teaching experience to de-mystify and simplify the essay-writing process. In conclusion ... Anyone can write an essay!How to write a literary analysis essay
How to write a literary analysis essayJenna Bates
?
This presentation is directed toward AP English students who need to know how to write a literary analysis.More Related Content
What's hot (16)
?????????
?????????Pawat' Kratai
?
The document discusses population and economic statistics for Thailand from 2554 to 2559. It notes that the total population grew from 69.5 million in 2554 to 69.8 million in 2559, with the working age population declining slightly and the elderly population increasing substantially. Economic indicators such as GDP, exports, and imports all saw steady growth from 2554 to 2559.[????20????] 2017 ?? ???? ??? ??? ?? (????? 2017-11)
[????20????] 2017 ?? ???? ??? ??? ?? (????? 2017-11)20slab(????20????)
?
This document appears to contain a series of numbers organized into rows and columns. The first column contains numbers from 1 to 5, while the remaining columns contain decimal numbers ranging from approximately 10 to 80. There are no labels or context provided to explain the meaning or purpose of the data.Corega wireless camera instruction manual
Corega wireless camera instruction manualcristeaflorin2000
?
The document is divided into 4 parts. Part 1 discusses topic A. Part 2 discusses topic B. Part 3 provides details on topic C over several paragraphs. Part 4 concludes by wrapping up topics D and E.?????????????
?????????????kitsanan
?
This document outlines a 3 step process for some task. Step 1 involves identifying 3 subsections, with the first outlining an intro, the second detailing specific requirements, and the third providing guidelines. Step 2 describes completing a necessary form. Step 3 states the completed form must be submitted by a given deadline in order to be considered.??????
??????Areeya Onnom
?
The document outlines a multi-section structure, with the first section containing three subsections assigning numeric ranges. The second section has two subsections, one referencing a number and the other containing a list. The third section includes several numbered subsections assigning values and referencing additional numbers. Performance is scaled into letter grades ranges in a later section.??????
??????Areeya Onnom
?
The document outlines a multi-section structure, with the first section containing three subsections ranging from 1-3 or 4-6 items each. The second section has two subsections, one listing three items and another containing a single item. The third section includes several numbered subsections addressing different topics, with some containing ranges or specific numbers. The fourth section discusses allocating a total of 100 across five subsections in increments of 20. The fifth section provides a grading scale ranging from 60 to 100.Daily agri news letter 01 aug 2013
Daily agri news letter 01 aug 2013Rakhi Tips Provider
?
The trend in NCDEX coriander futures for August delivery is negative; however, further short covering is expected at current levels.ParitaBhuva_14.4
ParitaBhuva_14.4parita98
?
This document provides weather forecasts and radar images for Matthews, North Carolina from multiple weather websites. It credits weather.com, wunderground.com and accuweather.com for forecasts and images showing that Matthews will be rain free.Daily agri news letter 31 july 2013
Daily agri news letter 31 july 2013Rakhi Tips Provider
?
NCDEX soybean and soy oil futures closed up on Tuesday, with soybean rising 3.1% and soy oil gaining 1.2%. NCDEX castor seed also rose 1.1%. However, guar seed and guar gum fell more than 2%. Technical indicators suggest turmeric, chana, and castor seed futures may trade negatively, while jeera could trade positively. Overall market fundamentals for soybean and soy oil appear negative despite recent price increases driven by short covering.MCSA Course Completion Certificates
MCSA Course Completion CertificatesWes Anderson
?
The document outlines details of three Microsoft courses taken by James SampleNameHere on updating skills from older Exchange Server versions to Exchange Server 2010. The courses included Installing and Configuring Windows Server 2012 with Wes Anderson on June 5, 2015, Administering Windows Server 2012 with Wes Anderson on June 12, 2015, and Configuring Advanced Windows Server 2012 Services with Jim Garrett on June 19, 2015.Def
Defslimgalli
?
This document contains quarterly data showing consumer price index values from 2001 to 2010. It shows that prices generally increased each year, with higher increases in later years. The largest price increases occurred in 2008, with a rise of over 20% in the first quarter of 2008 compared to the same period in 2007.Nps list
Nps listJalaj Jain
?
This table shows gross and net non-performing assets (NPAs) of scheduled commercial banks in India from 2006-07 to 2017-18. It breaks down the data into different bank groups - public sector banks, old private sector banks, new private sector banks, and foreign banks in India. The key figures reported are gross NPAs as a percentage of total advances, net NPAs as a percentage of total assets, and gross and net NPAs for each bank group over this time period. NPAs for all bank groups have generally been increasing over the years according to the data in the table.City hall final
City hall finalChristine Emad Youssef , Assoc. AIA
?
The document appears to contain lighting design information for a site plan, including fixture locations, light levels, and fixture specifications. It lists the average, maximum, and minimum light levels calculated for zone #2 as 1.5 fc, 6.5 fc, and 0.3 fc respectively. It also provides notes on fixture heights around the site from 8-25 feet and wattages used, with 400W fixtures in the middle and 50W architectural lights around the parking lot.????????????????????? ???
????????????????????? ???????????? ???????????
?
The document contains numerical data such as percentages, numbers, and dates that describe statistical information related to surveys, sample sizes, percentages of responses, and results. Key figures include percentages ranging from 3% to 8-9%, sample sizes of 24-2540, and results within the ranges of 50-70% and 60-85% for unspecified categories.Š═┬Üšh├„╗ß 181127 ųĻ╩Į╗ß╔ńź╚źĻźš?źļźóźżź╣?.pdf
Š═┬Üšh├„╗ß 181127 ųĻ╩Į╗ß╔ńź╚źĻźš?źļźóźżź╣?.pdfDIVE INTO CODE Corp.
?
ź╚źĻźūźļźóźżź║żŪżŽĪóĪĖTechnology FirstŻĪĪ╣ż“║Žčį╚~ż╦Īó│Żż╦ą┬żĘżż╝╝ągżõĪóą┬żĘżżźĄ®`źėź╣蹊┐ż╬ź┴źŃźņź¾źĖż“╔ńåTż╬ż▀ż╩żĄż¾ż╚╣▓ż╦īg╝∙żĘżŲżżż▐ż╣ĪŻ
żŌż┴żĒż¾Īó¤o└ĒļyŅ}ż“żżżŁż╩żĻż¬ŅŖżżż╣żļż│ż╚żŽżóżĻż▐ż╗ż¾ż¼ĪóĪĖź┴źŃźņź¾źĖżĘż┐żżŻĪĪ╣ż╚żżż”Ü▌│ųż┴ż“┤¾Ūąż╦żĘĪóżŪżŁżļŽ▐żĻŽŻ═¹ż╦čžż”│╔ķLźūźĒźĖź¦ź»ź╚ŁhŠ│żžż╬┼õ╩¶ż¼ź┴źŃźņź¾źĖŠ½╔±ż“ė²ż▀ż▐ż╣ĪŻ
https://www.3-ize.jp/recruit/
DIVE INTO CODE żŪżŽĪóźĻź»źļ®`źŲźŻź¾ź░źč®`ź╚ź╩®`ż“─╝╝»żĘżŲżżż▐ż╣ŻĪ
▓╬╗Ł┴ŽĮŻ║¤o┴Ž
▓╬╗ŁźßźĻź├ź╚
* ╝s720?1,000Ģrķgż╚60?100═“āęż“ūį╝║═Č┘YżĘż┐ęŌė¹ż╬Ė▀żżź©ź¾źĖź╦źó║“ča╔·ż“Ʊė├żŪżŁżļ
* Ʊė├║“čaš▀ż╬ź╗ź¾ź╣żõ▓┼─▄Īó╝╝┴┐ż“Š═śIšh├„╗ßż╬ū∙šä╗ßżŪų▒ĮėęŖśOżßżķżņżļ
* Į½└┤ż╬ęŖ▐zż▀╔ńåTż╦īØżĘżŲŪ¾╚╦Ūķł¾ż“š╣ķ_żŪżŁżļ
https://diveintocode.jp/recruiting_partner
įö╝ÜżŽĪó cs@diveintocode.jp ż▐żŪż¬Ü▌▌Xż╦ż¬å¢żż║Žż’ż╗ż»ż└żĄżżĪŻInvestigaci©«n I - Tercera Nota
Investigaci©«n I - Tercera NotaSALONVIRTUAL
?
The document appears to be performance data for multiple students over an academic period consisting of 12 grading periods. It includes a student code, their scores on a 1-5 scale for each period, and their final definitive grade. Most students received all 1s for each period and a final grade between 2.5-5, though some had lower individual period scores and final grades between 0.4-3.3.Viewers also liked (7)
Descriptive adj. and present perfect
Descriptive adj. and present perfectLuz
?
Here are the sentences with the present perfect:
I have seen El Diario del Otun.
She has read the book.
It has been done.
We have already eaten.
Have you ever seen that movie?
Have they drunk the soda yet?
Have you read the book yet?
Has she gone to your house yet?
I haven't done my homework.Present perfect
Present perfectLuz
?
The document discusses the use of the present perfect tense in English. It is used to describe events that began in the past and continue in the present or events that happened at an unspecified time before now. Examples are provided to illustrate how the present perfect is used to talk about experiences, changes over time, accomplishments, uncompleted actions, and actions that occurred multiple times. Time expressions that can be used with the present perfect are also discussed.How To Write An Essay
How To Write An EssayLuz
?
This document provides instructions for writing an essay, including choosing a topic, outlining, drafting, revising, and finalizing the essay. It recommends that essays be 4-5 paragraphs long with 5-7 lines per paragraph. The topic should be something the writer enjoys and has researched. Brainstorming ideas related to the topic is suggested. The essay should include an introduction, body paragraphs with evidence and analysis, and a conclusion. Writers are advised to write continuously within paragraphs, read drafts aloud, and proofread the final draft before submission.Sentence Connectors
Sentence ConnectorsLuz
?
The document discusses various sentence connectors that can be used to link clauses and show different logical relationships between ideas. It provides examples of connectors that show addition, opposition, cause and effect, comparison, and contrast. It also includes a practice section with examples of correctly and incorrectly using connectors.How to write an Essay: Stuff you wished your teacher told you! By Jeni Mawter
How to write an Essay: Stuff you wished your teacher told you! By Jeni MawterJeni Mawter
?
You start writing an essay with the introduction. Right? Wrong! Never start your essay by writing the introduction first. Confused? In How to Write an Essay, Jeni Mawter shares years of teaching experience to de-mystify and simplify the essay-writing process. In conclusion ... Anyone can write an essay!How to write a literary analysis essay
How to write a literary analysis essayJenna Bates
?
This presentation is directed toward AP English students who need to know how to write a literary analysis.How to write an essay introduction presentation
How to write an essay introduction presentationlnorris
?
This document provides instruction on writing the introduction to an essay, including defining the purpose and components of an introduction. It explains that an introduction should use a grabber sentence to engage the reader, transitional sentences to connect to the thesis statement, and conclude with a clear thesis statement that presents the main argument of the essay. Tips are provided for writing effective grabber sentences, transitions, and thesis statements.Similar to Final grades 6 08 codes only (20)
Final grades 2 11 codes only
Final grades 2 11 codes onlyLuz
?
The document shows the grades of 15 students in 5 subjects (R, W, L, S, R) out of 100. It also shows the grades of the students in 3 other subjects (W, L, S) out of 10. The total grades of each student out of 500 is mentioned in the last column.The use of waveform cross correlation for creation of an accurate catalogue o...
The use of waveform cross correlation for creation of an accurate catalogue o...Ivan Kitov
?
Page 3
In the current study of mining activity within the Russian platform, we use the advantages of location and historical bulletins/catalogues of mining explosions recorded by small-aperture seismic array Mikhnevo (MHVAR). The Institute of Geospheres Dynamics (IDG) of the Russian Academy of Sciences runs seismic array MHVAR (54.950N; 37.767E) since 2004.
Small-aperture seismic array Ī░MikhnevoĪ▒ includes ten vertical stations (solid triangles), with one station in the geometrical centre of the array (C00) and other nine stations distributed over three circles with radii of 130 m, 320 m, and 600 m. The array aperture in approximately 1.1 km. Two 3C stations (solid triangles in circles) were added to the outer circle in order to improve the overall stations sensitivity (detection threshold) and resolution. All stations are equipped with short-period seismometers SM3-KV, which are characterized by flat response between 0.8 Hz and 30 Hz and gain of 180,000 [Vs/m]. Later, a 3C broad band station (BB) was installed in the centre of the array for surface wave measurements. The array response function (only for 12 vertical channels) is similar to that for many small-aperture arrays. Such arrays are designed to measure high-frequency signals from regional and near-regional sources with magnitudes above 1.5-2.0.
Page 4
MHVAR detects regional seismic phases (Pn, Sn, Lg, Rg) from various sources. Figure shows some selected waveforms with source-station distance decreasing up-down. Correspondingly the length of records decreases ©C for the closest mines itĪ»s harder to distinguish between P and S phases.
Page 5
More than 50 areas at regional and near regional distances with different levels of mining activity have been identified by MHVAR. Since 2004, thousands of events have been reported in the IDG seismic catalogue as mining explosions. The IDG publishes this mining event catalogue as a part of the annual issues of Ī░Earthquakes in RussiaĪ▒, which is available for the broader geophysical community. The map shows several selected mines at near-regional distances where MHVAR successfully detects events with magnitudes 1.0 and lower. We also show a few selected mines at regional distances with the largest events of magnitude (ML) 2.0 and above. Such events should be also detected by IMS arrays. Joint interpretation of signals detected by MHVAR and IMS arrays allows significant improvements in signal detection, location, characterization and identification of events in the IDG catalogue when the historical data are revisited. The work on joint analysis of the IDG and IMS data is possible under the Ī░Contract for limited access to IMS data and IDC productsĪ▒ between the CTBTO and IDG, which allows obtaining data through 2011.
To begin with, we have chosen blasts with larger magnitudes from well-known ironstone mine Mikhailovskiy (red circle), which is situated at regional distances somewhere between MHVAR (~330 km) and IMS array AKASGSt st pipe_pressure_rating_charts_rev_sep_2010
St st pipe_pressure_rating_charts_rev_sep_2010setyopermadi
?
This document provides allowable working pressure tables for stainless steel grade 304 seamless pipes according to ASTM A 312. It lists the design strength and allowable working pressures in megapascals at different temperatures for various pipe sizes and schedules. Notes are provided regarding the calculation method, applicability to piping classes, and additional factors that must be considered for welded pipes. Conversion factors are also listed to convert pressures to other common units.???????????????????.3 5 ??53
???????????????????.3 5 ??53Aj Yawwalak
?
This document appears to contain statistical data organized into rows and columns. There are 54 rows of data with columns for: numbers, names, ratings, numbers, and percentages. The data includes averages, maximums and minimums. It seems to be assessing multiple criteria across 54 subjects or items and compiling the results.Talleres lectoescritura mayo 7
Talleres lectoescritura mayo 7Oscar L©«pez Comunicaciones - OL.COM
?
This document appears to be a table containing the grades and scores of 103 students on various grammar workshops and exercises. It lists the student ID numbers along with their scores on different components of the workshops including connectors, deixis, corrections, inferences, and more. The scores range from 0 to 5.Ė╗░Ņ═ČŅÖ蹊┐▓┐║╦ą─│ų╣╔2011─Ļų│└¹┬╩ 02.17.2012
Ė╗░Ņ═ČŅÖ蹊┐▓┐║╦ą─│ų╣╔2011─Ļų│└¹┬╩ 02.17.2012yo9889
?
This document appears to be a table containing stock market data and performance metrics for various companies. It includes company codes, share prices, earnings per share, earnings growth rates, price to earnings ratios and other financial indicators. The table contains over 100 rows of stock data.[????20????] 2017 20? ???/???? ?? ?? ?? ? ??? ?? (????? 2017-12)![[????20????] 2017 20? ???/???? ?? ?? ?? ? ??? ?? (????? 2017-12)](https://cdn.slidesharecdn.com/ss_thumbnails/2017-1220-171025000950-thumbnail.jpg?width=560&fit=bounds)
[????20????] 2017 20? ???/???? ?? ?? ?? ? ??? ?? (????? 2017-12)20slab(????20????)
?
This document contains various percentages organized into sections. The percentages range from under 1% to over 70% across different categories. There are no labels or explanations for the percentages provided, so the overall topic or meaning of the data cannot be determined from the document alone.The Science and Practice of Cartographic Interaction
The Science and Practice of Cartographic Interactionreroth
?
The document contains survey results from participants responding to questions in different categories. It includes a table with the sum and average scores for each question category (e.g. EMG, ENV, EPI) and total scores. Some categories like "How" received the highest total scores, while categories like "Who" and "Where" received lower total scores on average. The data provides an overview of participant responses to different types of questions in a survey.??????.3 ??53 3 4
??????.3 ??53 3 4Aj Yawwalak
?
The document appears to contain data with 54 entries. Each entry has 13 columns of numeric data, including averages and minimum/maximum values. The data seems to be metrics or measurements for 54 different subjects. Overall, the document presents quantitative information in a tabular format.Dificulty Level
Dificulty LevelAbhishek Joshi
?
The document provides guidelines for scoring the difficulty of double dutch jumping routines for both individual masters and teams. It assigns point values from 0.0 to 10.0 based on the number and difficulty of skills performed, with higher scores indicating more advanced routines requiring a greater number of increasingly difficult skills.Dr. azad hama sharif
Dr. azad hama sharifgasha technical institute
?
This document contains a student's grades for 10 assignments in different subjects. It shows the grade each student received for each assignment, as well as their average grade. There are 59 students listed with their grades for 10 assignments and their overall average. The averages range from 0.2 to 4.95 out of 10.11
11Daham Hettiarachchi, CFA
?
This document provides selected labour force indicators for Sri Lanka excluding the Northern and Eastern provinces from 2003 to the second quarter of 2011. It shows statistics on the labour force participation rate by sex and residential sector as well as the unemployment rate by sex, age group, and educational level. It also gives data on the employed population by sex and industry and the number of hours worked per week. The statistics demonstrate trends in the Sri Lankan labour force over this period, such as higher participation rates for males compared to females and higher unemployment among youth and those with higher education.Statistics.docx
Statistics.docxAkmal Shahzad Butt
?
The document provides summary statistics for 5 variables (v1-v5) measured in 200-201 observations. For each variable, it reports the number of valid and missing cases, measures of central tendency (mean, median, mode), dispersion (standard deviation, variance, range), and position (percentiles). Frequency tables display the count for each unique value in v1-v5. Stem-and-leaf plots further summarize the distribution of scores for each variable.mansoane
mansoaneOndrill.ro
?
The document provides specifications for aluminum cable clamps used for steel cable. It lists the material as aluminum and notes the standard as EN 13411-3 formerly DIN 3093 A. Dimensions, weights, and other technical details are provided for clamps of various diameters from 1mm to 60mm in a table.??????.3 ??53 3 5
??????.3 ??53 3 5Aj Yawwalak
?
The document appears to be statistical data containing 54 entries of multiple numeric values. It includes the maximum, minimum, and average values for each column. The data seems to be measuring some variables across 54 subjects and calculating total, mean and ranking scores.RB 832.pdf
RB 832.pdfAnupChand4
?
The document shows freight loading, earnings, and performance data for various divisions of a railway over the current and last year. Loading was up 2.89-5.68% across divisions from last year. Earnings increased 4.5-5.77% except for DLI which fell -7.71%. Overall loading and earnings were down -11.54% and -18.32% respectively. On a monthly and yearly basis, most divisions also saw decreases in earnings of -2.2% to -56.8% compared to last year. Total monthly earnings fell -28.74% and yearly earnings decreased -22.61%Progress and S curve
Progress and S curveSohail Jamal
?
The document presents production data for the Abu Dhabi National Oil Company Al Mansouri 3B project across 55 weekly periods. It includes baseline production levels achieved and early and late planned production levels. Overall, actual production levels tracked closely to the early planned levels through week 38 before exceeding both planned levels for the remainder of the periods shown.???????????????????.3 4 ??53
???????????????????.3 4 ??53Rhentaa Banton
?
1. The document appears to contain statistical data on 54 subjects. It includes each subject's scores on 7 criteria measured from 2-7.
2. The maximum, minimum, and average scores are reported at the bottom for each criteria and total. Subjects' total scores range from 6 to 39.8 with an average of 30.83.
3. The data is organized into a table with rows for each subject and columns for each measured criteria and total/average scores.Calificaciones 70% todas
Calificaciones 70% todasUniversidad del Cauca
?
La siguiente tabla muestra las calificaciones de los estudiantes matriculados en la unidad tem©ótica HIstoria de las Ciencias.
Universidad del Cauca.
Programa Lic. en Educaci©«n B©ósica.
Per©¬odo: I de 2011.
Fecha de publicaci©«n: enero 30 de 2012
[????20????] 2030?? ??? ????? ?? ?? ?? report (????? 2017-02)![[????20????] 2030?? ??? ????? ?? ?? ?? report (????? 2017-02)](https://cdn.slidesharecdn.com/ss_thumbnails/2030report-170726010014-thumbnail.jpg?width=560&fit=bounds)
[????20????] 2030?? ??? ????? ?? ?? ?? report (????? 2017-02)20slab(????20????)
?
This document appears to contain survey results from multiple choice questions with percentages listed for each answer choice. Some of the key findings include:
- 48.3% of respondents chose the first answer for question 1, and 34.7% chose the second answer.
- For question 3, the most popular answer was the third choice at 19.6% and the least was the sixth at 8.1%.
- The first answer was ranked first for questions 5 and 6, second for question 7, and third for question 8.
- For question 11, the most popular answer was the third choice at 24.7% and the least was the fifth at 9.8%.Recently uploaded (20)
best iptv services of 2025 real reviews real choices (dezor iptv)
best iptv services of 2025 real reviews real choices (dezor iptv)chris move
?
Finding the best IPTV services can feel like navigating a maze. With countless options popping up, making a smart choice becomes crucial. This article dives into the landscape of best IPTV 2025, providing insights based on real reviews and user experiences. We're exploring what makes a top IPTV service provider stand out, focusing on factors like reliability, content variety, and user-friendliness.Prime Biome USA Store Experiances and Where to Buy.docx
Prime Biome USA Store Experiances and Where to Buy.docxayazzaidan484
?
Prime Biome is a large geographical area characterized by specific climate conditions, plants, animals, and other organisms. These ecosystems are often categorized into distinct types, such as forests, deserts, grasslands, tundras, and aquatic environments. Among these, the term "prime biome" is often used to describe the most prominent and biologically diverse ecosystems on Earth, which play a crucial role in sustaining life. In this article, we will explore the concept of prime biomes and delve into some of the most extraordinary examples found around the globe.
Experience Luxury at Cloud 22 ©C DubaiĪ»s Sky-High Oasis
Experience Luxury at Cloud 22 ©C DubaiĪ»s Sky-High OasisCaptain Dunes
?
Soak in breathtaking views at Cloud 22, DubaiĪ»s exclusive rooftop paradise. Enjoy infinity pools, luxury lounges, and a world-class ambiance in the heart of the city.Best IPTV Services Provider ©C Top Choice for 4k Streaming
Best IPTV Services Provider ©C Top Choice for 4k Streamingdorothymcalister2
?
Key Features of IPTV Subscription:
Live TV Streaming: Watch live broadcasts of news, sports, or entertainment channels.
Video on Demand (VOD): Access a library of movies and TV shows to watch whenever you want.
Time-Shifted Content: Pause, rewind, or watch previously aired shows (Catch-Up TV).
High-Quality Streaming: Often includes HD or 4K resolution options, depending on the provider and your internet connection.
Device Compatibility: Works on a range of devices, including Smart TVs, streaming boxes (like Roku or Amazon Fire Stick), and mobile devices.
Convert Videos to MP3 with the Best Music Player for Android
Convert Videos to MP3 with the Best Music Player for AndroidRocks Music Player
?
Looking for the Best MP3 player with a powerful Video to MP3 converter? The Rocks Music Player is the ultimate solution for music lovers. This app not only delivers high-quality audio playback but also comes with a built-in MP4 to MP3 Player that allows you to extract audio from videos effortlessly.Wendy Williams Net Worth_ A Rollercoaster Ride Through Talk Show Fame and For...
Wendy Williams Net Worth_ A Rollercoaster Ride Through Talk Show Fame and For...voice ofarticle
?
Wendy Williams. That name alone conjures up a whirlwind of images: the iconic "Hot Topics" segment, the candid interviews, and, let's be real, the sheer, unapologetic realness that made her a daytime television staple. But behind the glitz and glamour, there's a story of hard work, resilience, and, of course, the ever-fluctuating "Wendy williams net worth." It's a tale that's as captivating and unpredictable as Wendy herself. We're not just talking about cold, hard numbers here. We're talking about the journey, the highs and lows, and the sheer grit it took to build an empire.
From Firework to Spacewalk: The Truth Behind Katy PerryĪ»s Extraterrestrial Ru...
From Firework to Spacewalk: The Truth Behind Katy PerryĪ»s Extraterrestrial Ru...mohammadasim74
?
Katy PerryĪ»s Cosmic Secret: Is PopĪ»s Superstar Really Heading to the Stars?"
Uncover the rumors, plans, and possibilities behind her potential space-bound journey.
The 2025 Nick Awards for EMSB Head Office Staff
The 2025 Nick Awards for EMSB Head Office Staffmikecohencsl
?
Here is the presentation of the Nick Awards, our EMSB spoof on the Oscars.


5 Best IPTV Services February 2025 (New List with Poll)
5 Best IPTV Services February 2025 (New List with Poll)dorothymcalister2
?
Choosing the Best IPTV Service Provider in 2025
With countless IPTV providers available, itĪ»s essential to consider factors like content variety, streaming quality, customer support, and pricing before making a decision. Look for services with stable servers, anti-freezing technology, 24/7 customer support, and a user-friendly interface to enhance your viewing experience.
What is IPTV?
IPTV (Internet Protocol Television) is a digital streaming service that delivers television content over the internet rather than through traditional cable or satellite. IPTV offers greater flexibility, a wider content selection, and often better video quality compared to conventional broadcasting methods.
Why Choose a High-Quality IPTV Service?
Selecting the best IPTV provider ensures a seamless and enjoyable viewing experience. Some key benefits include:
High-Resolution Streaming ©C Enjoy content in 4K Ultra HD, Full HD, or HD quality for a superior viewing experience.
Reliable Performance ©C A good IPTV service minimizes buffering, lag, and downtime.
Extensive Content Library ©C Access live TV channels, sports events, movies, TV shows, and on-demand content.
Multi-Device Compatibility ©C Stream on smart TVs, Android/iOS devices, Firestick, Roku, and more.
Premium Features ©C Some IPTV services offer DVR functionality, multi-screen viewing, and electronic program guides (EPG).
Casey DeSantis_ Future of Florida Politics & 2026 Governor Run.docx
Casey DeSantis_ Future of Florida Politics & 2026 Governor Run.docxvoice ofarticle
?
As Governor Ron DeSantis nears the conclusion of his second term, FloridaĪ»s political environment is undergoing significant shifts, with speculation mounting around Casey DeSantis potentially entering the gubernatorial race. The Republican primary is already shaping up to be a competitive race, with key contenders such as Rep. Byron Donalds, Miami Mayor Francis Suarez, and Agriculture Commissioner Wilton Simpson emerging as strong candidates. Meanwhile, Democrats are also gearing up for the battle, with potential candidates like State Senator Shevrin Jones and State House Minority Leader poised to challenge Republican dominance in the state. Casey DeSantis' political visibility, policy-driven initiatives, and public support place her in a unique position, setting the stage for a compelling contest.
Visit Here: https://voiceofarticle.com/casey-desantis/
Custom Sign Pictures Taken for TikTok Followers
Custom Sign Pictures Taken for TikTok Followersshawn031576
?
Just a few of the more than 150 custom sign pictures I've taken at the request of TikTok followers in recent weeks.PERFORMANCE TASK NsssssssssssssssssssssssssssssssssssO. 1 QUARTER 2.pptx
PERFORMANCE TASK NsssssssssssssssssssssssssssssssssssO. 1 QUARTER 2.pptxMageValenzuelaDeCast
?
performance task Information of a Music Composer.... By PW.
Information of a Music Composer.... By PW.snehsoham
?
Hi Everyone, This is Palash Wani. I have tried to make a Power Point Presentation about Alan Walker which is just for entertainment where people can know about him. I hope all the people would see my presentation. Thanks.
Final grades 6 08 codes only
- 1. STUDENT'S CODE R-15% W-15% L-15% S-15% R-10% 92021553478 4.5 3.8 4.0 3.7 3.1 1053769909 3.8 3.9 4.5 4.5 2.4 92030860839 5.0 3.6 4.2 3.7 2.2 1088267846 5.0 4.0 3.9 3.5 2.2 1116130694 5.0 4.0 4.1 4.2 4.2 1088288704 3.8 3.4 1.0 3.9 2.8 92051302372 4.5 4.2 2.5 3.8 4.1 93090314309 2.5 2.9 4.2 3.9 3.1 91042320434 4.5 3.6 4.3 3.5 2.6 1088295983 2.5 4.1 0.0 4.0 0.0 91051021563 3.8 3.8 4.6 4.0 3.6 1088239456 5.0 1.7 2.5 3.7 3.6 1053798788 4.5 3.5 4.4 3.9 3.9 1088266632 5.0 3.9 4.3 3.8 2.8 42030045 5.0 3.1 3.7 1.0 2.2 1088252864 3.8 3.4 3.4 3.7 2.8 1088007286 3.8 3.7 4.2 4.0 3.1
- 2. W-10% L-10% S-10% TOTAL 2.9 3.0 3.4 3.6 1.9 4.5 4.0 3.8 2.0 4.5 3.2 3.7 1.9 2.9 3.6 3.5 2.9 4.0 4.1 4.1 2.3 3.5 4.1 3.1 3.8 4.0 3.9 3.8 3.8 4.5 3.9 3.6 2.2 2.7 3.3 3.5 0.0 0.0 0.0 1.6 2.5 4.5 4.0 3.9 1.8 3.5 4.1 3.2 2.6 4.0 3.5 3.8 2.2 2.9 3.3 3.7 1.3 2.7 3.2 2.9 1.7 3.5 3.6 3.3 2.2 4.0 3.9 3.7