
Finanical Statement
- 2. Introduction • Sapid Sweets is a privately owned company that was purchased in 1975 • The Company has a limited number of shareholders which is owned majority by Simone and Joseph • The company has decided to introduce a new line of energy bars and therefore a new plant and equipment needs to be purchased
- 3. Strengths – Financial Statement and Analysis • One of the highest points of our year was our income after Taxes in which we had $65,386 which has grown from lasts years $56,155 $65,386 - $56,155 = increase of $9231 • However with the rest of our finances down from last year the energy bar would greatly improve our numbers. • One of the biggest changes we saw was the improvement of our Gross Margin, last year it was $263,857 and this year it was $325,592. $325,595 - $263,857 = Increase of $88,738 • Our operating income also increased as last year it was $100,847 and this year it is $116,233 $116,233 - $100,847 = $15,386
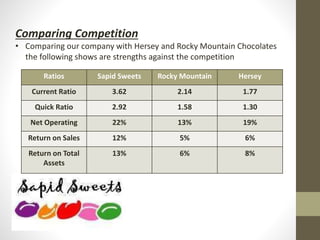
- 4. Comparing Competition • Comparing our company with Hersey and Rocky Mountain Chocolates the following shows are strengths against the competition Ratios Sapid Sweets Rocky Mountain Hersey Current Ratio 3.62 2.14 1.77 Quick Ratio 2.92 1.58 1.30 Net Operating 22% 13% 19% Return on Sales 12% 5% 6% Return on Total Assets 13% 6% 8%
- 5. Projected Results • With our newest energy bar on the market our payback period would be 5.8 years and our return on this investment would be 19% • If we wanted to break even based on units, we would need to sell 171,429 • If we wanted to break even by Revenue we would need to make over $600,000 • If we sold 1,900,000 Units , our total cost would be $1,962,500 however our revenue would be $3,325,000 which would give us a difference of $1,362,500
- 6. Conclusion • Our current Z Score is 2.74 which is in the Grey Zone. • We would be getting back 19% on this investment • With out current Ratio being 3.62 we are currently ahead of Hersey's and Rocky Mountain Chocolate, with the introduction of our new energy bar are current ratio could increase even more • With our Gross Margin increased this year, we can expect it to increase even more at the end of next year