


More Related Content
Similar to FINDING FOR THE SLOPE OF A LINE .ppt (20)
Recently uploaded (20)


FINDING FOR THE SLOPE OF A LINE .ppt
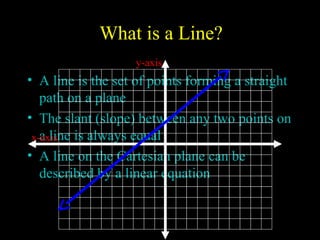
- 1. What is a Line? ŌĆó A line is the set of points forming a straight path on a plane ŌĆó The slant (slope) between any two points on a line is always equal ŌĆó A line on the Cartesian plane can be described by a linear equation x-axis y-axis
- 2. Definition - Linear Equation ŌĆó Any equation that can be put into the form Ax + By ’ĆŁ C = 0, where A, B, and C are Integers and A and B are not both 0, is called a linear equation in two variables. ŌĆó The graph will be a straight line. ŌĆó The form Ax + By ’ĆŁ C = 0 is called general form (Integer coefficients all on one side = 0)
- 3. Slope Slope describes the direction of a line.
- 4. Slope (m) ŌĆó It is describes the steepness of the line. It is also the ratio of rise to run. 1 2 1 2 x x y y x in change y in change run rise slope ’ĆŁ ’ĆŁ ’ĆĮ ’ĆĮ ’ĆĮ
- 5. Example 1: Calculate the slope between (-3, 6) and (5, 2) 1 2 1 2 x x y y m ’ĆŁ ’ĆŁ ’ĆĮ ) 3 - ( ) 5 ( ) 6 ( ) 2 ( ’ĆŁ ’ĆŁ ’ĆĮ m 8 4 - ’ĆĮ 2 1 - ’ĆĮ x1 y1 x2 y2 We use the letter m to represent slope m
- 6. x-axis y-axis Find the slope between (-3, 6) and (5, 2) Rise Run -4 8 -1 2 = = (-3, 6) (5, 2) m =
- 7. From this result, we can see that... ŌĆóIf the line falls to the right, the slope is negative.
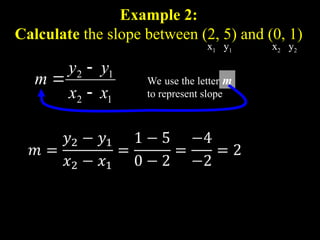
- 8. Example 2: Calculate the slope between (2, 5) and (0, 1) 1 2 1 2 x x y y m ’ĆŁ ’ĆŁ ’ĆĮ x1 y1 x2 y2 We use the letter m to represent slope m
- 9. x-axis y-axis Find the slope between (2, 5) and (0, 1) Rise Run -4 -2 2 = = (2, 5) (0, 1) m =
- 10. From this result, we can see that... ŌĆóIf the line falls to the left, the slope is positive.
- 11. Example 3: Find the slope between (5, 4) and (5, 2). 1 2 1 2 x x y y m ’ĆŁ ’ĆŁ ’ĆĮ ) 5 ( ) 5 ( ) 4 ( ) 2 ( ’ĆŁ ’ĆŁ ’ĆĮ m 0 2 - ’ĆĮ STOP This slope is undefined. x1 y1 x2 y2
- 12. x y Find the slope between (5, 4) and (5, 2). Rise Run -2 0 Undefined = =
- 13. Example 4: Find the slope between (5, 4) and (-3, 4). 1 2 1 2 x x y y m ’ĆŁ ’ĆŁ ’ĆĮ ) 5 ( ) 3 - ( ) 4 ( ) 4 ( ’ĆŁ ’ĆŁ ’ĆĮ m 8 - 0 ’ĆĮ This slope is zero. x1 y1 x2 y2 0 ’ĆĮ
- 14. x y Rise Run 0 -8 Zero = = Find the slope between (5, 4) and (-3, 4).
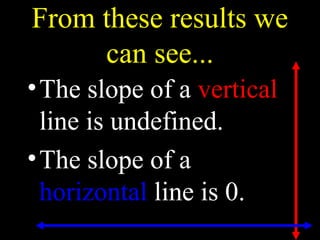
- 15. From these results we can see... ŌĆóThe slope of a vertical line is undefined. ŌĆóThe slope of a horizontal line is 0.
- 16. Find the Slopes (5, -2) (11, 2) (3, 9) 1 2 1 2 x x y y m ’ĆŁ ’ĆŁ ’ĆĮ 3 11 9 2 1 ’ĆŁ ’ĆŁ ’ĆĮ m Yellow 5 11 ) 2 - ( 2 2 ’ĆŁ ’ĆŁ ’ĆĮ m Blue 3 5 9 2 - 3 ’ĆŁ ’ĆŁ ’ĆĮ m Red 8 7 - ’ĆĮ 3 2 ’ĆĮ 2 11 - ’ĆĮ
- 17. Sign of the Slope Which have a positive slope? Green Blue Which have a negative slope? Red Light Blue White Undefined Zero Slope
- 18. Summary ŌĆó Vertical line ŌĆō Slope is undefined ŌĆō x-intercept is (x, 0) ŌĆō no y-intercept ŌĆó Horizontal line ŌĆō Slope is 0. ŌĆō y-intercept is (0, y) ŌĆō no x-intercept