1) This study examines changes in land cover reflectance over 5 years in an Arctic tundra landscape undergoing a large-scale hydrological manipulation experiment. 2) The experiment involves flooding and draining plots to study the effects of varying soil moisture on ecosystem processes as detected by plant reflectance properties. 3) Analysis of hyperspectral data from tramlines in the plots shows changes in reflectance and NDVI throughout the seasons and between years that may be related to the experimental treatments and environmental conditions like flooding events.
Seismically Induced Landsliding in Seattle - Kate AllstadtEERI
油
1) A Mw 7 earthquake on the Seattle Fault would trigger thousands of landslides according to the simulation, especially in coastal bluffs and steep slopes.
2) Accounting for soil saturation, over 30,000 landslides could be triggered, threatening over 10 km of infrastructure.
3) The results show more extensive landsliding than indicated by existing static landslide hazard maps, with 36% of failures outside known hazard zones. More research is still needed to improve landslide modeling.
1) The document discusses river flow health in China using existing monthly flow volume data from Chinese rivers.
2) Graphs show flow volumes at different locations on the Yellow River have fluctuated over time, with decreases observed after the construction of major dams.
3) The document proposes an index to assess the degree to which actual river flows meet expected environmental flow needs, with scores based on measured flows compared to recommended flows.
1) Ecohydrodynamics studies the physical constraints of ecosystems based on time and spatial scales, and incorporates the water characteristics surrounding marine environments.
2) The ecohydrodynamic conditions around cold-water coral reefs determine food and larvae supply through interactions between currents, internal waves, and topography.
3) A 3D ocean model of the Mingulay Reef complex in the Sea of Hebrides shows tidally-driven currents and downwelling of surface waters delivering pulses of food to the reefs every six hours.
1) Combined fast neutron and dual energy gamma ray transmission (NEUDEG) measurements can non-invasively assess materials by taking advantage of each modality's sensitivities.
2) Dual energy x-ray systems resolve the transmitted x-ray beams in separate detectors to determine composition based on differing photon absorption properties of elements at different energies.
3) Industrial applications of NEUDEG and dual energy x-ray systems face challenges related to detector size and cost limitations, radiation shielding difficulties, and unreliable pulse shape discrimination electronics in industrial settings.
1. The study evaluated the relationship between LIDAR-derived rugosity and coral reef fish assemblages in Hanauma Bay, Hawaii.
2. LIDAR rugosity was highly correlated with in-situ rugosity measurements at a 4m grid scale.
3. Fish abundance, richness, and biomass at hard bottom sites were significantly correlated with LIDAR rugosity at various grid scales, but not at sand sites. Higher rugosity was associated with greater fish numbers and biomass.
Richard Silberstein_Water and carbon fluxes from a Banksia woodland at the Gi...TERN Australia
油
The document discusses a study measuring water and carbon balances in a native bush ecosystem located in a groundwater recharge area in Gingin, Western Australia. Instruments were installed to monitor soil moisture, water table levels, and carbon and water fluxes. The goal is to understand the water usage and carbon balance of the native vegetation and contribute to sustainable management of the local ecosystem and groundwater resources.
The document discusses using near-infrared (NIR) spectroscopy to evaluate the purity of single-walled carbon nanotubes (SWNTs). It demonstrates that NIR spectroscopy can be used to quantify the purity of SWNT samples by comparing absorbance peaks from semiconducting and metallic SWNTs. The document also shows how purification techniques like oxidation and acid treatment can be monitored using NIR spectroscopy to increase the purity of SWNT samples. Extinction coefficient measurements provide a way to estimate purity levels of SWNTs and other carbonaceous materials using Beer's law calculations.
Affinity: the meaningful trait-based alternative to the obsolete obfuscation ...Lanimal
油
1) The document presents an argument that affinity, represented by the variable "a", is a superior metric to the half-saturation constant "Ks" for modeling nutrient uptake kinetics in aquatic systems. Affinity separates the traits relevant for uptake at high versus low nutrient concentrations in a clearer way.
2) Analysis of multiple data sets shows relationships between maximum uptake rate (Vmax) and affinity, but these relationships do not necessarily indicate a physiological trade-off as relationships between Vmax and Ks had been interpreted. In some cases there was a strong positive correlation between Vmax and affinity.
3) Adopting affinity over Ks allows models to be more easily tuned and better reveals relationships between kinetic parameters,
Dos hermanas llegan tarde a la escuela y discuten problemas familiares. En clase, cuatro amigas Joha, Tere, Nessy y Ajar deciden jugar a la Ouija en el recreo a pesar de los miedos de Tere. M叩s tarde, Ajar muere en un accidente al caer por las escaleras. Posteriormente, las otras tres amigas tambi辿n mueren de forma misteriosa, dejando a la profesora horrorizada.
The UTEP Swimming and Fitness Center achieved LEED Silver certification. It earned points in several categories including sustainable sites, water efficiency, energy and atmosphere, and indoor environmental quality. Some key sustainability features included a solar PV and thermal system providing over 12.5% of energy use, dual flush toilets, and drought tolerant landscaping using non-potable water sources like pool backwash. An analysis of the center's water and energy systems demonstrated savings from renewable technologies.
Jesse Stevens has over 15 years of experience in product design, operations management, and strategic planning. He has a background in sculpture and fine arts as well as training in industrial design. Stevens enjoys taking a holistic approach to design by considering cultural, emotional, and environmental factors. He has worked on a wide range of projects from eyewear and lighting to furniture and sculpture.
Presentaci坦 utilitzada en la xerrada al Col揃legi d'arquitectes de Tarragona el 17/12/2010.
Cooperar 辿s possible? Ens poden ajudar les eines 2.0 i el cloud computing a fer-ho?
La recerca de feina 2.0 i el personal brandingAgust鱈 L坦pez
油
Presentaci坦 utilitzada al F嘆rum de l'ocupaci坦 universitria 2013 que organitza cada any la URV.
En la xerrada es va tractar sobre com crear i gestionar una identitat digital i una recerca de feina en els entorns de la web social.
(cat) Descripci坦 de les principals funcions de twitter, indicacions per a utilitzar-lo i algunes de les aplicacions que formen part del seu ecosistema.
This document provides information about HR Support services that can help businesses with various human resources issues and compliance requirements. It lists common HR problems businesses may face such as firing an employee for smoking, dealing with employees refusing to relocate, and managing workplace pension requirements. Businesses can receive tailored HR services including consultancy, project management, mediation, and outsourcing. HR Support offers flexible services by telephone, email, or on-site to address issues like contracts, absences, pay, terminations, and more.
Los l叩pices de colores permiten mezclar colores de forma b叩sica mediante dos t辿cnicas: colorear sobre una superficie o mezclar los colores directamente en la paleta para luego transferirlos al papel.
Christoph Jan KUELLS "Ecohydrological principles in economic models of water ...Global Risk Forum GRFDavos
油
This document discusses 4 key ecohydrological principles for modeling water resources in drylands:
1. The response of dryland ecohydrology is slow due to long time scales and residence times of hydrological systems.
2. Dryland ecohydrological systems are nested hierarchical systems with different scaling properties than agronomy and meteorology.
3. Ecohydrological processes have strong feedbacks and non-linear responses, as actions can change the overall system.
4. It is important to balance the cycles of water and solutes to achieve sufficiency, sustainability, efficiency and resilience, as seen in the water and solute cycles of an example system in Windhoek.
Well Log Interpretation and Petrophysical Analisis in [Autosaved]Ridho Nanda Pratama
油
PT. Halliburton Logging Service is a branch of Halliburton that provides completion and production services, drilling, and reservoir evaluation to oil companies in Sumatra, Indonesia. Dery Marsan and Ridho Nanda Pratama completed an on-job training program at Halliburton from August to September 2015. Their project involved well log analysis to determine water saturation and the most suitable water resistivity parameters in two formations, with the objectives of identifying water zones, evaluating challenges around determining petrophysical parameters, and analyzing well data. Their analysis identified both water-bearing and possible oil-bearing zones through evaluation of gamma ray, resistivity, neutron-density crossplots, and other well logs.
The document discusses the measurement and representation of hydrological quantities. It notes that hydrological data has complex trends that are nonlinear and influenced by many factors. Statistical tools must be used to describe hydrological quantities given their spatiotemporal variability. Examples of typical problems in measuring quantities like precipitation, river flows, and soil moisture are provided.
Water resources and biofuels water quality april 2012Sharon Lezberg
油
This document discusses water quality issues related to hypoxia. It begins by defining hypoxia as low dissolved oxygen concentrations that cannot support marine life, typically below 2 ppm. It then explains that hypoxia occurs due to algae blooms in freshwater settling on the bottom and consuming oxygen during decomposition. The size of hypoxic areas can be large, such as the size in 2008 shown on a map. Nutrient flux and sources of nitrogen and phosphorus that contribute to algae blooms and hypoxia are also discussed. The document considers future impacts on water quality from different cropping systems and biofuel production approaches.
The January 19, 2012 EFWCoop meeting covered the following topics:
1) An update on the water quality monitoring program and planning for 2012 to support TMDL development.
2) An update on modeling projects of the Upper East Fork watershed and Great Miami River.
3) A discussion of ongoing watershed projects including cover crop effectiveness and developing a remote sensing pilot project.
4) Other issues for discussion including large watershed characterization for decision support.
The effects of minimum and conventional tillage systems on maize grain yield ...Joanna Hicks
油
The document evaluates the effects of minimum tillage (MT) and conventional tillage (CT) systems on maize yield and soil fertility in western Ethiopia over 5 years. MT with residue retention (MTRR) increased average maize yields by 6.6% compared to MT with residue removal (MTRV) and 12.2% compared to CT. MTRR also increased yields more during drought years. MTRR improved soil organic carbon, nitrogen, phosphorus and potassium levels compared to MTRV and CT. The recommended nitrogen fertilizer rate of 92 kg/ha was appropriate for all tillage systems.
- The document discusses the degradation of wetlands in the UK and Sussex. Over 40% of UK floodplains and over 90% of wetland SSSIs in Sussex are in unfavorable condition.
- It outlines the ecosystem services provided by wetlands, including provisioning services like fresh water, food, and materials, as well as regulating services like water purification and flood control. Cultural services like recreation and tourism are also highlighted.
- While some ecosystem services of Ramsar sites in Sussex are explicitly recognized, many remain unrecognized. A better understanding of wetland value is needed to reverse degradation and improve human well-being.
This document discusses how science can inform policy to address pollution in large bodies of water like the Great Lakes. It provides the example of Saginaw Bay in the Great Lakes, where a water quality model was developed to define the relationship between phosphorus loads and algal blooms. This supported a policy to reduce phosphorus levels from wastewater plants. Water quality improved dramatically but invasive zebra mussels later changed the ecosystem. Science continues to play a role through adaptive management by updating targets and questions as the system changes over time. The same principles could guide policy in Lake Tai through defining required pollution controls and response times based on the specific characteristics of the lake system.
Gene expression was analyzed in the Pacific oyster Crassostrea gigas to evaluate environmental stress. Oysters were exposed to different levels of carbon dioxide representing current and elevated future ocean acidification conditions. Targeted gene analysis showed upregulation of heat shock protein 70 and oxidative stress genes in response to higher carbon dioxide levels. Whole transcriptome sequencing of oysters from sites with different human impacts identified over 1,300 genes with differing expression, related to processes like cell communication, immune response, and developmental maturation. Transcriptomic tools provide insights into physiological responses and population impacts of environmental change in oysters.
This document summarizes a study that used a spectral matching algorithm to estimate water optical properties, water depth, and bottom albedo from a WorldView-2 satellite image of coastal waters in Singapore. The algorithm fitted pixel reflectance spectra to a shallow water reflectance model to derive parameters like water depth, bottom composition, and detect submerged vegetation. Estimates of water depth, bottom albedo, and a vegetation index were produced and helped map different coastal habitats beneath the water surface.
Radioactive contamination of aquatic ecosystemsfollowing the chernobyl accidenttrabajomuestreo
油
1) The document analyzes radioactive contamination of aquatic ecosystems following the Chernobyl nuclear accident, focusing on accumulation of radionuclides in aquatic biota.
2) Radionuclide levels remained highly elevated in the Chernobyl cooling pond ecosystem for years after the accident, with bottom sediments, aquatic plants, and mollusks showing particularly high contamination.
3) Predatory fish species in the cooling pond and other water bodies accumulated much higher levels of radiocesium than non-predatory species, demonstrating the effect of trophic transfer.
CSP Training series : solar resource assessment 1/2Leonardo ENERGY
油
The key factors that can explain inconsistencies and large disagreements between solar resource maps include:
1. Differences in the cloud data sources or periods used to create the maps
2. Inconsistent aerosol data used in the models
3. Use of long-term monthly average aerosol data versus mean daily data
4. Reliance on empirical algorithms that may degrade in accuracy for some areas
5. Lack of validation against actual ground-measured DNI data, which is limited
Proper validation against available ground measurements and consistency in input data are important to improve agreement between solar resource maps. The scarcity of DNI data makes validation challenging.
An overview of a collaborative project between the Lake Ecosystem Group at the Centre for Ecology & Hydrology, Lancaster, and the Grey Lab at Queen Mary University of London.
The project is funded by the Natural Environment Research Council Ecology & Hydrology Funding Initiative, and includes project partners at the Freshwater Biological Association and Queen's University Belfast.
Alan Andersen_Subcontinental-scale transects for assessing and monitoring eco...TERN Australia
油
The document describes the Australian Transect Network (ATN), a continental-scale ecological monitoring program consisting of several transects across Australia. The ATN aims to understand how ecosystems respond to environmental gradients and disturbances like climate change. One of the transects is the Northern Australian Tropical Transect (NATT), which runs 1500 km from Darwin to Tennant Creek across the savanna biome. The NATT monitors tree growth rates along the rainfall gradient and has established long-term tree plots and flux towers to study how the ecosystem responds to fire and other disturbances under climate change.
This document discusses the interpretation of raw seismic records obtained on land and at sea.
On land records, direct waves, refracted waves, surface waves, and reflections can be observed and used to estimate velocities and depths. At sea, direct waves, refracted waves, reflections, and multiple reflections are typically observed.
The document analyzes sample land and marine seismic records, identifying events such as refractions, surface waves, air waves, and reflections. Simple models are presented to explain the major events observed on the raw records. Fourier transforms are mentioned as a way to separate different events.
Energy as Motor of Seawater Reverse Osmosis Desalination Development禽艶乙姻辿馨看稼岳
油
This document summarizes information about reverse osmosis desalination and trends in energy consumption. It discusses how reverse osmosis works to treat brackish water and seawater, showing typical operating pressures and recovery rates. Energy consumption in desalination depends on factors like total dissolved solids, recovery rate, temperature, and membranes used. The document then charts historical energy consumption for desalination plants from the 1970s to present, showing a gradual decline. Future reductions may come from improved energy recovery devices, membranes, and pretreatment techniques. Emerging technologies like forward osmosis also have potential to significantly reduce energy use.
This document summarizes research on the transport of dissolved organic carbon (DOC) from peatlands to streams. It finds that DOC is transported via overland flow, throughflow on the surface, and pipe flow. The response of stream water DOC to storms depends on the number and location of source waters. Transport of DOC from peat and mineral soils differs due to hydrological and soil profile properties. Some streams receive groundwater inputs during low flows which results in lower DOC and pH of around 6-7. The largest losses of DOC, around 50%, occur during high flow events which represent only 10% of the time.
Welcome to International Journal of Engineering Research and Development (IJERD)IJERD Editor
油
call for paper 2012, hard copy of journal, research paper publishing, where to publish research paper,
journal publishing, how to publish research paper, Call For research paper, international journal, publishing a paper, IJERD, journal of science and technology, how to get a research paper published, publishing a paper, publishing of journal, publishing of research paper, reserach and review articles, IJERD Journal, How to publish your research paper, publish research paper, open access engineering journal, Engineering journal, Mathemetics journal, Physics journal, Chemistry journal, Computer Engineering, Computer Science journal, how to submit your paper, peer reviw journal, indexed journal, reserach and review articles, engineering journal, www.ijerd.com, research journals,
yahoo journals, bing journals, International Journal of Engineering Research and Development, google journals, hard copy of journal
Welcome to International Journal of Engineering Research and Development (IJERD)IJERD Editor
油
Five Years of Land Surface Phenology in an Arctic Landscape
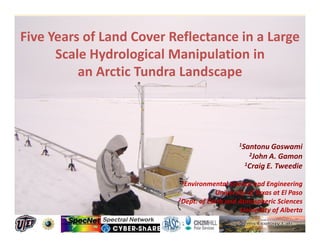
1. Five Years of Land Cover Reflectance in a Large
Scale Hydrological Manipulation in
an Arctic Tundra Landscape
1Santonu Goswami
2John A. Gamon
1Craig E. Tweedie
1Environmental Science and Engineering
University of Texas at El Paso
2Dept. of Earth and Atmospheric Sciences
University of Alberta
-
.
2. Importance of Surface Hydrology (Soil
Moisture) in ecosystem structure and function
Many observed and modeled change responses of
arctic terrestrial ecosystems are related to surface
hydrology:
Surface energy budgets (Chapin et al. 2005, Euskircken et
al. 2007)
Land-atmosphere carbon exchange (Merbold et. al 2009,
Wolf et al. 2008)
Geomorphic processes (Lawrence and Slater 2005,
McNamara and Kane 2009)
Provision of ecosystem goods and services (Milennium
Ecosystem Assessment)
Plant phenology and response to warming (Arft et al. 1999,
Walker et al. 2006)
3. Plants as an indicator of change
Detecting biotic responses to a changing environment is
essential for understanding the consequences of global
change.
Plants can work as effective indicators of
changing conditions and, depending on the nature of the
change,
respond by increasing or decreasing amounts of green-leaf
biomass, chlorophyll, and water content.
important effects on ecosystem processes such as NPP and
nutrient cycling.
Plant phenology is detectable using remote sensing
technologies and therefore scaleable over space and time
(e.g. NDVI).
4. Study Site - Biocomplexity Experiment,
Barrow, Alaska
5. Experimental Setup: Biocomplexity
Experiment
Tramlines (300m long)
Large-scale Hydrological
Manipulation experiment
to study the effect of Controlled
varying Soil Moisture on
ecosystem Carbon Drained
Balance in the Arctic Flooded
Dikes
100km Barrow (71尊19'N 156尊37'W)
Atqasuk
Coastal Plain
Eddy covariance towers
Brooks Range
9. The Tram System
Near surface remote sensing technology
Measurements are made at every meter along each of the
three 300 meter tramlines (precise and repeatable)
Collects hyperspectral data in the vis-nir region and digital
images of vegetation
More than 200,000 data files collected in 5 years
Has the ability to carry various sensors packages
Can be used to study change in phenology, sun angle
effect on vegetation etc
Standardized sampling design is part of a larger effort
(SpecNet) to compare ecosystem responses using a
combination of spectral reflectance and flux
measurements
Tramline system in the biocomplexity experiment is the
largest ground based spectral data monitoring system
that we are aware of internationally
10. Measurement of Reflectance
Reflectance
= ITarget / IDownwelling
= Radiance/Irradiance
Reflectance correction
= (RTarget / RDownwelling) X (RDownwelling/ RPanel)
NDVI (Normalized Difference
Vegetation Index) calculation
= (R800-R680)/ (R800+R680)
Also measures water table depth, thaw
depth.
11. Questions being asked in this study
How does land-surface phenology (i.e. surface
reflectance properties) change inter-annually?
Is there any detectable effect of experimental
treatment (flooding and draining) on surface
reflectance?
12. Transition Throughout the Season
avg corrected reflectance south 070613
1
H2O Band
reflectance
0.5
1st Week of June
0
350 450 550 650 750 850 950 1050
wavelength
avg corrected reflectance south 070618
0.2
Chl Feature
reflectance
0.1
3rd Week of June
0
350 550 750 950
wavelength
0.3 Corrected reflected south 080806
Chl Feature
Reflectance
0.2
0.1 1st Week of August
0
350 550 750 950
Wavelength
13. Inter-annual variability of NDVI in the treatment areas for
pre-treatment years (2005, 2006, 2007) and treatment years
(2008 and 2009)
Peak growing time
Peak growing time
0.70
0.70
0.60 0.60
0.50 0.50
0.40
NDVI
0.40
NDVI
0.30 Flooding 0.30
treatment effect Snow fall
0.20 0.20
0.10 Heavy flooding event 0.10
0.00 0.00
Snow-melt Snow-melt
-0.10 -0.10
-0.20 -0.20
150 170 190 210 230 250 150 170 190 210 230 250
Day of Year
Day of Year
NDVI North 2005 NDVI North 2006 NDVI North 2007 NDVI Central 2005 NDVI Central 2006 NDVI Central 2007
NDVI North 2008 NDVI North 2009 NDVI Central 2008 NDVI Central 2009
FLOODED DRAINED
14. 25
20
Water Table Depth (cm)
15
10
5
Flooding
treatment Flooded
0
-5 2009
-10 2008
-15
-20
2007
160 170 180 190 200 210 220 230
0 Day of Year
Comparison of inter-
Thaw Depth (cm)
Increased thaw in 2009
-15
annual variability of
-30
NDVI to water table
-45
160 170 180 190 200 210 220 230
depth and thaw depth
0.70
Day of Year in the flooded section
0.60 Heavy flooding
0.50 event for 2007 (pre-
0.40
0.30
0.20
treatment) and 2008
NDVI
0.10 Flooding treatment in 2008
0.00
Snow-melt
and 2009 (treatment
-0.10
-0.20
160 170 180 190 200 210 220 230
years)
Day of Year
15. 30
Water Table Depth (cm)
20
10 Drained
0
2009
-10
2008
-20
2007
160 170 180 190 200 210 220 230
0
-15
Comparison of inter-
Thaw Depth (cm)
-30
annual variability of
-45
160 170 180 190 200 210 220 230
NDVI to water table
depth and thaw depth
0.70
0.60 in the drained section
0.50
0.40
0.30
for 2007 (pre-
0.20
treatment) and 2008
NDVI
0.10 Snowfall
0.00
-0.10 Snow-melt and 2009 (treatment
-0.20
160 170 180 190 200 210 220 230 years)
Day of Year
16. 30
Water Table Depth (cm)
20
10
Control
0 2009
-10 2008
-20 2007
160 170 180 190 200 210 220 230
0 Dry year 2007
Thaw Depth (cm)
-15
Comparison of inter-
-30
annual variability of
-45
160 170 180 190 200 210 220 230
NDVI to water table
0.70
depth and thaw depth
0.60
0.50 in the control section for
0.40
0.30 2007 (pre-treatment)
NDVI
0.20
0.10
0.00
Snowfall and 2008 and 2009
-0.10 Snow-melt
-0.20 (treatment years)
160 170 180 190 200 210 220 230
Day of Year
17. 0.50
0.43
0.40
0.40
0.33
0.30
NDVI
0.20
0.10
0.00
11% surface 28% surface 83% surface
water water water
Standing surface water
has a significant effect on
reflectance spectra.
This has profound effect
on the NDVI values.
18. The spectral range (400-1000nm) offers the ability to detect
several things, including water. Using a spectral index (NDSWI)
capable of capturing multi-dimensional surface hydrological
dynamics can improve the sampling capabilities of this system
NDSWI (Normalized
Difference Surface
Low Water Index) =
(R490-R1000)
(R490+R1000)
High
Quickbird 2002 Quickbird 2008 Goswami et. al submitted, JGR
Biogeosciences
19. Summary and Conclusion
Changes in vegetation cover during the growing season was
clearly detectable using surface reflectance.
Seasonal patterns of the NDVI values showed some
differences with flooding. The flooded section showed bigger
differences than the drained section.
The seasonal patterns in NDVI was least different for the
control section among the years.
NDVI values were compromised by varying water cover
(among other things), so simultaneously tracking NDVI and
NDSWI might be a better approach in this landscape.
Alternatively, other methods like Spectral Mixture Analysis
can probably help here.
20. Acknowledgements
National Science Foundation (ASSP-0421588).
Barrow Arctic Science Consortium.
CH2M Hill Polar Field Services
Ukpeagvik Inupiat Corporation landholder
Spectral Network.
UTEP Cybershare Center of Excellence.
Sergio Vargas, Perry Houser, Christian Andresen, Adrian
Aguirre, Sandra Villarreal, Ryan Cody, David Lin.
Systems Ecology Laboratory, University of Texas at El Paso.