


More Related Content
Similar to Fundamentals of Data Science Probability Distributions (20)
More from RBeze58 (10)


Recently uploaded (20)


![MODULE 01 - CLOUD COMPUTING [BIS 613D] .pptx](https://cdn.slidesharecdn.com/ss_thumbnails/module01-cloudcomputing-250409082345-d719f5bc-thumbnail.jpg?width=560&fit=bounds)


Fundamentals of Data Science Probability Distributions
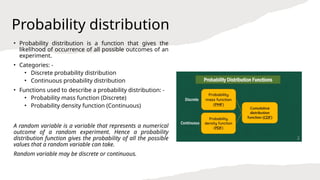
- 2. Probability distribution ŌĆó Probability distribution is a function that gives the likelihood of occurrence of all possible outcomes of an experiment. ŌĆó Categories: - ŌĆó Discrete probability distribution ŌĆó Continuous probability distribution ŌĆó Functions used to describe a probability distribution: - ŌĆó Probability mass function (Discrete) ŌĆó Probability density function (Continuous) A random variable is a variable that represents a numerical outcome of a random experiment. Hence a probability distribution function gives the probability of all the possible values that a random variable can take. Random variable may be discrete or continuous.
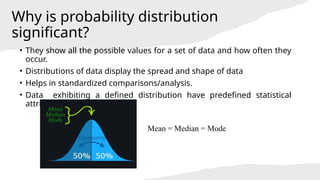
- 3. Why is probability distribution significant? ŌĆó They show all the possible values for a set of data and how often they occur. ŌĆó Distributions of data display the spread and shape of data ŌĆó Helps in standardized comparisons/analysis. ŌĆó Data exhibiting a defined distribution have predefined statistical attributes Mean = Median = Mode
- 4. Probability Distribution Function ŌĆó The probability distribution function is also known as the cumulative distribution function (CDF). ŌĆó If there is a random variable, X, and its value is evaluated at a point, x, then the probability distribution function gives the probability that X will take a value lesser than or equal to x. It can be written as F(x) = P (X x) Ōēż Probability distribution function can be used for both discrete and continuous variables.
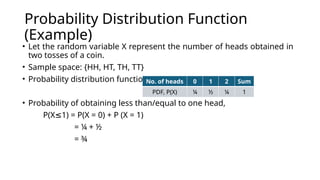
- 5. Probability Distribution Function (Example) ŌĆó Let the random variable X represent the number of heads obtained in two tosses of a coin. ŌĆó Sample space: {HH, HT, TH, TT} ŌĆó Probability distribution function: ŌĆó Probability of obtaining less than/equal to one head, P(X 1) = P(X = 0) + P (X = 1) Ōēż = ┬╝ + ┬Į = ┬Š No. of heads 0 1 2 Sum PDF, P(X) ┬╝ ┬Į ┬╝ 1
- 6. Probability distribution of a discrete random variable ŌĆó A discrete random variable can be defined as a variable that can take a countable distinct value like 0, 1, 2, 3... ŌĆó Probability Mass Function: p(x) = P(X = x) ŌĆó Probability Distribution Function: F(x) = P (X x) Ōēż ŌĆó Examples of discrete probability distribution: - ŌĆó Binomial distribution ŌĆó Bernoulli distribution ŌĆó Poisson distribution
- 7. Probability distribution of a discrete random variable https://www.youtube.com/watch?v=YXLVjCKVP7U&ab_channel=zedstatistics
- 8. Probability Distribution of a Continuous Random Variable ŌĆó A continuous random variable can be defined as a variable that can take on infinitely many values. ŌĆó The probability that a continuous random variable will take on an exact value is 0. ŌĆó Probability Distribution Function: F(x) = P (X x) Ōēż ŌĆó Probability Density Function: f(x) = d/dx (F(x)) ŌĆó Examples of continuous probability distribution: - ŌĆó Normal distribution ŌĆó Uniform distribution ŌĆó Exponential distribution
- 9. Probability Distribution of a Continuous Random Variable ŌĆó A
- 10. Bernoulli Distribution ŌĆó A Bernoulli distribution has only two possible outcomes, namely 1 (success) and 0 (failure), and a single trial. ŌĆó The random variable X can take the following values: - ŌĆó 1 with the probability of success, p ŌĆó 0 with the probability of failure, q = 1 ŌĆō p ŌĆó Probability mass function (PMF), P(x) ŌĆó Expected value or mean = p ŌĆó Variance = p.q
- 11. Bernoulli Distribution ŌĆó Probability of success, p when x = 1 and failure, q when x = 0. ŌĆó Note: p and q may not be the same.
- 12. Binomial distribution ŌĆó When multiple trials of an experiment that yields a success/failure (Bernoulli distribution) is conducted, it exhibits a binomial distribution. PMF, P where, n = number of trials x = number of successes p = probability of success q = probability of failure ŌĆó Expected value = n.p ŌĆó Variance = n.p.q
- 13. Binomial distribution (Example) A store manager estimates the probability of a customer making a purchase as 0.30. What is the probability that two of the next three customers will make a purchase? Solution: The above exhibits a binomial distribution as there are three customers ( 3 trials) with every customer either making a purchase (success) or not making a purchase (failure). Probability that two of the next three customers will make a purchase, P
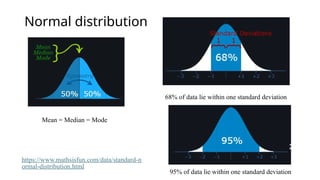
- 14. Normal distribution ŌĆó In a normal distribution the data tends to be around a central value with no bias left or right. ŌĆó Also called a bell curve as it looks like a bell. ŌĆó Many things follow a normal distribution ŌĆō heights of people, marks scored in a test.
- 15. Normal distribution Mean = Median = Mode 68% of data lie within one standard deviation 95% of data lie within one standard deviation https://www.mathsisfun.com/data/standard-n ormal-distribution.html
- 16. Skewness Negative skew: The long tail is on the negative side of the peak Positive skew: The long tail is on the positive side of the peak https://www.mathsisfun.com/data/skewness.html
- 17. Uniform distribution ŌĆó In a Uniform Distribution there is an equal probability for all values of the random variable between a and b.
- 18. Relationship between two variables ŌĆó Covariance and correlation and are two statistical measures that describe the relationship between two variables. ŌĆó They both quantify how two variables change together, but they differ in scale, interpretation, and units.
- 19. Covariance ŌĆó Covariance measures the direction of the linear relationship between two variables. ŌĆó It tells you whether the variables move in the same direction (positive covariance) or in opposite directions (negative covariance).
- 20. Covariance (Example) Covariance between temperature and ice cream sales Cov(X, Y) = 243 ŌĆó Positive value indicates a positive correlation between temperature and ice cream sales. ŌĆó However, it does not specify the strength of the relationship.
- 21. Correlation ŌĆó Correlation measures both the strength and direction of the linear relationship between two variables. ŌĆó It lies within a within a standardized range. ŌĆó 1 ŌĆō perfect positive correlation ŌĆó -1 ŌĆō perfect negative correlation ŌĆó 0 ŌĆō no correlation Perfect Positive Correlation
- 23. Correlation ŌĆó Correlation only works for linear relationships. ŌĆó Correlation is 0.
- 24. Exploratory Data Analysis (EDA) Exploratory Data Analysis refers to the critical process of performing initial investigations on data so as to discover patterns, spot anomalies, test hypothesis and to check assumptions with the help of summary statistics and graphical representations. Key Objectives of EDA: ŌĆó Understand the data structure: Gain insights into the data's size, types, and completeness. ŌĆó Identify patterns: Detect trends, correlations, and groupings. ŌĆó Find anomalies: Spot outliers and inconsistencies in the data. ŌĆó Generate hypotheses: Form initial ideas for models, statistical testing, or predictions. ŌĆó Refine data: Clean, transform, or filter the data for further analysis.
- 25. Steps in EDA 1. Data loading and inspection 2. Univariate analysis 3. Bivariate analysis 4. Multivariate analysis 5. Identifying missing values and outliers 6. Data transformation 7. Feature engineering 8. Hypothesis engineering
- 26. Data loading and inspection Step 1. Load data into the workspace df.head() command displays the first few records Step 2. Data preview and summary
- 27. Univariate analysis ŌĆó Involves analyzing each variable individually to understand its distribution, central tendency, and spread. ŌĆó Numerical variables: histograms, box plots, and summary statistics (mean, median, standard deviation) ŌĆó Categorical variables: bar charts, pie charts