Graphs in space: a guide to visualizing geospatial networks

Many of today's geospatial graph projects deal with distance queries or path-finding problems such as, 'what¡¯s my fastest route to the airport?¡¯, or, 'where¡¯s the nearest 5* restaurant?¡¯. Geospatial graphs are good at providing answers fast, but their value doesn¡¯t stop there. They can solve many more complex problems too. Drawing from Cambridge Intelligence¡¯s rich experience in applied graph visualization, this talk looks at how to exploit the rich geographic insight in your graph data through compelling, interactive visualizations. The talk deals with questions such as: What types of map are available? Which ones work well with connected data? Should maps be restricted to high level ¡®dashboards¡¯? Can they convey complex connected data to any depth? What do those analysts who rely on geofencing, chloropleths and coordinate reference systems expect from their interactive maps? Where does connected data fit in? When combining the busy worlds of big connected data and interactive maps, how do we avoid overwhelming users with unnecessary clutter? Join us to explore use case studies in areas as diverse as IT network topology management, car insurance fraud, building planning, and law enforcement. We¡¯ll highlight the variety of ways you can exploit connected geospatial views.


Recommended


More Related Content
More from Connected Data World (20)
Recently uploaded (20)


![Formal Methods: Whence and Whither? [Martin Fr?nzle Festkolloquium, 2025]](https://cdn.slidesharecdn.com/ss_thumbnails/mf2025-250305164811-a0930761-thumbnail.jpg?width=560&fit=bounds)


Graphs in space: a guide to visualizing geospatial networks
- 1. Graphs in space A guide to visualizing geospatial networks Dan Williams
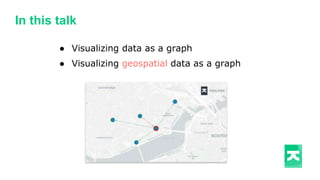
- 2. In this talk ¡ñ Visualizing data as a graph ¡ñ Visualizing geospatial data as a graph
- 3. Bags of nodes and edges
- 4. Layouts A good layout puts nodes in the best possible location on the screen
- 5. Layouts Handling huge amounts of data
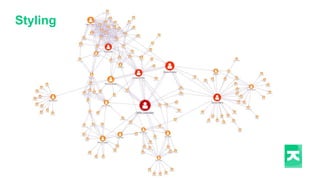
- 6. Styling
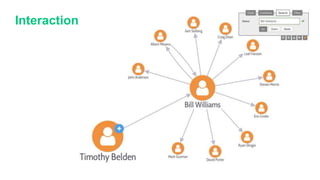
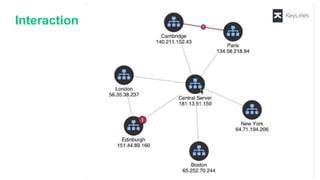
- 7. Interaction
- 8. Interaction
- 9. ¡°Hey, can we put that on a map?¡±
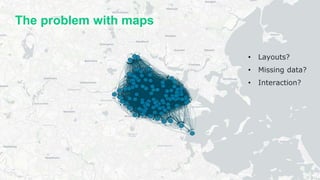
- 10. The problem with maps ? Layouts? ? Missing data? ? Interaction?
- 12. The problem with maps ? Layouts? ? Missing data? ? Interaction?
- 13. So¡ why was this a good idea?
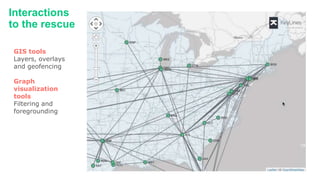
- 14. Interactions to the rescue GIS tools Layers, overlays and geofencing Graph visualization tools Filtering and foregrounding
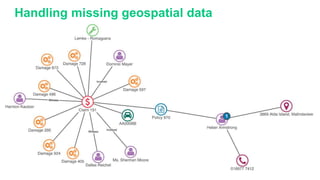
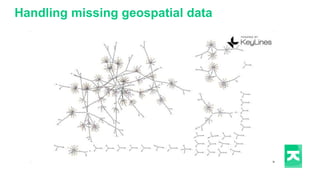
- 15. Handling missing geospatial data
- 16. Handling missing geospatial data
- 17. Handling missing geospatial data
- 18. Handling missing geospatial data
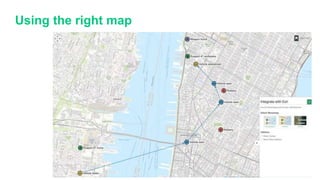
- 19. Using the right map
- 20. Using the right map
- 21. Using the right map
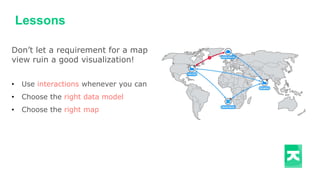
- 22. Lessons Don¡¯t let a requirement for a map view ruin a good visualization! ? Use interactions whenever you can ? Choose the right data model ? Choose the right map