HPTLC_Method Validation by Priyanka Singh
Download as pptx, pdf0 likes37 views

The document outlines the method validation process, which is integral to method development and ensures analytical procedures are suitable for their intended use. Key validation parameters include selectivity, stability, linearity, range, limit of detection (LOD), limit of quantification (LOQ), accuracy, precision, and ruggedness. Additionally, it emphasizes the importance of compliance with regulatory standards and the evaluation of the analytical method's performance through various testing conditions.


HPTLC_Method Validation by Priyanka Singh
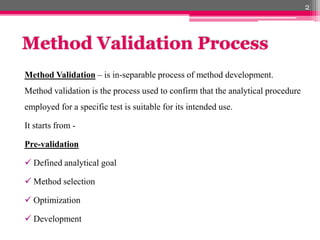
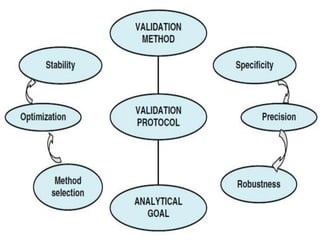
- 2. Method Validation Process Method Validation ÔÇô is in-separable process of method development. Method validation is the process used to confirm that the analytical procedure employed for a specific test is suitable for its intended use. It starts from - Pre-validation ´â╝ Defined analytical goal ´â╝ Method selection ´â╝ Optimization ´â╝ Development 2
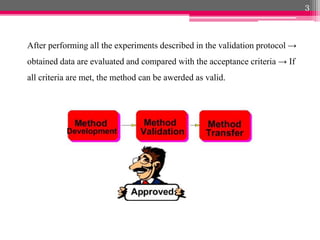
- 3. After performing all the experiments described in the validation protocol  obtained data are evaluated and compared with the acceptance criteria  If all criteria are met, the method can be awerded as valid. 3
- 4. ´éº Establishes; that test data obtained is reproducible , reliable & accurate. ´éº Confirms; that the method is suitable for a particular system ´éº Determine; if Method is Acceptable for Intended Use. ´éº Identification; of source of potential errors. ´éº Validation of analytical methods is also required by most regulations. 4
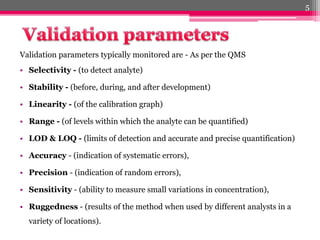
- 5. Validation parameters typically monitored are - As per the QMS ÔÇó Selectivity - (to detect analyte) ÔÇó Stability - (before, during, and after development) ÔÇó Linearity - (of the calibration graph) ÔÇó Range - (of levels within which the analyte can be quantified) ÔÇó LOD & LOQ - (limits of detection and accurate and precise quantification) ÔÇó Accuracy - (indication of systematic errors), ÔÇó Precision - (indication of random errors), ÔÇó Sensitivity - (ability to measure small variations in concentration), ÔÇó Ruggedness - (results of the method when used by different analysts in a variety of locations). 5
- 6. 6
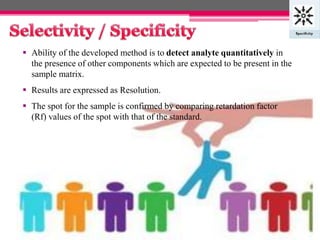
- 7. ´éº Ability of the developed method is to detect analyte quantitatively in the presence of other components which are expected to be present in the sample matrix. ´éº Results are expressed as Resolution. ´éº The spot for the sample is confirmed by comparing retardation factor (Rf) values of the spot with that of the standard. 7
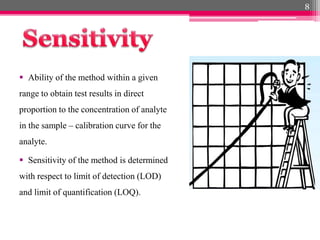
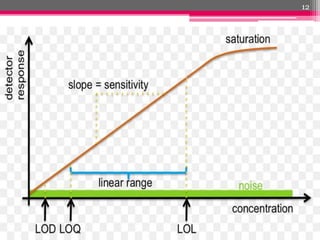
- 8. ´éº Ability of the method within a given range to obtain test results in direct proportion to the concentration of analyte in the sample ÔÇô calibration curve for the analyte. ´éº Sensitivity of the method is determined with respect to limit of detection (LOD) and limit of quantification (LOQ). 8
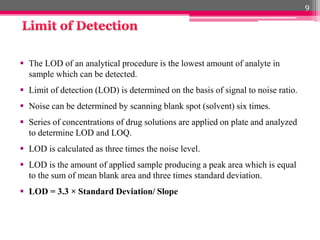
- 9. ´éº The LOD of an analytical procedure is the lowest amount of analyte in sample which can be detected. ´éº Limit of detection (LOD) is determined on the basis of signal to noise ratio. ´éº Noise can be determined by scanning blank spot (solvent) six times. ´éº Series of concentrations of drug solutions are applied on plate and analyzed to determine LOD and LOQ. ´éº LOD is calculated as three times the noise level. ´éº LOD is the amount of applied sample producing a peak area which is equal to the sum of mean blank area and three times standard deviation. ´éº LOD = 3.3 ├ù Standard Deviation/ Slope 9
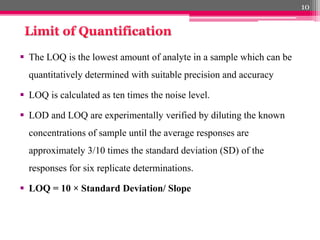
- 10. ´éº The LOQ is the lowest amount of analyte in a sample which can be quantitatively determined with suitable precision and accuracy ´éº LOQ is calculated as ten times the noise level. ´éº LOD and LOQ are experimentally verified by diluting the known concentrations of sample until the average responses are approximately 3/10 times the standard deviation (SD) of the responses for six replicate determinations. ´éº LOQ = 10 ├ù Standard Deviation/ Slope 10
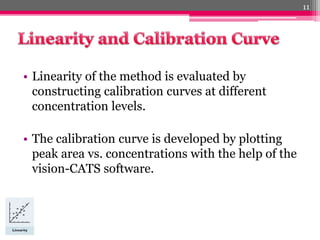
- 11. ÔÇó Linearity of the method is evaluated by constructing calibration curves at different concentration levels. ÔÇó The calibration curve is developed by plotting peak area vs. concentrations with the help of the vision-CATS software. 11
- 12. 12
- 13. Precision provides an indication of random error and evaluated in terms of intraday and interday precisions. Intraday precision -is determined by analyzing sample solutions of analyte from formulations at three levels covering low, medium, and higher concentrations of calibration curve for five times on the same day Interday precision - is determined by analyzing sample solutions of analyte at three levels covering low, medium, and higher concentrations over a period of 7 days. 13
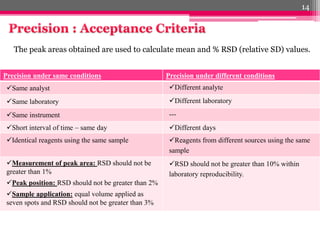
- 14. Precision under same conditions Precision under different conditions ´â╝Same analyst ´â╝Different analyte ´â╝Same laboratory ´â╝Different laboratory ´â╝Same instrument --- ´â╝Short interval of time ÔÇô same day ´â╝Different days ´â╝Identical reagents using the same sample ´â╝Reagents from different sources using the same sample ´â╝Measurement of peak area: RSD should not be greater than 1% ´â╝Peak position: RSD should not be greater than 2% ´â╝Sample application: equal volume applied as seven spots and RSD should not be greater than 3% ´â╝RSD should not be greater than 10% within laboratory reproducibility. The peak areas obtained are used to calculate mean and % RSD (relative SD) values. 14
- 15. ´éº Accuracy of an analysis is determined by systematic error involved. ´éº Accuracy of the method is evaluated by carrying the recovery study at three levels. ´éº Recovery experiments are performed by adding three different amounts of standard drug, i.e., 80, 100, and 120% of the drug, to the pre-analyzed formulations, and the resultant is reanalyzed six times(n=6). ´éº The accuracy is acceptable - if the difference between the true value and mean measured value does not exceed the RSD values obtained for repeatability of the method. 15
- 16. ´éº Analyte should not decompose during development of the chromatogram and should be stable in solution and on the sorbent for at least 30 and 15 min, respectively. ´éº The intensity of the spot on the chromatogram should be constant for at least 60 min. ´éº Chemical reaction of the solvents and their impurities may produce extra spot/peak, thus leading to false assay values. ´éº Other important factor is pH of the aqueous phase used for extraction/purification which may lead to hydrolysis, oxidation and isomerization. ´éº The complete removal of organic solvent should be avoided. 16
- 17. ÔÇó Repeatability of measurement of peak area is determined by analyzing different amount of analyte covering low, medium, and higher ranges of the calibration curve seven times without changing the position of plate. ÔÇó Repeatability of sample application is assessed by spotting samples covering similar range of calibration curve seven times and analyzing them once. 17
- 18. Ruggedness & Robustness is reliability of an analysis with respect to deliberate variations in method parameters. A slight change in external and internal factors on the results are examined. ´éº Robustness of the method is determined in triplicate and the mean and % RSD of peak area are calculated. ´éº ruggedness of the method is determine by Chromatographic analysis of analyte in different concentrations by two analysts and analyzed for recovery and %RSD values. ´éº Parameters that are affected by the changes in chromatographic conditions are retardation factor (Rf) and peak purity. 18
- 19. ´éºSample preparation: composition, quantity of solvent, ph, shaking time, temperature and number of extractions; ´éºSample application: volume applied, spot shape and size, band and spot stability; ´éºSeparation: at least on three different plates; ´éºChromatographic conditions: chamber saturation, eluent composition, eluent volume, temperature, humidity and development distance; ´éºSpot visualization: postchromatographic derivatization, spraying, dipping, reaction temperature and time; ´éºQuantitative evaluation: drying of plates, detection and wavelength. 19
- 20. ÔÇó Retardation factor (Rf) is defined as the amount of separation due to the solvent migration through the sorbent layer as shown in the formula. ÔÇó It depends on time of development and velocity coefficient or solvent front velocity. Rf = Migration distance of substane Migration distance of solvent front from origin 20
- 21. The purity of the peak is determined by comparing the spectra at three different levels: ´éº peak start (s) ´éº peak maximum (m) ´éº peak end (e) During the purity test, the spectrum taken at the first-peak slope is correlated with the spectrum of peak maximum and the correlation of the spectra taken at the peak maximum with the one from the down slope or peak end which is used as a reference spectra for statistical calculation. Basic acceptance criteria for evaluation of various validation paramerers are summerized 21
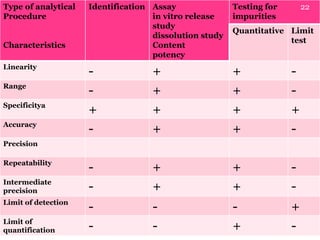
- 22. Type of analytical Procedure Characteristics Identification Assay in vitro release study dissolution study Content potency Testing for impurities Quantitative Limit test Linearity - + + - Range - + + - Specificitya + + + + Accuracy - + + - Precision Repeatability - + + - Intermediate precision - + + - Limit of detection - - - + Limit of quantification - - + - 22
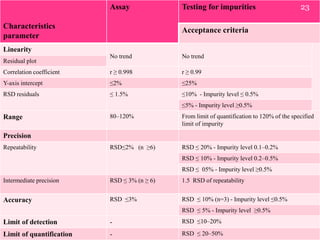
- 23. Characteristics parameter Assay Testing for impurities Acceptance criteria Linearity No trend No trend Residual plot Correlation coefficient r  0.998 r  0.99 Y-axis intercept 2% 25% RSD residuals  1.5% 10% - Impurity level  0.5% 5% - Impurity level 0.5% Range 80120% From limit of quantification to 120% of the specified limit of impurity Precision Repeatability RSD2% (n 6) RSD  20% - Impurity level 0.10.2% RSD  10% - Impurity level 0.20.5% RSD  05% - Impurity level 0.5% Intermediate precision RSD  3% (n  6) 1.5 RSD of repeatability Accuracy RSD 3% RSD  10% (n=3) - Impurity level 0.5% RSD  5% - Impurity level 0.5% Limit of detection - RSD 1020% Limit of quantification - RSD  2050% 23
- 24. 24