際際滷

際際滷Share a Scribd company logo
Instructor Performance
Summary
Prepared for: Carrie Williams
Aug01, 2015  Aug31, 2015
ReportDate: Aug31, 2015
ReportRun By: cwilliamsaz15
Benchmark: Onlymy company
2
Contents
Summary ...........................................................................................................................................3
Top/Bottom Analysis ..........................................................................................................................5
Trend Analysis....................................................................................................................................7
Qualitative Feedback ..........................................................................................................................9
Next Steps........................................................................................................................................10
Appendix  Report Criteria................................................................................................................11
3
Summary
Performance by Instructor QuestionCategory:
The graph below rankslearnersatisfactionforeach of the questions withinthe Instructorquestion
category,representedbythe percentof learnersthatselectedthe toptworesponse options.The
benchmark can helpyou gauge relative performance. The questionsatthe topof the listrepresentareas
inwhichyour learnersare mostsatisfied,whereasthose atthe bottom may representareasfor
improvement.
0 20 40 60 80 100
The instructor provided real-world experiences and
examples. (N=49)
The instructor''s presentation skills were adequate.
(N=49)
Instructor overall (N=49)
The instructor was knowledgeable about the
subject. (N=49)
Participants were encouraged to take part in class
discussions. (N=49)
Instructor Question Category Ranking
Percent Selection of Top Two Box Only my company Benchmark
4
Performance vs. Benchmark:
The graph below displaysthe difference,inpercentagepoints,between top-twobox selections foryour
learnersvs.the benchmark. Positive numbersindicate that yourlearnersatisfaction forthatquestion
exceededthe benchmark, andnegativenumbersindicatelearnerswere lesssatisfiedinthatareathan
the benchmark.Thisgraph shouldhelpyouhighlightyoursuccesses,aswell asprioritizeareas for
improvement.
0
0
0
0
0
0 0.1 0.2 0.3 0.4 0.5 0.6 0.7 0.8 0.9 1
Instructor overall (N=49)
Participants were encouraged to take part in class
discussions. (N=49)
The instructor provided real-world experiences and
examples. (N=49)
The instructor was knowledgeable about the subject.
(N=49)
The instructor''s presentation skills were adequate.
(N=49)
Difference fromOnly my company
5
Top/Bottom Analysis
Thissection displaysyourtopandbottomperforming coursesand classes.Eachgraph displaysthe top
performersfirst,followedbythe bottomperformers.Whenanalyzingperformance,rememberto
considerthe numberof evaluationscollectedtodetermine if actioniswarranted.
Top/BottomCourses:
Belowisthe Instructorquestioncategoryaverage fromthe PostEventevaluationforthe one course
includedinthe dataset.Instructorratingswithinthe toptwopointsonthe scale indicate general
satisfactionfromyourlearners.
8.57
1 2 3 4 5 6 7 8 9
Excel 2013 - Part 1 (N=19)
Course
6
Top/BottomClasses:
Belowisthe Instructorquestioncategoryaverage fromthe PostEventevaluationforthe one class
includedinthe dataset.Instructorratingswithinthe toptwopointsonthe scale indicate general
satisfactionfromyourlearners.
8.75
1 2 3 4 5 6 7 8 9
Excel 2013 - Part 1 Aug 27, 2015 (N=13)
Class
7
Trend Analysis
The graphs belowdisplaytrendsbasedonratingsandnumberof post-eventevaluations.Use these
graphs tomonitorprogresstowardgoalsand identifychangesinyourperformanceoractivitythat
warrant furtherinvestigation.
Activity Trend:
The trend belowshowsthe numberof PostEventevaluationscollectedforatleast six months foreach
LearningMethodology.Thiscanbe usedto understandthe numberof learnersyouare impacting,and
may helpyoupinpoint whereresponse ratesare lowerthananticipated. These activitytrendscanalso
provide the contextforinterpretingthe subsequentPerformance Trendreport.
0
10
20
30
40
50
60
Activity Trend by Learning Methodology
Self paced non web based Instructor Led-Public Instructor Led
8
Performance Trend:
The graph belowdisplaysamonthlytrendof the overall PostEventaverage of the Courseware,
Instructorand JobImpact questioncategories.Improvementsinyourperformanceasan instructor
shouldresultinthe Instructoraverage trend line movingup.Downwardtrendswarrantreview and
couldindicate opportunitiesforimprovementindeliveringcertaincoursesorto specificsegmentsof
learners.
Impactingjobperformance isthe primarygoal of most training.The degree towhichthisisachievedcan
be heavilyinfluencedbythe instructorsabilitytodeliverthe courseware. Byprovidingon-the-job
examplesandencouragingdiscussionandpractice inclass,the instructorcan improve the perceptionof
the courseware qualityandultimatelythe jobimpactof the training.If the Courseware andJobImpact
trendlinesare lowerthanyourInstructortrendline,considerwaysthatyoucouldchange your
facilitationtoimprove thoseareas.
1
2
3
4
5
6
7
8
9
PerformanceTrend By Question Category
Instructor
9
Qualitative Feedback
The commentsbeloware extractedfromthe highestandlowestratedclassesdisplayedinthe
Top/BottomClassessection. Thesecommentsshouldbe usedto gaininsightintothe reasonsbehindthe
quantitative feedbackprovidedbylearnersontheirexperience. Use thisdatawithotherreports to
determine whatisworkingwell,aswell asareasfor improvement.
Excel 2013 - Part 1 Aug 27,
2015
Date: Aug 27, 2015 Location: New Horizons - San
Diego
Comments:(Instructor)
 Great Instructor,wouldlove tolearnfromheragain!!!
 bothInstructorswere veryhelpful.lookingforwardtoreturningforpart2 of Excel
 Great instruction.Veryknowledgeable instructor.
10
Next Steps
Investigate Further:
In Metricsthat Matter速,you have a numberof reportsavailable forinvestigatingthe resultsyousee in
thisreport.Here are a fewsuggestionstogetyoustarted:
 Quick Question:Filtertoa single element(course,instructor,demographic) andinclude
commentstoidentifystrengthsandopportunitiesforimprovement. Inthe SetPreferences area,
youcan setthisreportto delivertoyouautomaticallyaftereachclass.
 Crosstab: Use thisreportto compare the resultsof one itemby anothertopinpointspecific
areas forimprovement.Forexample,runaCrosstabreport byCourse vs.QuestionCategoryto
see whataspectsof eachcourse are ratedhighor low.
Identify Development Opportunities:
Use the resultsinthisreportfor continuousimprovementandself-development.Be aware of specific
areas of instructionthatyoucan improve upon,such as demonstratingknowledge of the subjectmatter
or keepingthe learnersengagedthroughoutthe class.If there are coursesforwhichyouare lessskilled
at facilitating,findotherinstructorswhohave hadsuccessinteachingthose coursesandtalkabout best
practicesor audita class withthem.
Communicate Successes:
Share the resultswithyourmanager or employeranddiscusswaystofurtherleverage yourstrengths.
11
Appendix  Report Criteria
Attribute Item
Category Instructor

More Related Content

Viewers also liked (8)

PPTX
Character Backstories
Boxheadd05
DOCX
Cv bahia dangor july 2015
Bahia Dangor
PPTX
02 beginning code first
Maxim Shaptala
PPTX
The board of judges
Cristina Tarriga
PPTX
潟禧超低≪ゃ≪鴻宴
nowmura
PDF
Hinnerup har lige f奪et et nyt yndlingsv脱rksted
CarPeople - Danmarks nye yndlingsv脱rksted
PPTX
Industry interview
AWright97
Character Backstories
Boxheadd05
Cv bahia dangor july 2015
Bahia Dangor
02 beginning code first
Maxim Shaptala
The board of judges
Cristina Tarriga
潟禧超低≪ゃ≪鴻宴
nowmura
Hinnerup har lige f奪et et nyt yndlingsv脱rksted
CarPeople - Danmarks nye yndlingsv脱rksted
Industry interview
AWright97

Similar to InstructorPerformanceSummary__Carrie_Williams8 2015 (20)

PPTX
PERFORMANCE MANAGEMENT-8615
EqraBaig
PPTX
How Learning Analytics Can Improve Corporate Training
Lambda Solutions
PPT
Performance Management And Appraisal - HRM
FaHaD .H. NooR
PPS
Evaluating Learners Achievement
Sue Alsaleem
PPTX
Why is training Evaluation important in food service manager.
MarkLopez864326
PDF
Training program effectiveness a measuring instrument (1)
TheGrowthFactor
PPTX
Tips for Driving Learning Success with Moodle LMS Reporting
Lambda Solutions
PDF
Six Sigma Yellow Belt Program | Learning Meaningfully
Teki Repalda
PDF
THE IMPERATIVE TO BUILD A RESILIENT AND AGILE ORGANIZATIONONE MINDSET AT A TIME
Human Capital Media
PDF
BUSTING E-LEARNING MYTHS: SEPARATING EFFECTIVE TRAINING FROM TRENDS
Human Capital Media
PDF
BUSTING E-LEARNING MYTHS: SEPARATING EFFECTIVE TRAINING FROM TRENDS
Human Capital Media
PPTX
Module 8: Assessment and Evaluation
Cardet1
PDF
Set For Success: Get Maximum Results from Performance Reviews
ComplyRight, Inc.
PDF
Carnegie Foundation Summit on Improvement in Education: Driver Diagrams
Next Generation Learning Challenges
PDF
Analytics in Training & Development and ROI in T & D
Dr. Nilesh Thakre
PPTX
HRM ch 8 training.pptx
basmaisameil
PDF
AIHR_Measuring_Learning_Effectiveness.pdf
YodhyPrabuJaya
PPT
Giving training a purpose
HarshVardhan1
PPTX
More than just a score: supercharging the value in your assessment
Richard Brecknell
PPTX
Tips for Driving Learning Success with Moodle LMS Reporting
Lambda Solutions
PERFORMANCE MANAGEMENT-8615
EqraBaig
How Learning Analytics Can Improve Corporate Training
Lambda Solutions
Performance Management And Appraisal - HRM
FaHaD .H. NooR
Evaluating Learners Achievement
Sue Alsaleem
Why is training Evaluation important in food service manager.
MarkLopez864326
Training program effectiveness a measuring instrument (1)
TheGrowthFactor
Tips for Driving Learning Success with Moodle LMS Reporting
Lambda Solutions
Six Sigma Yellow Belt Program | Learning Meaningfully
Teki Repalda
THE IMPERATIVE TO BUILD A RESILIENT AND AGILE ORGANIZATIONONE MINDSET AT A TIME
Human Capital Media
BUSTING E-LEARNING MYTHS: SEPARATING EFFECTIVE TRAINING FROM TRENDS
Human Capital Media
BUSTING E-LEARNING MYTHS: SEPARATING EFFECTIVE TRAINING FROM TRENDS
Human Capital Media
Module 8: Assessment and Evaluation
Cardet1
Set For Success: Get Maximum Results from Performance Reviews
ComplyRight, Inc.
Carnegie Foundation Summit on Improvement in Education: Driver Diagrams
Next Generation Learning Challenges
Analytics in Training & Development and ROI in T & D
Dr. Nilesh Thakre
HRM ch 8 training.pptx
basmaisameil
AIHR_Measuring_Learning_Effectiveness.pdf
YodhyPrabuJaya
Giving training a purpose
HarshVardhan1
More than just a score: supercharging the value in your assessment
Richard Brecknell
Tips for Driving Learning Success with Moodle LMS Reporting
Lambda Solutions
Ad

More from Carrie E. Williams (20)

PDF
Understanding Your Customer dsp_certificate
Carrie E. Williams
PDF
Taking Your High Tech Product to Market dsp_certificate
Carrie E. Williams
PDF
Young Entrepreneurs dsp_certificate
Carrie E. Williams
PDF
Encore Entrepreneurs Introduction to Starting Your Own Business dsp_certificate
Carrie E. Williams
PDF
How to Win Federal Contracts dsp_certificate
Carrie E. Williams
PDF
Stratregic Planning dsp_certificate
Carrie E. Williams
PDF
Mentor Protege Program Certificate of Completion
Carrie E. Williams
PDF
Transcripts.oxps
Carrie E. Williams
PDF
Master
Carrie E. Williams
PDF
CompTIA CTT+ Classroom Trainer certificate
Carrie E. Williams
PDF
Ranking_Learning_Providers 1 2016 to 10 2016
Carrie E. Williams
PDF
Report_Card 9 2016
Carrie E. Williams
PDF
Report_Card August 2016
Carrie E. Williams
PDF
Report_Card July 2016
Carrie E. Williams
PDF
Report_Card June 2016
Carrie E. Williams
PDF
1000 report
Carrie E. Williams
PDF
Report_Card 945
Carrie E. Williams
PDF
Report_Card May 2016
Carrie E. Williams
PDF
Report_Card1
Carrie E. Williams
PDF
Report_Card March 2016
Carrie E. Williams
Understanding Your Customer dsp_certificate
Carrie E. Williams
Taking Your High Tech Product to Market dsp_certificate
Carrie E. Williams
Young Entrepreneurs dsp_certificate
Carrie E. Williams
Encore Entrepreneurs Introduction to Starting Your Own Business dsp_certificate
Carrie E. Williams
How to Win Federal Contracts dsp_certificate
Carrie E. Williams
Stratregic Planning dsp_certificate
Carrie E. Williams
Mentor Protege Program Certificate of Completion
Carrie E. Williams
Transcripts.oxps
Carrie E. Williams
CompTIA CTT+ Classroom Trainer certificate
Carrie E. Williams
Ranking_Learning_Providers 1 2016 to 10 2016
Carrie E. Williams
Report_Card 9 2016
Carrie E. Williams
Report_Card August 2016
Carrie E. Williams
Report_Card July 2016
Carrie E. Williams
Report_Card June 2016
Carrie E. Williams
1000 report
Carrie E. Williams
Report_Card 945
Carrie E. Williams
Report_Card May 2016
Carrie E. Williams
Report_Card1
Carrie E. Williams
Report_Card March 2016
Carrie E. Williams
Ad

InstructorPerformanceSummary__Carrie_Williams8 2015

  • 1. Instructor Performance Summary Prepared for: Carrie Williams Aug01, 2015 Aug31, 2015 ReportDate: Aug31, 2015 ReportRun By: cwilliamsaz15 Benchmark: Onlymy company
  • 2. 2 Contents Summary ...........................................................................................................................................3 Top/Bottom Analysis ..........................................................................................................................5 Trend Analysis....................................................................................................................................7 Qualitative Feedback ..........................................................................................................................9 Next Steps........................................................................................................................................10 Appendix Report Criteria................................................................................................................11
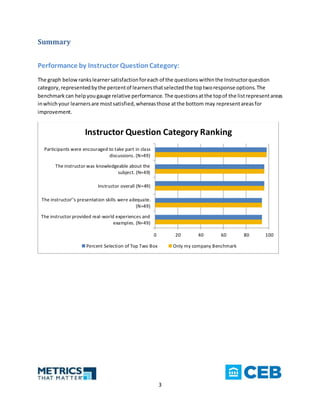
  • 3. 3 Summary Performance by Instructor QuestionCategory: The graph below rankslearnersatisfactionforeach of the questions withinthe Instructorquestion category,representedbythe percentof learnersthatselectedthe toptworesponse options.The benchmark can helpyou gauge relative performance. The questionsatthe topof the listrepresentareas inwhichyour learnersare mostsatisfied,whereasthose atthe bottom may representareasfor improvement. 0 20 40 60 80 100 The instructor provided real-world experiences and examples. (N=49) The instructor''s presentation skills were adequate. (N=49) Instructor overall (N=49) The instructor was knowledgeable about the subject. (N=49) Participants were encouraged to take part in class discussions. (N=49) Instructor Question Category Ranking Percent Selection of Top Two Box Only my company Benchmark
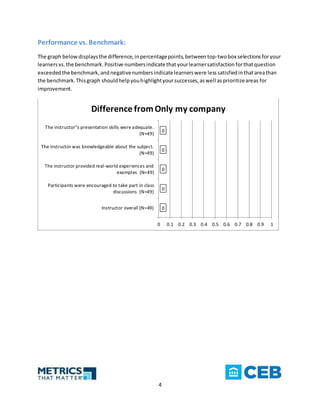
  • 4. 4 Performance vs. Benchmark: The graph below displaysthe difference,inpercentagepoints,between top-twobox selections foryour learnersvs.the benchmark. Positive numbersindicate that yourlearnersatisfaction forthatquestion exceededthe benchmark, andnegativenumbersindicatelearnerswere lesssatisfiedinthatareathan the benchmark.Thisgraph shouldhelpyouhighlightyoursuccesses,aswell asprioritizeareas for improvement. 0 0 0 0 0 0 0.1 0.2 0.3 0.4 0.5 0.6 0.7 0.8 0.9 1 Instructor overall (N=49) Participants were encouraged to take part in class discussions. (N=49) The instructor provided real-world experiences and examples. (N=49) The instructor was knowledgeable about the subject. (N=49) The instructor''s presentation skills were adequate. (N=49) Difference fromOnly my company
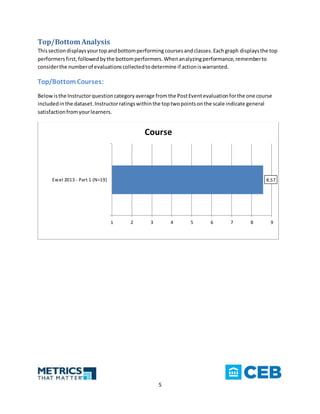
  • 5. 5 Top/Bottom Analysis Thissection displaysyourtopandbottomperforming coursesand classes.Eachgraph displaysthe top performersfirst,followedbythe bottomperformers.Whenanalyzingperformance,rememberto considerthe numberof evaluationscollectedtodetermine if actioniswarranted. Top/BottomCourses: Belowisthe Instructorquestioncategoryaverage fromthe PostEventevaluationforthe one course includedinthe dataset.Instructorratingswithinthe toptwopointsonthe scale indicate general satisfactionfromyourlearners. 8.57 1 2 3 4 5 6 7 8 9 Excel 2013 - Part 1 (N=19) Course
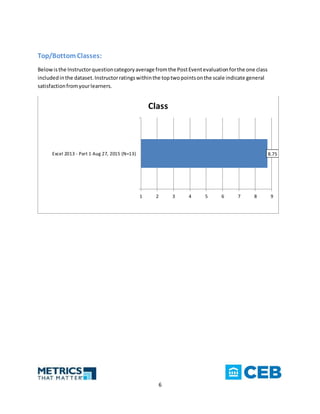
  • 6. 6 Top/BottomClasses: Belowisthe Instructorquestioncategoryaverage fromthe PostEventevaluationforthe one class includedinthe dataset.Instructorratingswithinthe toptwopointsonthe scale indicate general satisfactionfromyourlearners. 8.75 1 2 3 4 5 6 7 8 9 Excel 2013 - Part 1 Aug 27, 2015 (N=13) Class
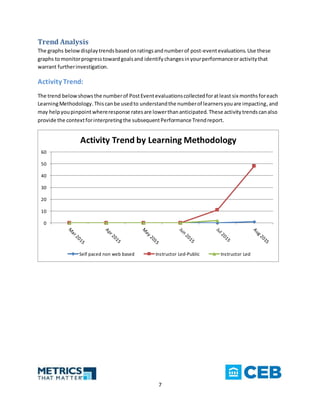
  • 7. 7 Trend Analysis The graphs belowdisplaytrendsbasedonratingsandnumberof post-eventevaluations.Use these graphs tomonitorprogresstowardgoalsand identifychangesinyourperformanceoractivitythat warrant furtherinvestigation. Activity Trend: The trend belowshowsthe numberof PostEventevaluationscollectedforatleast six months foreach LearningMethodology.Thiscanbe usedto understandthe numberof learnersyouare impacting,and may helpyoupinpoint whereresponse ratesare lowerthananticipated. These activitytrendscanalso provide the contextforinterpretingthe subsequentPerformance Trendreport. 0 10 20 30 40 50 60 Activity Trend by Learning Methodology Self paced non web based Instructor Led-Public Instructor Led
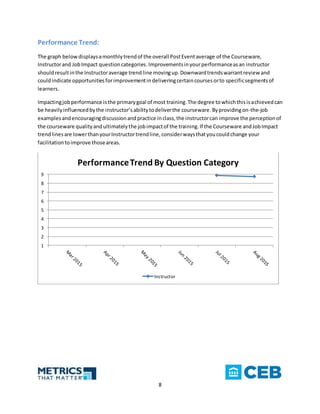
  • 8. 8 Performance Trend: The graph belowdisplaysamonthlytrendof the overall PostEventaverage of the Courseware, Instructorand JobImpact questioncategories.Improvementsinyourperformanceasan instructor shouldresultinthe Instructoraverage trend line movingup.Downwardtrendswarrantreview and couldindicate opportunitiesforimprovementindeliveringcertaincoursesorto specificsegmentsof learners. Impactingjobperformance isthe primarygoal of most training.The degree towhichthisisachievedcan be heavilyinfluencedbythe instructorsabilitytodeliverthe courseware. Byprovidingon-the-job examplesandencouragingdiscussionandpractice inclass,the instructorcan improve the perceptionof the courseware qualityandultimatelythe jobimpactof the training.If the Courseware andJobImpact trendlinesare lowerthanyourInstructortrendline,considerwaysthatyoucouldchange your facilitationtoimprove thoseareas. 1 2 3 4 5 6 7 8 9 PerformanceTrend By Question Category Instructor
  • 9. 9 Qualitative Feedback The commentsbeloware extractedfromthe highestandlowestratedclassesdisplayedinthe Top/BottomClassessection. Thesecommentsshouldbe usedto gaininsightintothe reasonsbehindthe quantitative feedbackprovidedbylearnersontheirexperience. Use thisdatawithotherreports to determine whatisworkingwell,aswell asareasfor improvement. Excel 2013 - Part 1 Aug 27, 2015 Date: Aug 27, 2015 Location: New Horizons - San Diego Comments:(Instructor) Great Instructor,wouldlove tolearnfromheragain!!! bothInstructorswere veryhelpful.lookingforwardtoreturningforpart2 of Excel Great instruction.Veryknowledgeable instructor.
  • 10. 10 Next Steps Investigate Further: In Metricsthat Matter速,you have a numberof reportsavailable forinvestigatingthe resultsyousee in thisreport.Here are a fewsuggestionstogetyoustarted: Quick Question:Filtertoa single element(course,instructor,demographic) andinclude commentstoidentifystrengthsandopportunitiesforimprovement. Inthe SetPreferences area, youcan setthisreportto delivertoyouautomaticallyaftereachclass. Crosstab: Use thisreportto compare the resultsof one itemby anothertopinpointspecific areas forimprovement.Forexample,runaCrosstabreport byCourse vs.QuestionCategoryto see whataspectsof eachcourse are ratedhighor low. Identify Development Opportunities: Use the resultsinthisreportfor continuousimprovementandself-development.Be aware of specific areas of instructionthatyoucan improve upon,such as demonstratingknowledge of the subjectmatter or keepingthe learnersengagedthroughoutthe class.If there are coursesforwhichyouare lessskilled at facilitating,findotherinstructorswhohave hadsuccessinteachingthose coursesandtalkabout best practicesor audita class withthem. Communicate Successes: Share the resultswithyourmanager or employeranddiscusswaystofurtherleverage yourstrengths.
  • 11. 11 Appendix Report Criteria Attribute Item Category Instructor