Intro to Polynomials
Download as pptx, pdf2 likes2,396 views

This document discusses polynomial functions and how to graph them. It defines a polynomial as a sum of terms with non-negative integer exponents. Polynomial graphs are smooth curves that may be lines, parabolas, or higher-order curves. To graph a polynomial, one determines the end behavior from the leading term, finds the x-intercepts by setting the polynomial equal to 0, and uses intercepts and test points to plot the graph over intervals. Multiplicity of roots affects whether the graph crosses or is tangent to the x-axis at those points.
1 of 12
Downloaded 30 times
Ad
Recommended
Polynomial functions
Polynomial functionsJessica Garcia
╠²
The document defines and provides examples of polynomial functions. It discusses that a polynomial is a sum of monomials with whole number exponents. A polynomial function can be written in standard form as a polynomial equation with variables and coefficients. The degree of a polynomial is the highest exponent, and the leading coefficient is the coefficient of the term with the highest degree. Examples are provided of evaluating polynomial functions for different variable values.Lecture 8 section 3.2 polynomial equations
Lecture 8 section 3.2 polynomial equationsnjit-ronbrown
╠²
This document discusses polynomial functions. It defines polynomial functions as functions of the form f(x) = anx^n + an-1x^(n-1) + ... + a1x + a0, where n is a nonnegative integer and the coefficients are real numbers. It discusses key properties of polynomial functions including their domain, continuity, end behavior determined by the leading term, real zeros, turning points, and graphing. The document provides examples illustrating these concepts.Notes - Graphs of Polynomials
Notes - Graphs of PolynomialsLori Rapp
╠²
The document discusses graphing and interpreting various polynomial functions using a graphing calculator. It examines the graphs of y=x-1, y=x^2-4, and y=x^3+x^2-12 to note their similarities and differences in terms of degree, number of turns, and x-intercepts. It then explores how changing the coefficients of a cubic function impacts its graph. Finally, it interprets key features of the graph of y=x^3-5x^2+x-5 such as its degree, number of turns, x-intercept, maximum and minimum points.3 2 Polynomial Functions And Their Graphs
3 2 Polynomial Functions And Their Graphssilvia
╠²
Polynomial functions have graphs that are smooth and continuous curves without sharp corners or breaks. Odd-degree polynomials have opposite behavior at their ends, while even-degree polynomials have the same behavior. The x-intercepts of a polynomial function are its zeros, which are found by setting the polynomial equal to 0. A polynomial function's graph can have at most n-1 turning points if the function is of degree n.Polynomial Function by Desirae &
Polynomial Function by Desirae & Hope Scott
╠²
A polynomial function is an expression of finite length that can be written as the sum of one or more non-zero terms. For example, x^2-x/4+7 is a polynomial. Polynomials are used to model real-world phenomena like the concentration of a drug in blood over time or the number of hexagons in a honeycomb pattern. Polynomial functions have applications in nature and the real world.Graphing polynomial functions (Grade 10)
Graphing polynomial functions (Grade 10)grace joy canseco
╠²
This document provides instructions on graphing polynomial functions. It discusses identifying the roots, x-intercepts, and y-intercept from the factored form of the polynomial. It shows working through an example of graphing the function y = (x ŌĆō 2)(x ŌĆō 1)(x + 3). The key steps are:
1. Identify the roots and y-intercept
2. Arrange the roots in a table
3. Complete the table by calculating y-values for different x-values
4. Plot the points on a graph
5. Sketch the graphModule 2 Lesson 2 Notes
Module 2 Lesson 2 Notestoni dimella
╠²
This document defines polynomial functions and discusses their key properties. It defines polynomials as expressions with real number coefficients and positive integer exponents. Examples of polynomials and non-polynomials are provided. The document discusses defining polynomials by degree or number of terms, and classifying specific polynomials. It covers finding zeros of polynomial functions and their multiplicities. The document also addresses end behavior of polynomials based on the leading coefficient and degree. It provides an example of analyzing a polynomial function by defining it, finding zeros and multiplicities, describing end behavior, and sketching its graph.Polynomial Function and Synthetic Division
Polynomial Function and Synthetic DivisionAleczQ1414
╠²
This document explains polynomial functions, including their definition, classification by degree, and the method to graph them using specific x-values. It also describes synthetic division, a technique used for polynomial division and finding zeros. Several examples demonstrate these concepts with polynomial expressions and corresponding calculations.Polynomial functions
Polynomial functionsdedearfandy
╠²
This document discusses polynomial functions. A polynomial is a sum of monomials, and a polynomial function with a single variable is called a polynomial function. The degree of a polynomial is the highest exponent of its variable, and the leading coefficient is the coefficient of the term with the highest degree. Polynomial functions are classified based on their degree as linear, quadratic, cubic, etc. The document also discusses evaluating polynomial functions for different inputs, the general shapes of polynomial functions based on degree and leading coefficient, and the remainder and factor theorems.Sim(mathematics 10 polynomial functions)
Sim(mathematics 10 polynomial functions) ileen menes
╠²
The document provides information about graphing polynomial functions, including:
1) How to determine the degree, leading coefficient, intercepts, and behavior of a polynomial function graph from its standard and factored forms. Activities are provided to match polynomial functions and determine intercepts.
2) How to use the leading coefficient test to determine if a polynomial graph rises or falls on the left and right sides based on whether the leading coefficient is positive or negative and if the degree is odd or even. Examples analyze the behavior of specific polynomial function graphs.
3) How to sign a table to summarize the intercepts, degree, leading coefficient, and behavior of polynomial function graphs. Students are asked to graph specific functions and6.3 evaluating-and-graphing-polynomila-functions
6.3 evaluating-and-graphing-polynomila-functionsmorrobea
╠²
This document discusses polynomial functions. It defines polynomial functions as functions of the form f(x) = anxn + an-1xn-1 + ... + a1x + a0, where the exponents are whole numbers. It describes the leading coefficient, constant term, and degree of a polynomial function. Common types of polynomial functions like constant, linear, quadratic, cubic, and quartic functions are summarized. Methods for identifying if a function is a polynomial function, evaluating polynomial functions using direct substitution and synthetic substitution, and determining the left and right behavior of a polynomial function's graph are also discussed.3.3 Zeros of Polynomial Functions
3.3 Zeros of Polynomial Functionssmiller5
╠²
This document discusses key concepts related to finding zeros of polynomial functions including:
1) The factor theorem, which states that a polynomial x - k is a factor of a function f(x) if and only if f(k) = 0.
2) The rational zeros theorem, which gives possible rational zeros based on the factors of the leading coefficient and constant term.
3) The fundamental theorem of algebra, which states that every polynomial of degree n has n complex zeros and examples of finding functions based on given zeros.
4) The conjugate zeros theorem, which states that if z = a + bi is a zero, then z = a - bi is also a zero for polynomials with real coefficients.
5Graphs of polynomial functions
Graphs of polynomial functionsCarlos Erepol
╠²
The document summarizes key characteristics of polynomial functions:
1) Polynomial functions produce smooth, continuous curves on their domains which are the set of real numbers.
2) The graph's x-intercepts, turning points, and absolute/relative maxima and minima are defined.
3) As the degree of a polynomial increases, so do the possible number of x-intercepts and turning points, up to the degree value. The leading coefficient and degree determine whether the graph rises or falls.Module 2 lesson 4 notes
Module 2 lesson 4 notestoni dimella
╠²
Parent functions are families of graphs that share unique properties. Transformations can move the graph around the plane. The main parent functions explored are the constant, linear, absolute value, quadratic, cubic, square root, cubic root, and exponential functions. Each has a characteristic shape and number of intercepts. Domains and ranges depend on the specific function but often extend to positive and negative infinity.Polynomial Functions
Polynomial Functionsnicole379865
╠²
This document provides an overview of key concepts in polynomial functions. It defines polynomials as functions where the exponents are positive whole numbers. It explains standard form, factored form, degrees, leading coefficients, roots, ends, and graphing behaviors. It also covers dividing polynomials using long division and synthetic division, and defines the remainder and factor theorems. Specifically, the remainder theorem states the remainder of dividing a polynomial f(x) by (x-k) is r=f(k), while the factor theorem says a polynomial f(x) has a factor (x-k) if and only if f(k)=0.Polynomial functionsandgraphs
Polynomial functionsandgraphsJerlyn Fernandez
╠²
This document discusses polynomial functions and their graphs. It defines polynomial functions as functions of the form P(x) = anxn + an-1xn-1 + ... + a1x + a0, where an is the leading coefficient. The degree of the polynomial determines features of its graph like the maximum number of x-intercepts. The leading coefficient test determines the end behavior of the graph. Key features of polynomial graphs are intercepts, extrema, and end behavior.Examples of different polynomial graphs
Examples of different polynomial graphsJessica Garcia
╠²
The document discusses polynomial functions and their properties. It defines turning points as points where the graph of a function changes from increasing to decreasing. It then categorizes common polynomial functions as constant, linear, quadratic, cubic, or quartic depending on their degree. It provides examples of each type of polynomial function and notes that the maximum number of zeros is equal to the degree of the polynomial function.Polynomial function
Polynomial functionDepartment of Education
╠²
The document defines a polynomial function as a function of the form f(x) = anxn + an-1xn-1 +...+ a0, where n is a nonnegative integer and an, an-1,...a0 are real numbers with an ŌēĀ 0. The degree of a polynomial is the highest exponent of its terms. Examples are provided to illustrate how to determine the degree and number of terms of polynomial functions. The document also asks questions to check understanding of identifying polynomial functions and determining their degree.Module 1 Lesson 1 Remediation Notes
Module 1 Lesson 1 Remediation Notestoni dimella
╠²
The document provides information about functions and relations. It defines a function as a relation where each x-value is paired with exactly one y-value. To determine if a relation is a function, it describes using the vertical line test, where a relation is a function if a vertical line can only intersect the graph at one point. It gives examples of applying the vertical line test to graphs and determining the domain and range of relations.4.6 Relations And Functions
4.6 Relations And Functionsguestd1dc2e
╠²
The document defines relations and functions. A relation is a set of ordered pairs where the domain is the set of x-values and the range is the set of y-values. A function is a relation where each domain value is paired with exactly one range value. The document provides examples of determining if a relation represents a function using the vertical line test and evaluating functions using function notation.Functions
FunctionsAnkit Bhandari
╠²
A function is a relation between a set of inputs (domain) and set of outputs (codomain) where each input is mapped to exactly one output. There are different types of functions such as one-to-one, onto, bijective, many-to-one, and inverse functions. Functions can be represented graphically or using function notation such as f(x). Common functions include polynomial, trigonometric, exponential, logarithmic, and composite functions which are the composition of two simpler functions.Different types of functions
Different types of functionsKatrina Young
╠²
This document defines and provides examples of different types of functions, including:
- Constant functions which always output the same number.
- Identity functions where the output is equal to the input.
- Polynomial functions defined by expressions involving powers of the variable.
- Absolute value functions which output the absolute value of the input.
- Square root functions which output the square root of the input.
- Rational functions where the output is a rational expression involving the input.
It also discusses the domain and range of these different function types.2.2 Polynomial Function Notes
2.2 Polynomial Function Noteslgemgnani
╠²
The document discusses polynomial functions, including how to graph common polynomials, find zeros of polynomials, and write polynomials given their roots. It provides examples of matching polynomial equations to their graphs, finding the real zeros of polynomials by factoring, and writing polynomials when given the roots. The document also covers how to use a graphing calculator to find the zeros of polynomials.Types of functions 05272011
Types of functions 05272011Boyet Aluan
╠²
The document discusses various types of functions including:
- Constant functions which assign the same real number to every element of the domain.
- Linear functions which have a degree of 1 and are defined by the equation f(x)=mx+b.
- Quadratic functions which are polynomial functions of degree 2.
- Cubic/power functions which are polynomial functions of degree 3.
It also briefly describes identity, absolute value, rational, and algebraic functions. The document concludes with instructions for a group activity on identifying different function types from graphs.Module 3 polynomial functions
Module 3 polynomial functionsdionesioable
╠²
This module discusses polynomial functions of degree greater than two. The key points are:
1. The graph of a third-degree polynomial has both a minimum and maximum point, while higher degree polynomials have one less turning point than their degree.
2. Methods like finding upper and lower bounds and Descartes' Rule of Signs can help determine properties of the graph like zeros.
3. Odd degree polynomials increase on the far left and right if the leading term is positive, and decrease if negative. Even degree polynomials increase on the far left and decrease on the far right, or vice versa.M1 L5 Remediation Notes
M1 L5 Remediation Notestoni dimella
╠²
This document discusses solving systems of equations and inequalities through three main methods: graphing, substitution, and elimination. It provides examples of each method. For graphing systems, it explains the three possibilities for the graphs: consistent systems with one solution where the lines intersect, inconsistent systems with no solution where the lines are parallel, and dependent systems with infinite solutions where the lines coincide. It then works through examples of using substitution and elimination to solve systems algebraically. [/SUMMARY]Relations and Functions
Relations and Functionstoni dimella
╠²
The document defines relations and functions. A relation is a set of ordered pairs, while a function is a special type of relation where each x-value is mapped to only one y-value. The domain is the set of x-values and the range is the set of y-values. Functions can be identified using the vertical line test or by mapping the relation to check if any x-values are mapped to multiple y-values. Evaluating functions involves substituting domain values into the function rule to find the corresponding range values.7.2 abs value function
7.2 abs value functionMichael Cellini
╠²
This document provides notes for a math chapter on absolute value and reciprocal functions. It covers graphing and expressing absolute value functions as piecewise functions. Key points include: absolute value is defined as the distance from zero on the number line; absolute value functions are continuous and have the same x-intercept as the linear function inside the absolute value; taking the absolute value of a quadratic function preserves the vertex but changes the range. Care must be taken with the domains of absolute value functions depending on if the coefficient of the x-term inside is positive or negative.Mathematics 10 Graphs of Polynomial Functions.pptx
Mathematics 10 Graphs of Polynomial Functions.pptxshahanieabbat3
╠²
This document focuses on the characteristics and behavior of polynomial functions, including the leading coefficient test, multiplicity of zeros, and the number of turning points. It provides instructions for activities related to identifying graphs of polynomial functions and describes how to analyze their behavior through various illustrative examples. Additionally, it discusses the continuous and smooth nature of polynomial graphs compared to non-polynomial graphs.Grade 10_Math-Lesson 2-3 Graphs of Polynomial Functions .pptx
Grade 10_Math-Lesson 2-3 Graphs of Polynomial Functions .pptxErlenaMirador1
╠²
The document discusses how to graph polynomial functions by determining:
1) The end behavior using the leading coefficient test
2) The maximum number of turning points from the degree of the polynomial
3) The x-intercepts by finding the zeros of the polynomial
4) The y-intercept by evaluating the polynomial at x=0
It provides examples of using these steps to graph various polynomial functions of degrees 1-5.More Related Content
What's hot (20)
Polynomial functions
Polynomial functionsdedearfandy
╠²
This document discusses polynomial functions. A polynomial is a sum of monomials, and a polynomial function with a single variable is called a polynomial function. The degree of a polynomial is the highest exponent of its variable, and the leading coefficient is the coefficient of the term with the highest degree. Polynomial functions are classified based on their degree as linear, quadratic, cubic, etc. The document also discusses evaluating polynomial functions for different inputs, the general shapes of polynomial functions based on degree and leading coefficient, and the remainder and factor theorems.Sim(mathematics 10 polynomial functions)
Sim(mathematics 10 polynomial functions) ileen menes
╠²
The document provides information about graphing polynomial functions, including:
1) How to determine the degree, leading coefficient, intercepts, and behavior of a polynomial function graph from its standard and factored forms. Activities are provided to match polynomial functions and determine intercepts.
2) How to use the leading coefficient test to determine if a polynomial graph rises or falls on the left and right sides based on whether the leading coefficient is positive or negative and if the degree is odd or even. Examples analyze the behavior of specific polynomial function graphs.
3) How to sign a table to summarize the intercepts, degree, leading coefficient, and behavior of polynomial function graphs. Students are asked to graph specific functions and6.3 evaluating-and-graphing-polynomila-functions
6.3 evaluating-and-graphing-polynomila-functionsmorrobea
╠²
This document discusses polynomial functions. It defines polynomial functions as functions of the form f(x) = anxn + an-1xn-1 + ... + a1x + a0, where the exponents are whole numbers. It describes the leading coefficient, constant term, and degree of a polynomial function. Common types of polynomial functions like constant, linear, quadratic, cubic, and quartic functions are summarized. Methods for identifying if a function is a polynomial function, evaluating polynomial functions using direct substitution and synthetic substitution, and determining the left and right behavior of a polynomial function's graph are also discussed.3.3 Zeros of Polynomial Functions
3.3 Zeros of Polynomial Functionssmiller5
╠²
This document discusses key concepts related to finding zeros of polynomial functions including:
1) The factor theorem, which states that a polynomial x - k is a factor of a function f(x) if and only if f(k) = 0.
2) The rational zeros theorem, which gives possible rational zeros based on the factors of the leading coefficient and constant term.
3) The fundamental theorem of algebra, which states that every polynomial of degree n has n complex zeros and examples of finding functions based on given zeros.
4) The conjugate zeros theorem, which states that if z = a + bi is a zero, then z = a - bi is also a zero for polynomials with real coefficients.
5Graphs of polynomial functions
Graphs of polynomial functionsCarlos Erepol
╠²
The document summarizes key characteristics of polynomial functions:
1) Polynomial functions produce smooth, continuous curves on their domains which are the set of real numbers.
2) The graph's x-intercepts, turning points, and absolute/relative maxima and minima are defined.
3) As the degree of a polynomial increases, so do the possible number of x-intercepts and turning points, up to the degree value. The leading coefficient and degree determine whether the graph rises or falls.Module 2 lesson 4 notes
Module 2 lesson 4 notestoni dimella
╠²
Parent functions are families of graphs that share unique properties. Transformations can move the graph around the plane. The main parent functions explored are the constant, linear, absolute value, quadratic, cubic, square root, cubic root, and exponential functions. Each has a characteristic shape and number of intercepts. Domains and ranges depend on the specific function but often extend to positive and negative infinity.Polynomial Functions
Polynomial Functionsnicole379865
╠²
This document provides an overview of key concepts in polynomial functions. It defines polynomials as functions where the exponents are positive whole numbers. It explains standard form, factored form, degrees, leading coefficients, roots, ends, and graphing behaviors. It also covers dividing polynomials using long division and synthetic division, and defines the remainder and factor theorems. Specifically, the remainder theorem states the remainder of dividing a polynomial f(x) by (x-k) is r=f(k), while the factor theorem says a polynomial f(x) has a factor (x-k) if and only if f(k)=0.Polynomial functionsandgraphs
Polynomial functionsandgraphsJerlyn Fernandez
╠²
This document discusses polynomial functions and their graphs. It defines polynomial functions as functions of the form P(x) = anxn + an-1xn-1 + ... + a1x + a0, where an is the leading coefficient. The degree of the polynomial determines features of its graph like the maximum number of x-intercepts. The leading coefficient test determines the end behavior of the graph. Key features of polynomial graphs are intercepts, extrema, and end behavior.Examples of different polynomial graphs
Examples of different polynomial graphsJessica Garcia
╠²
The document discusses polynomial functions and their properties. It defines turning points as points where the graph of a function changes from increasing to decreasing. It then categorizes common polynomial functions as constant, linear, quadratic, cubic, or quartic depending on their degree. It provides examples of each type of polynomial function and notes that the maximum number of zeros is equal to the degree of the polynomial function.Polynomial function
Polynomial functionDepartment of Education
╠²
The document defines a polynomial function as a function of the form f(x) = anxn + an-1xn-1 +...+ a0, where n is a nonnegative integer and an, an-1,...a0 are real numbers with an ŌēĀ 0. The degree of a polynomial is the highest exponent of its terms. Examples are provided to illustrate how to determine the degree and number of terms of polynomial functions. The document also asks questions to check understanding of identifying polynomial functions and determining their degree.Module 1 Lesson 1 Remediation Notes
Module 1 Lesson 1 Remediation Notestoni dimella
╠²
The document provides information about functions and relations. It defines a function as a relation where each x-value is paired with exactly one y-value. To determine if a relation is a function, it describes using the vertical line test, where a relation is a function if a vertical line can only intersect the graph at one point. It gives examples of applying the vertical line test to graphs and determining the domain and range of relations.4.6 Relations And Functions
4.6 Relations And Functionsguestd1dc2e
╠²
The document defines relations and functions. A relation is a set of ordered pairs where the domain is the set of x-values and the range is the set of y-values. A function is a relation where each domain value is paired with exactly one range value. The document provides examples of determining if a relation represents a function using the vertical line test and evaluating functions using function notation.Functions
FunctionsAnkit Bhandari
╠²
A function is a relation between a set of inputs (domain) and set of outputs (codomain) where each input is mapped to exactly one output. There are different types of functions such as one-to-one, onto, bijective, many-to-one, and inverse functions. Functions can be represented graphically or using function notation such as f(x). Common functions include polynomial, trigonometric, exponential, logarithmic, and composite functions which are the composition of two simpler functions.Different types of functions
Different types of functionsKatrina Young
╠²
This document defines and provides examples of different types of functions, including:
- Constant functions which always output the same number.
- Identity functions where the output is equal to the input.
- Polynomial functions defined by expressions involving powers of the variable.
- Absolute value functions which output the absolute value of the input.
- Square root functions which output the square root of the input.
- Rational functions where the output is a rational expression involving the input.
It also discusses the domain and range of these different function types.2.2 Polynomial Function Notes
2.2 Polynomial Function Noteslgemgnani
╠²
The document discusses polynomial functions, including how to graph common polynomials, find zeros of polynomials, and write polynomials given their roots. It provides examples of matching polynomial equations to their graphs, finding the real zeros of polynomials by factoring, and writing polynomials when given the roots. The document also covers how to use a graphing calculator to find the zeros of polynomials.Types of functions 05272011
Types of functions 05272011Boyet Aluan
╠²
The document discusses various types of functions including:
- Constant functions which assign the same real number to every element of the domain.
- Linear functions which have a degree of 1 and are defined by the equation f(x)=mx+b.
- Quadratic functions which are polynomial functions of degree 2.
- Cubic/power functions which are polynomial functions of degree 3.
It also briefly describes identity, absolute value, rational, and algebraic functions. The document concludes with instructions for a group activity on identifying different function types from graphs.Module 3 polynomial functions
Module 3 polynomial functionsdionesioable
╠²
This module discusses polynomial functions of degree greater than two. The key points are:
1. The graph of a third-degree polynomial has both a minimum and maximum point, while higher degree polynomials have one less turning point than their degree.
2. Methods like finding upper and lower bounds and Descartes' Rule of Signs can help determine properties of the graph like zeros.
3. Odd degree polynomials increase on the far left and right if the leading term is positive, and decrease if negative. Even degree polynomials increase on the far left and decrease on the far right, or vice versa.M1 L5 Remediation Notes
M1 L5 Remediation Notestoni dimella
╠²
This document discusses solving systems of equations and inequalities through three main methods: graphing, substitution, and elimination. It provides examples of each method. For graphing systems, it explains the three possibilities for the graphs: consistent systems with one solution where the lines intersect, inconsistent systems with no solution where the lines are parallel, and dependent systems with infinite solutions where the lines coincide. It then works through examples of using substitution and elimination to solve systems algebraically. [/SUMMARY]Relations and Functions
Relations and Functionstoni dimella
╠²
The document defines relations and functions. A relation is a set of ordered pairs, while a function is a special type of relation where each x-value is mapped to only one y-value. The domain is the set of x-values and the range is the set of y-values. Functions can be identified using the vertical line test or by mapping the relation to check if any x-values are mapped to multiple y-values. Evaluating functions involves substituting domain values into the function rule to find the corresponding range values.7.2 abs value function
7.2 abs value functionMichael Cellini
╠²
This document provides notes for a math chapter on absolute value and reciprocal functions. It covers graphing and expressing absolute value functions as piecewise functions. Key points include: absolute value is defined as the distance from zero on the number line; absolute value functions are continuous and have the same x-intercept as the linear function inside the absolute value; taking the absolute value of a quadratic function preserves the vertex but changes the range. Care must be taken with the domains of absolute value functions depending on if the coefficient of the x-term inside is positive or negative.Similar to Intro to Polynomials (20)
Mathematics 10 Graphs of Polynomial Functions.pptx
Mathematics 10 Graphs of Polynomial Functions.pptxshahanieabbat3
╠²
This document focuses on the characteristics and behavior of polynomial functions, including the leading coefficient test, multiplicity of zeros, and the number of turning points. It provides instructions for activities related to identifying graphs of polynomial functions and describes how to analyze their behavior through various illustrative examples. Additionally, it discusses the continuous and smooth nature of polynomial graphs compared to non-polynomial graphs.Grade 10_Math-Lesson 2-3 Graphs of Polynomial Functions .pptx
Grade 10_Math-Lesson 2-3 Graphs of Polynomial Functions .pptxErlenaMirador1
╠²
The document discusses how to graph polynomial functions by determining:
1) The end behavior using the leading coefficient test
2) The maximum number of turning points from the degree of the polynomial
3) The x-intercepts by finding the zeros of the polynomial
4) The y-intercept by evaluating the polynomial at x=0
It provides examples of using these steps to graph various polynomial functions of degrees 1-5.Grade 10_Math-Lesson 2-3 Graphs of Polynomial Functions .pptx
Grade 10_Math-Lesson 2-3 Graphs of Polynomial Functions .pptxErlenaMirador1
╠²
The document discusses how to graph polynomial functions by determining:
1) The end behavior using the leading coefficient test
2) The maximum number of turning points from the degree of the polynomial
3) The x-intercepts by finding the zeros of the polynomial
4) The y-intercept by evaluating the polynomial at x=0
It provides examples of using these steps to graph various polynomial functions of degrees 1-5.6.3 evaluating-and-graphing-polynomila-functions
6.3 evaluating-and-graphing-polynomila-functionsmorrobea
╠²
This document discusses polynomial functions. It defines polynomial functions as functions of the form f(x) = anxn + an-1xn-1 + ... + a1x + a0, where the exponents are whole numbers. It describes the leading coefficient, constant term, and degree of a polynomial function. Common types of polynomial functions like constant, linear, quadratic, cubic, and quartic functions are identified based on their degree. Methods for identifying if a function is a polynomial function, evaluating polynomial functions using direct substitution and synthetic substitution, and determining the left and right behavior of a polynomial function's graph are also discussed.Chapter 2_3 Polynomial Functions and Their Graphs _Blitzer 2_ _1_.ppt
Chapter 2_3 Polynomial Functions and Their Graphs _Blitzer 2_ _1_.pptzijunleong
╠²
Chapter 2_3 Polynomial Functions and Their Graphs _Blitzer 2_ _1_.pptend behavior.....pdf
end behavior.....pdfLunaLedezma3
╠²
This document discusses polynomial functions and their graphs. It begins by defining polynomial functions as functions of the form f(x) = anxn + an-1xn-1 + ... + a1x + a0, where the ai values are coefficients and n is a non-negative integer. It then outlines the objectives which are to understand the definition of polynomial functions, sketch power functions, determine end behavior and intercepts, find real zeros and their multiplicities, sketch graphs, and determine equations from graphs. Several examples are then provided to illustrate key concepts like determining if a function is polynomial, finding intercepts, and sketching graphs using a four step process.Unit 2.3
Unit 2.3Mark Ryder
╠²
This document discusses polynomial functions of higher degree and their applications in modeling. It covers graphs of polynomial functions, end behavior, zeros, the intermediate value theorem, and modeling. Key topics include transforming monomial graphs, finding extrema and zeros, applying the leading term test to determine end behavior, and using factorization to sketch graphs. The document provides examples and explanations of these polynomial concepts.G10_Daily Lesson Log_Second QUARTER.docx
G10_Daily Lesson Log_Second QUARTER.docxSinamarLaroyaRefuerz
╠²
The document outlines the daily lesson log for a Grade 10 mathematics class. It includes 4 sessions on the topic of polynomial functions. The objectives are to illustrate, find intercepts of, and graph polynomial functions. Examples are provided for identifying key features of polynomials like degree, leading coefficient, constant term, and finding x- and y-intercepts by setting the polynomial equal to 0 or using the factored form. The behavior of graphs is also discussed based on whether the degree is odd or even, and the sign of the leading coefficient.end behavior.....pptx
end behavior.....pptxLunaLedezma3
╠²
This document discusses polynomial functions and how to graph them. It begins by listing the objectives of understanding the definition of a polynomial function, sketching power functions, determining end behavior, intercepts, real zeros and their multiplicities, and sketching the graph. It then defines polynomial functions and provides examples of determining if a function is polynomial. It also discusses how to sketch power functions, determine end behavior, find intercepts, real zeros and their multiplicities, and use a four step process to sketch the graph of a polynomial function.Polynomial PowerPoint Presentation for CBSE
Polynomial PowerPoint Presentation for CBSEprimepaathshala
╠²
The document provides a comprehensive overview of polynomials, including definitions, classifications, and graphical representations. It covers topics such as the degrees of polynomials, types of polynomials (monomial, binomial, trinomial), and methods for finding zeroes and factorization. Additionally, it explains the relationship between zeroes and coefficients, along with step-by-step instructions for polynomial division.Grade 10_Daily Lesson Plan_2ND-QUARTER.docx
Grade 10_Daily Lesson Plan_2ND-QUARTER.docxMarielaCamba1
╠²
The document outlines a Grade 10 mathematics lesson focused on polynomial functions, including objectives, content standards, and learning competencies. It describes various activities for students to identify, illustrate, and analyze polynomial functions, as well as graphing techniques and the behavior of polynomial graphs in relation to their degree and leading coefficients. Additionally, it includes references to learning resources and instructional procedures to enhance student understanding.Polynomial functions modelllings
Polynomial functions modelllingsTarun Gehlot
╠²
The document outlines key concepts of polynomial and rational functions, including definitions, properties, and methods for graphing and solving equations involving these functions. It discusses the end behavior of graphs, techniques for finding zeros, theorems related to polynomial division, and characteristics of rational functions including asymptotes. Additionally, it covers polynomial inequalities and variations, establishing a comprehensive framework for understanding polynomial behavior and relationships.Day 5 examples u5w14
Day 5 examples u5w14jchartiersjsd
╠²
Polynomial functions are described by their degree and have certain characteristics. The graph of a polynomial is smooth and continuous without sharp corners. Odd degree polynomials rise on the left and fall on the right, while even degree polynomials rise on both sides. The number of x-intercepts and local maxima/minima are limited by the degree. Polynomials can be matched based on their degree, leading coefficient, even/odd nature, and number of x-intercepts and local extrema. The x-intercepts of a polynomial correspond to the roots of the equation, and a repeated root indicates a zero of higher multiplicity which affects the graph.New day 5 examples
New day 5 examplesjchartiersjsd
╠²
This document discusses the characteristics and properties of polynomial functions. It defines polynomials using standard form and describes how the degree of a polynomial is determined by the highest power of the variable. Polynomials can be classified based on being linear, quadratic, cubic, quartic, or quintic. The graph of a polynomial is smooth and continuous. Polynomials can also be described based on having an odd or even degree, and their end behavior is determined by the degree and leading coefficient. Key aspects for matching a polynomial function include considering its degree, leading coefficient, end behavior, number of x-intercepts and local extrema. The graph of a polynomial can be drawn by finding the x-intercepts from setting the polynomial equal to zero.5.2
5.2leblance
╠²
This document discusses polynomials, factors, zeros, and graphing polynomial functions. It contains the following key points:
1) A polynomial can be written in factored form by factoring out the greatest common factor and setting each linear factor equal to zero. The zeros of a polynomial function are its x-intercepts.
2) The Factor Theorem states that an expression x - a is a factor of a polynomial if and only if a is a zero of the related polynomial function.
3) To write a polynomial function given its zeros, write each zero as a linear factor and multiply the factors together. Multiple zeros have a linear factor that is repeated, called the multiplicity. The multiplicity indicates if thePolynomials lecture
Polynomials lectureAdnanBukhari13
╠²
A polynomial function is a function where all exponents are non-negative integers. It is of the form f(x) = anxn + an-1xn-1 + ... + a1x + a0, where n is a non-negative integer and the coefficients ai are real numbers. The degree of a polynomial is the highest exponent present, and the leading coefficient is the coefficient of the term with the highest degree. The end behavior of a polynomial function can be determined by looking at the sign of the leading coefficient and whether the highest degree is even or odd. A polynomial function has at most n real zeros, where n is its degree, and at most n-1 turning points.Graphing polynomials
Graphing polynomialsmakenziew1
╠²
The document discusses how to graph polynomials by determining the x-intercepts from the zeros of the polynomial, the y-intercept, and the behavior at infinity using the leading coefficient test. It provides details on how the multiplicity of zeros relates to whether x-intercepts cross or touch the x-axis, and whether the graph is flat at those points. An example graphing the polynomial f(x)=x^5-5x^4+10x^3-10x^2+5x-40 is worked through step-by-step.Graph of polynomial function
Graph of polynomial functionAllan Gulinao
╠²
The document discusses graphing polynomial functions. It begins by stating the learning objectives, which include identifying polynomial functions, using the leading coefficient test to determine graph end behavior, finding zeros, determining zero multiplicity, knowing the maximum number of turning points, and graphing polynomial functions. It then provides an introduction and definitions of key polynomial function concepts like leading term, leading coefficient, degree of a term and function, and the leading coefficient test. The document uses examples to demonstrate how to apply the leading coefficient test and find zeros and their multiplicities. It states that a polynomial can have at most n-1 turning points if it has degree n. Finally, it outlines the steps to graph a polynomial function.5.2 Power Functions and Polynomial Functions
5.2 Power Functions and Polynomial Functionssmiller5
╠²
This document explains power and polynomial functions, covering their definitions, forms, and characteristics, including degree and leading coefficients. It also discusses end behavior, turning points, intercepts, and how to determine these features through graphs and examples. Finally, it provides exercises for practice related to these concepts.Ad
More from toni dimella (20)
Parent functions and Transformations
Parent functions and Transformationstoni dimella
╠²
This document discusses transformations of parent functions. It defines a parent function as the simplest form of a function, such as y=x, y=x^2, etc. Transformations include horizontal and vertical shifts which move the graph left, right, up or down; stretches which multiply the y-values making the graph skinnier; shrinks which reduce the y-values making the graph fatter; and reflections which flip the graph over the x-axis. Examples are provided to demonstrate how to graph different transformations of common parent functions. The document concludes by describing the transformation y=4x-2-5 as a shrink by a factor of 4, a right shift of 2 units, and a down shift of 5Relations and Functions
Relations and Functionstoni dimella
╠²
The document discusses relations, functions, domains, and ranges. It defines a relation as a set of ordered pairs and a function as a relation where each x-value is mapped to only one y-value. It explains how to identify the domain and range of a relation, and use the vertical line test and mappings to determine if a relation is a function. Examples of evaluating functions are also provided.Multiplying Polynomials (no conjugates)
Multiplying Polynomials (no conjugates)toni dimella
╠²
This document discusses techniques for multiplying polynomials including FOIL, the double distributive property, and squaring binomials. It provides examples of squaring binomial expressions like (x + 3)2 by multiplying (x + 3) by itself using FOIL. The document also lists more example problems but does not show the solutions.Fractions, Decimals, and Percents
Fractions, Decimals, and Percentstoni dimella
╠²
This document defines decimals, fractions, and percents and provides steps for converting between them. Decimals are numbers with a decimal point, fractions show parts of a whole, and percents express amounts out of 100. To convert a fraction to a decimal, divide the numerator by the denominator. To convert a fraction to a percent, change it to a decimal then multiply by 100. Converting between other forms follows similar steps of changing the number to an equivalent decimal or percent value.C3 Study ║▌║▌▀Żs - MAT 151
C3 Study ║▌║▌▀Żs - MAT 151toni dimella
╠²
This document contains lecture slides about statistics for describing, exploring, and comparing data. It discusses measures of center such as the mean, median, and mode. It also discusses variance and standard deviation as measures of spread. Additional topics covered include finding the mode, determining if a value is unusually high or low based on the mean and standard deviation, calculating percentiles, and comparing the detail provided by different graphic displays of data.C2 Study ║▌║▌▀Żs - MAT 151
C2 Study ║▌║▌▀Żs - MAT 151toni dimella
╠²
The document contains multiple choice questions about summarizing and graphing data. It asks questions about outliers, frequency distributions, class boundaries, histograms, and types of charts including pie charts. One question asks the reader to use a pie chart showing housing types to find the number of people living in single family housing in a town of 12,200 people.C1 Study ║▌║▌▀Żs - MAT151
C1 Study ║▌║▌▀Żs - MAT151toni dimella
╠²
The document contains lecture slides on introductory statistics topics including definitions of population, quantitative vs qualitative data, types of measurement scales, and examples of different sampling methods and study designs. Key points covered are the definition of a population as the complete collection of all elements, examples of quantitative data like weights vs qualitative nominal categories, ordinal scales involving ranking, and retrospective study designs using existing historical data.C3 test Doc
C3 test Doctoni dimella
╠²
This document contains 16 logic and critical thinking problems involving statements, truth tables, logic symbols, validity of arguments, and Euler diagrams. The problems cover topics such as determining logical equivalences, constructing and analyzing truth tables, identifying inverse, converse and contrapositive statements, and determining the validity of arguments using logic rules or diagrams.C3 test
C3 testtoni dimella
╠²
This document contains 16 logic and critical thinking problems involving statements, truth tables, logic symbols, validity of arguments, and Euler diagrams. The problems cover topics such as determining logical equivalence, constructing and analyzing truth tables, identifying inverse, converse and contrapositive statements, and determining the validity of arguments using logic rules or diagrams.Intro to Logs
Intro to Logstoni dimella
╠²
The document introduces logarithms, defining them as the exponent that a fixed number (the base) must be raised to to equal the value. It provides examples of converting between logarithmic and exponential forms, and covers the key properties of logarithms including product, quotient, power, expanding, condensing, and the change of base formula.Logs
Logstoni dimella
╠²
The document introduces logarithms, defining them as the exponent that a base number must be raised to to equal the value. It provides examples of converting between logarithmic and exponential forms, and discusses properties of logarithms such as the product, quotient, and power properties. It also covers expanding, condensing, and changing the base of logarithmic expressions.Completing the Square
Completing the Squaretoni dimella
╠²
The document explains how to solve quadratic equations by completing the square. It defines a perfect square trinomial as having the form x^2 + bx + c, where c is the square of half of b. It provides steps for completing the square, which involves adding a constant term to both sides of the equation such that the left side becomes a perfect square trinomial that can be factorized. This process results in the solution(s) to the quadratic equation. Two examples demonstrating this process are included.Graph Quadratics
Graph Quadraticstoni dimella
╠²
The document discusses graphing quadratic functions in standard form (y=ax^2 + bx + c). It explains that the graph is a parabola that can open up or down depending on whether a is positive or negative. The line of symmetry for the parabola passes through the vertex and is given by the equation x=-b/2a. The steps to graph are: 1) find the line of symmetry, 2) plug the x-value into the original equation to find the vertex, 3) find two other points and reflect them across the line of symmetry.Composite functions
Composite functionstoni dimella
╠²
Composite functions are formed by taking the output of one function and using it as the input of another function. This is shown notationally as f(g(x)), where the result of g(x) is used as the input for f. Changing the order of the functions changes the result, as the output of the inner function determines the input to the outer function. Examples show evaluating composite functions by substituting the output of the inner function into the outer function and simplifying.Parallel and Perpendicular lines
Parallel and Perpendicular linestoni dimella
╠²
Parallel lines have the same slope and never intersect. Two lines are parallel if their slopes are equal. The equation of a line parallel to a given line can be found using the point-slope formula with the same slope.
Perpendicular lines intersect at a right angle. Two lines are perpendicular if the product of their slopes is -1. The equation of a line perpendicular to a given line can be found using the point-slope formula with the slope of the perpendicular line being the negative reciprocal of the given line's slope. Examples are provided of finding if lines are parallel or perpendicular and constructing parallel and perpendicular lines through a given point.Absolute Value Functions & Graphs - Module 4 and 5
Absolute Value Functions & Graphs - Module 4 and 5toni dimella
╠²
1) Absolute value functions have a V-shaped graph called the parent function y=|x|.
2) Absolute value functions can be graphed by identifying the vertex (x,y) coordinates using the equation, choosing x-values to plot points, and connecting the points.
3) Graphing calculators can also be used to graph absolute value functions by entering the equation in y=, using math mode to input the absolute value symbol, and graphing the function.Absolute Value Functions & Graphs
Absolute Value Functions & Graphstoni dimella
╠²
Absolute value functions have a V-shaped graph. There are three main ways to graph an absolute value function: using a table of values, using a graphing calculator, or interpreting the equation. The vertex of an absolute value graph is always the x-coordinate inside the absolute value signs. To graph, one finds the vertex and then plots additional points on either side, connecting them to form the V-shape. The number outside the absolute value signs moves the graph up or down, while the number inside moves it left or right.Applications of Systems
Applications of Systemstoni dimella
╠²
1) The document discusses solving systems of linear equations through examples involving finding unknown numbers, ticket sales, and mixture problems.
2) The examples show setting up the systems of equations, choosing variables to represent the unknowns, translating the word problems into algebraic equations, and solving the systems using substitution or addition methods.
3) The solutions are checked by substituting the values back into the original equations to verify the answers.Linear Modeling
Linear Modelingtoni dimella
╠²
The document provides instructions for using a graphing calculator to analyze data on the percentage of women practicing law from 1970 to 2000. It describes how to:
1) Enter the data into the calculator and create a scatter plot of the percentages over time.
2) Use the calculator to find the equation of the line of best fit as y = 0.059x - 104.51.
3) Plug 2010 into the equation to predict the percentage of women lawyers will be about 14.08% in 2010, though the prediction may not be accurate due to a low correlation.Ad
Intro to Polynomials
- 1. Polynomial Functions and Models Module 12
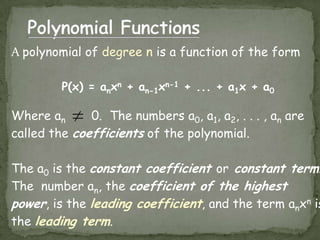
- 2. Polynomial FunctionsA polynomial of degree n is a function of the formP(x) = anxn + an-1xn-1 + ... + a1x + a0Where an 0. The numbers a0, a1, a2, . . . , an are called the coefficients of the polynomial. The a0is the constant coefficientorconstant term. The number an, the coefficient of the highest power, is the leading coefficient, and the term anxn is the leading term.
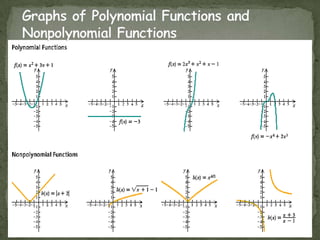
- 3. Graphs of Polynomial Functions and Nonpolynomial Functions
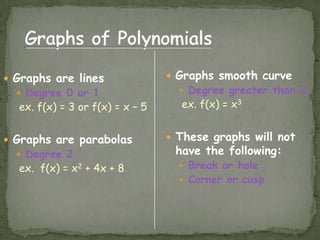
- 4. Graphs of PolynomialsGraphs smooth curveDegree greater than 2 ex. f(x) = x3These graphs will not have the following:Break or holeCorner or cuspGraphs are linesDegree 0 or 1 ex. f(x) = 3 or f(x) = x ŌĆō 5Graphs are parabolasDegree 2 ex. f(x) = x2 + 4x + 8
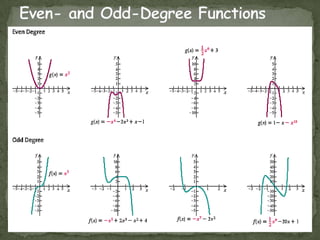
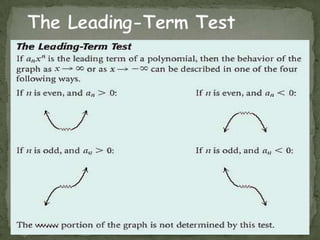
- 5. Even- and Odd-Degree Functions
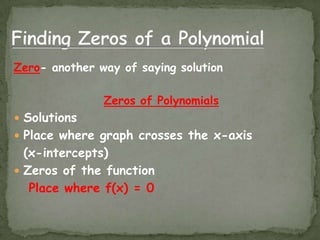
- 7. Finding Zeros of a PolynomialZero- another way of saying solutionZeros of PolynomialsSolutionsPlace where graph crosses the x-axis (x-intercepts)Zeros of the function Place where f(x) = 0
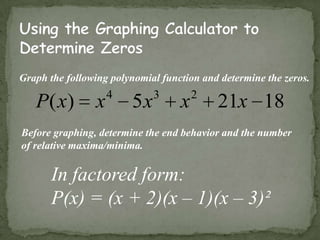
- 8. Using the Graphing Calculator to Determine ZerosGraph the following polynomial function and determine the zeros.Before graphing, determine the end behavior and the numberof relative maxima/minima.In factored form:P(x) = (x + 2)(x ŌĆō 1)(x ŌĆō 3)┬▓
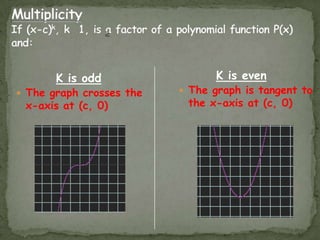
- 9. MultiplicityIf (x-c)k, k 1, is a factor of a polynomial function P(x) and:K is evenThe graph is tangent to the x-axis at (c, 0)K is oddThe graph crosses the x-axis at (c, 0)
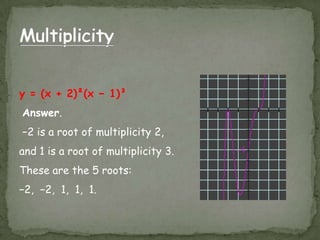
- 10. Multiplicityy = (x + 2)┬▓(x ŌłÆ 1)┬│╠²Answer.╠²╠²╠²ŌłÆ2 is a root of multiplicity 2, and 1 is a root of multiplicity 3. ╠²These are the 5 roots:ŌłÆ2, ╠²ŌłÆ2, ╠²1, ╠²1, ╠²1.
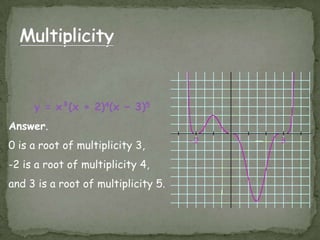
- 11. Multiplicityy = x┬│(x + 2)4(x ŌłÆ 3)5Answer.╠²╠²╠²0 is a root of multiplicity 3,-2 is a root of multiplicity 4, and 3 is a root of multiplicity 5. ╠²
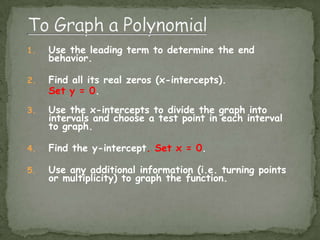
- 12. To Graph a PolynomialUse the leading term to determine the end behavior.Find all its real zeros (x-intercepts). Set y = 0.Use the x-intercepts to divide the graph into intervals and choose a test point in each interval to graph.Find the y-intercept. Set x = 0.Use any additional information (i.e. turning points or multiplicity) to graph the function.