Linear Modeling
Download as pptx, pdf0 likes444 views

The document provides instructions for using a graphing calculator to analyze data on the percentage of women practicing law from 1970 to 2000. It describes how to: 1) Enter the data into the calculator and create a scatter plot of the percentages over time. 2) Use the calculator to find the equation of the line of best fit as y = 0.059x - 104.51. 3) Plug 2010 into the equation to predict the percentage of women lawyers will be about 14.08% in 2010, though the prediction may not be accurate due to a low correlation.
1 of 9
Download to read offline


Ad
Recommended
Determining a Line of Best Fit Using a Graphing Calculator
Determining a Line of Best Fit Using a Graphing Calculatoremilybriggs
Ěý
1. The document provides steps to determine an equation of a line of best fit using a graphing calculator and define the squared deviation for the determined equation.
2. The steps include plotting data points, using the LinReg function to determine the equation, and calculating the squared deviations between the original data and data from the line of best fit equation.
3. Squaring the deviations is done because it allows the average deviation to be calculated as a measure of how far the data points stray from the line of best fit.Linear Regression
Linear Regressionktini
Ěý
A linear regression was performed to find the best fit line for race distances and times of a dog named Midnight. The linear regression allows one to predict future race times based on distances. The document outlines the steps to perform a linear regression using a graphing calculator: 1) Enter the x and y variable data into lists L1 and L2, 2) generate a scatter plot of the data, 3) use the calculator's LinReg function to calculate the best fit line equation, and 4) graph the best fit line to visualize the linear relationship between distances and times.Theatre Booking System Lesson 3
Theatre Booking System Lesson 3mrbelshaw
Ěý
The document discusses inserting random numbers using the RANDBETWEEN formula to test a theatre booking system model. It explains that the RANDBETWEEN formula generates random numbers between the bottom and top numbers specified, in this case 0 and 4, to represent randomly booked seats. It also provides instructions to enable the Analysis ToolPak add-in if the RANDBETWEEN function does not work initially, and how to copy the formula down and across cells to populate the model with random seat bookings for testing.Moduel 5 topic 3
Moduel 5 topic 3Annie cox
Ěý
This document provides examples and instructions for performing linear regression. It explains positive and negative correlation and using a graphing calculator to find the equation of a line of best fit for sample household income and vehicle mileage data. The line of best fit equation is calculated as y = 0.24x + 14.17. Using this equation, the predicted vehicle mileage for a household income of $30,000 is calculated as 21.4 miles.Graphing with a calculator
Graphing with a calculatorleanncox16
Ěý
1) The document provides step-by-step instructions for graphing data using a graphing calculator. It explains how to enter data into the calculator, set the window parameters, plot the graph, find the vertex and another point to generate an equation, and check the equation against the original graph.
2) A key step is setting the window parameters like xmin, xmax, ymin and ymax to appropriately scale the graph. The example uses data points (3,16) and (10,4) to find the vertex and generate a quadratic equation.
3) The final step is using the calculator's Y= feature to plot the equation, allowing users to check if the equation accurately fits the original graphed dataHow to make your own population pyramid in six simple steps
How to make your own population pyramid in six simple stepsNed Baring
Ěý
This document provides step-by-step instructions for creating a population pyramid in Excel from population data. It describes how to prepare the data, insert a clustered bar chart, format the vertical and horizontal axes, and adjust the bar properties to produce an accurate population pyramid visualization.Wiki
WikiNewbri20
Ěý
This document provides steps for graphing data using a calculator:
1. Enter the data into the calculator's list by highlighting each column (L1, L2, etc.) and entering the numbers. Make sure each column contains the same number of entries.
2. Turn on the plot by pressing 2nd then y= to view the data points graphed. Select the desired plot by pressing enter.
3. Set the window parameters by clearing the window list and entering the x-min, x-max, x-scale, y-min, y-max, and y-scale values based on the range of data.
4. Press graph and all data points should appear.Making a Brochure
Making a Brochurekedixon
Ěý
To set up a document like a brochure with three columns, change the page margins to .5 inches on all sides, set the orientation to landscape, select three columns using the column button on the standard toolbar, and insert column breaks between columns by clicking insert and break when the cursor is at the end of a column.AP Calculus February 12, 2009
AP Calculus February 12, 2009Darren Kuropatwa
Ěý
This document discusses numerical integration techniques for approximating integrals. It introduces left- and right-hand sums, trapezoid sums, and midpoint sums as methods for approximating integrals when an exact antiderivative cannot be found. It then provides a table for using these summation methods with increasing values of n to calculate an integral, observe the resulting errors, and determine if there is a pattern in how the error sizes decrease.Tableau motion charts
Tableau motion chartsLearnbay Datascience
Ěý
The document outlines how to create motion charts in Tableau to visualize data changes over time. It describes the steps needed to display profit variations across months using the sample superstore dataset, including the configuration of dimensions and measures. Additionally, it highlights the advantage of motion charts in providing a historical trail of data changes rather than a single data snapshot.Tableau - waterfall charts
Tableau - waterfall chartsLearnbay Datascience
Ěý
The document explains how to create waterfall charts in Tableau to visualize the cumulative effect of sequential positive and negative values, using sales data from a sample superstore. It outlines a step-by-step process that includes dragging dimensions and measures to specific shelves, changing chart types, and creating calculated fields. The chart's appearance can be enhanced by adding color to the bars, allowing for better visual representation of sales variations.Day 6 examples
Day 6 examplesjchartiersjsd
Ěý
This document discusses numerical integration techniques for approximating integrals, including left- and right-hand sums, midpoint sums, and trapezoid sums. It explains that midpoint sums and trapezoid sums reduce the error of approximations and provides formulas for estimating the error bounds of these methods based on the second derivative of the function. The document also includes questions about selecting the number of subintervals needed to achieve a given error tolerance using trapezoid or midpoint sums.Creating a chart in Excel
Creating a chart in Excel JessicaCheung1998
Ěý
This document discusses various Excel functions including highlighting cells, inserting charts, adding chart titles, and including percentage data on charts. It explains how to highlight cells by dragging the mouse over a selection, how to insert a pie chart by choosing the chart type and design, and why a pie chart was useful for demonstrating ratios from market research. It also covers how to add a chart title from the Layout menu and insert percentage data on a chart using the Design tab to provide more clarity and understanding of the graph.8823083
8823083Leigh Johnson, PhD, MAS
Ěý
The document provides instructions for creating a histogram on a TI graphing calculator in 8 steps: 1) Press STAT and ENTER to enter data in L1, pressing ENTER after each entry; 2) Press 2nd and QUIT to change modes; 3) Press 2nd STAT PLOT to select Histogram plot type and ensure Xlist matches entered data; 4) Press GRAPH to view histogram and ZOOM 9 for better view; 5) Press TRACE to see class ranges and frequencies; 6) Press WINDOW to change class width if desired.AP Calculus şÝşÝߣs January 18, 2008
AP Calculus şÝşÝߣs January 18, 2008Darren Kuropatwa
Ěý
This document discusses numerical methods for approximating integrals, including left- and right-hand sums, trapezoid sums, and midpoint sums. It provides a table to calculate these approximations for a given integral using different values of n and compares the errors. It also mentions Simpson's rule and provides context on estimating errors for trapezoid and midpoint sums based on the maximum second derivative on the interval. Finally, it provides a link for further review of numerical integration methods.Create The Featured Project Section:
Create The Featured Project Section:Reema
Ěý
The document provides instructions for creating a featured project section on a website header. It involves:
1) Creating a rectangle container and clipping an image inside it for the featured project.
2) Adjusting the image by scaling and changing the blending mode.
3) Adding a title background and horizontal line above the image.
4) Adding a title and description inside the title area with specified font settings.Prepare Your Photoshop Document:
Prepare Your Photoshop Document:Reema
Ěý
1. Create a new Photoshop document using pixel units and set the rulers to pixels.
2. Add guides by making a 120px wide selection from the left corner and dragging a guide to mark the content area.
3. Set the font in the Character panel to Arial Bold 42pt, sharp anti-aliasing, and color #101112 for the type tool.Raymond.Brunkow-Project-EEL-3657-Sp15
Raymond.Brunkow-Project-EEL-3657-Sp15Raymond Brunkow
Ěý
This document describes the design and implementation of a controller for an inverted pendulum on a cart system. It provides the nonlinear and linearized models of the system and designs a PID controller using root locus analysis. Simulation results show the uncompensated system is unstable but the controlled system with PID controller and pre-compensator meets design specifications with less than 0.2 seconds settling time and 8% overshoot for a unit step input.Unity Feedback PD Controller Design for an Electronic Throttle Body
Unity Feedback PD Controller Design for an Electronic Throttle BodySteven Ernst, PE
Ěý
This document summarizes the design process for developing a closed-loop feedback control system for an electronic throttle body. It involves:
1) Modeling the system to obtain the transfer function.
2) Analyzing the transfer function using MATLAB to determine if the system is stable or oscillatory.
3) Simulating an open-loop model to account for real-world non-idealities.
4) Designing a PD controller to meet specifications and stabilize the oscillatory system. The controller is tuned using MATLAB simulations.
5) Implementing the designed controller in a closed-loop system model in System Vision software.MODELLING SIMULATION AND CONTROL OF AN ACTIVE SUSPENSION SYSTEM
MODELLING SIMULATION AND CONTROL OF AN ACTIVE SUSPENSION SYSTEM IAEME Publication
Ěý
This document reviews the modelling, simulation, and control of an active suspension system, highlighting its advantages over conventional passive systems in providing both comfort and control. It discusses the components and working principles of active suspension, including the use of PID controllers for performance improvement through simulations in MATLAB/Simulink. The paper presents a detailed comparison of active and passive systems, emphasizing the effectiveness of active systems in enhancing vehicle stability and passenger comfort.Modeling and control of a Quadrotor UAV
Modeling and control of a Quadrotor UAVAniket Shirsat
Ěý
The document describes the modeling and control of a quadrotor unmanned aerial vehicle (UAV). It first outlines various modeling assumptions. It then derives the nonlinear model, including kinematic and dynamic equations, by defining reference frames, rotational matrices, forces and moments. Linear models are developed by linearizing the nonlinear model. Finally, it discusses control design, analysis and simulation for the quadrotor.Controller design of inverted pendulum using pole placement and lqr
Controller design of inverted pendulum using pole placement and lqreSAT Publishing House
Ěý
The document presents a study on the controller design for an inverted pendulum using pole placement and linear quadratic regulator (LQR) techniques. It details the modeling of the pendulum using the Euler-Lagrange energy equation, comparisons between controllers, and the derivation of necessary equations for stabilization. The findings indicate that both state feedback and LQR controllers effectively stabilize the pendulum, although LQR design may be more complicated due to constant selection.Thesis_PPT
Thesis_PPTSudipta Saha
Ěý
This document describes the design and validation of a slip-based traction control system using co-simulation between ADAMS and MATLAB/SIMULINK. The objectives are to develop a traction control scheme to enhance vehicle stability under changing road conditions. A sliding mode controller is designed in SIMULINK and a vehicle model is created in ADAMS. Co-simulation is performed to validate that the controller can robustly control wheel slip as road parameters and vehicle mass vary. Simulation results demonstrate the controller tracks the desired slip ratios under different road surfaces and mass values, improving vehicle stability compared to open-loop control.MODELLING AND SIMULATION OF INVERTED PENDULUM USING INTERNAL MODEL CONTROL
MODELLING AND SIMULATION OF INVERTED PENDULUM USING INTERNAL MODEL CONTROLJournal For Research
Ěý
The document discusses the modeling and simulation of an inverted pendulum using Internal Model Control (IMC), highlighting that control can only be achieved if the control system effectively represents the process. The study compares IMC with PID control, showing IMC provides better performance and robustness, particularly in the presence of disturbances. Results from MATLAB/Simulink simulations confirm the effectiveness of IMC in stabilizing the inverted pendulum, although its efficacy relies on an accurate matching of the plant and model.Inverted Pendulum Control: A Brief Overview
Inverted Pendulum Control: A Brief OverviewIJMER
Ěý
1) The document provides an overview of inverted pendulum control, focusing on mobile inverted pendulums.
2) It describes the structure of a mobile inverted pendulum system with a cart and mounted pendulum. Equations of motion are provided.
3) Two common control strategies for inverted pendulums are discussed: PID control and fuzzy logic control. Performance comparisons using simulations show fuzzy logic control provides better response.The Controller Design For Linear System: A State Space Approach
The Controller Design For Linear System: A State Space ApproachYang Hong
Ěý
This document discusses the design of controllers for linear systems using a state-space approach, focusing on state feedback controllers, state observers, and servo controllers with optimal control laws. It outlines the objectives of controller design, the analysis of the systems involved, techniques for achieving stability through pole placement, and the application of Luenberger observers for estimating system states. Key findings include the ability to achieve zero steady-state error and minimal overshoot in system responses.Simulation of an Active Suspension Using PID Control
Simulation of an Active Suspension Using PID ControlSuzana Avila
Ěý
The document simulates an active vehicle suspension using PID control. It builds a quarter car model and analyzes the controllability and observability. Numerical simulations show the active suspension with PID controller improves performance over the passive suspension by reducing displacement peaks and settling times for step, harmonic, and noise road profiles. The active suspension improves comfort but has higher manufacturing costs than passive suspensions.Free piston linear engine and its control systems
Free piston linear engine and its control systemsShafeequr Rahman
Ěý
This document provides an overview of a review on free piston linear engines (FPLEs) and their control systems. It discusses the basics of FPLEs, including their operating principle and various piston configurations like single piston, dual piston, and opposed piston. It also describes experimental setups used to test FPLEs. Additionally, it covers piston dynamics and control topics like timing control, starting/restarting control, and misfire control. Applications of FPLEs discussed include improvements to efficiency, emissions reductions, and use in hybrid electric vehicles. The conclusion summarizes that two-stroke FPLEs are most commonly investigated due to advantages in structure and control.Four-Wheel Vehicle Suspension Model
Four-Wheel Vehicle Suspension ModelRochester Institute of Technology
Ěý
This document presents a mathematical model of a vehicle suspension that was developed as a midterm project. It includes:
1) A quarter-car model to simulate the bounce of one wheel over a pothole or bump.
2) A full-car model combining 4 quarter-car models to simulate the bounce of each tire.
3) An extension of the full-car model to simulate pitching of the vehicle body when encountering road variations.
4) Consideration of rolling of the vehicle body when taking turns. Non-linear springs are proposed to improve the model.Helicopter Simulation
Helicopter Simulationandreipopov
Ěý
This document outlines the development of a helicopter flight simulator in Matlab/Simulink. It discusses (1) the equations of motion for modeling a rotorcraft's attitude and position using Newton's laws of motion and forces/moments. (2) Stability and control theory using a states vector to model aerodynamic forces from changes in states using stability derivatives for forces, moments, speeds and angular speeds. (3) The simulation model using a controls/states vector and linear differential equations. It then details the (4) Simulink schematic, (5) 6 degree of freedom Simulink model, and (6) including cockpit instruments and controls to evaluate (7) helicopter performance.More Related Content
What's hot (9)
AP Calculus February 12, 2009
AP Calculus February 12, 2009Darren Kuropatwa
Ěý
This document discusses numerical integration techniques for approximating integrals. It introduces left- and right-hand sums, trapezoid sums, and midpoint sums as methods for approximating integrals when an exact antiderivative cannot be found. It then provides a table for using these summation methods with increasing values of n to calculate an integral, observe the resulting errors, and determine if there is a pattern in how the error sizes decrease.Tableau motion charts
Tableau motion chartsLearnbay Datascience
Ěý
The document outlines how to create motion charts in Tableau to visualize data changes over time. It describes the steps needed to display profit variations across months using the sample superstore dataset, including the configuration of dimensions and measures. Additionally, it highlights the advantage of motion charts in providing a historical trail of data changes rather than a single data snapshot.Tableau - waterfall charts
Tableau - waterfall chartsLearnbay Datascience
Ěý
The document explains how to create waterfall charts in Tableau to visualize the cumulative effect of sequential positive and negative values, using sales data from a sample superstore. It outlines a step-by-step process that includes dragging dimensions and measures to specific shelves, changing chart types, and creating calculated fields. The chart's appearance can be enhanced by adding color to the bars, allowing for better visual representation of sales variations.Day 6 examples
Day 6 examplesjchartiersjsd
Ěý
This document discusses numerical integration techniques for approximating integrals, including left- and right-hand sums, midpoint sums, and trapezoid sums. It explains that midpoint sums and trapezoid sums reduce the error of approximations and provides formulas for estimating the error bounds of these methods based on the second derivative of the function. The document also includes questions about selecting the number of subintervals needed to achieve a given error tolerance using trapezoid or midpoint sums.Creating a chart in Excel
Creating a chart in Excel JessicaCheung1998
Ěý
This document discusses various Excel functions including highlighting cells, inserting charts, adding chart titles, and including percentage data on charts. It explains how to highlight cells by dragging the mouse over a selection, how to insert a pie chart by choosing the chart type and design, and why a pie chart was useful for demonstrating ratios from market research. It also covers how to add a chart title from the Layout menu and insert percentage data on a chart using the Design tab to provide more clarity and understanding of the graph.8823083
8823083Leigh Johnson, PhD, MAS
Ěý
The document provides instructions for creating a histogram on a TI graphing calculator in 8 steps: 1) Press STAT and ENTER to enter data in L1, pressing ENTER after each entry; 2) Press 2nd and QUIT to change modes; 3) Press 2nd STAT PLOT to select Histogram plot type and ensure Xlist matches entered data; 4) Press GRAPH to view histogram and ZOOM 9 for better view; 5) Press TRACE to see class ranges and frequencies; 6) Press WINDOW to change class width if desired.AP Calculus şÝşÝߣs January 18, 2008
AP Calculus şÝşÝߣs January 18, 2008Darren Kuropatwa
Ěý
This document discusses numerical methods for approximating integrals, including left- and right-hand sums, trapezoid sums, and midpoint sums. It provides a table to calculate these approximations for a given integral using different values of n and compares the errors. It also mentions Simpson's rule and provides context on estimating errors for trapezoid and midpoint sums based on the maximum second derivative on the interval. Finally, it provides a link for further review of numerical integration methods.Create The Featured Project Section:
Create The Featured Project Section:Reema
Ěý
The document provides instructions for creating a featured project section on a website header. It involves:
1) Creating a rectangle container and clipping an image inside it for the featured project.
2) Adjusting the image by scaling and changing the blending mode.
3) Adding a title background and horizontal line above the image.
4) Adding a title and description inside the title area with specified font settings.Prepare Your Photoshop Document:
Prepare Your Photoshop Document:Reema
Ěý
1. Create a new Photoshop document using pixel units and set the rulers to pixels.
2. Add guides by making a 120px wide selection from the left corner and dragging a guide to mark the content area.
3. Set the font in the Character panel to Arial Bold 42pt, sharp anti-aliasing, and color #101112 for the type tool.Viewers also liked (20)
Raymond.Brunkow-Project-EEL-3657-Sp15
Raymond.Brunkow-Project-EEL-3657-Sp15Raymond Brunkow
Ěý
This document describes the design and implementation of a controller for an inverted pendulum on a cart system. It provides the nonlinear and linearized models of the system and designs a PID controller using root locus analysis. Simulation results show the uncompensated system is unstable but the controlled system with PID controller and pre-compensator meets design specifications with less than 0.2 seconds settling time and 8% overshoot for a unit step input.Unity Feedback PD Controller Design for an Electronic Throttle Body
Unity Feedback PD Controller Design for an Electronic Throttle BodySteven Ernst, PE
Ěý
This document summarizes the design process for developing a closed-loop feedback control system for an electronic throttle body. It involves:
1) Modeling the system to obtain the transfer function.
2) Analyzing the transfer function using MATLAB to determine if the system is stable or oscillatory.
3) Simulating an open-loop model to account for real-world non-idealities.
4) Designing a PD controller to meet specifications and stabilize the oscillatory system. The controller is tuned using MATLAB simulations.
5) Implementing the designed controller in a closed-loop system model in System Vision software.MODELLING SIMULATION AND CONTROL OF AN ACTIVE SUSPENSION SYSTEM
MODELLING SIMULATION AND CONTROL OF AN ACTIVE SUSPENSION SYSTEM IAEME Publication
Ěý
This document reviews the modelling, simulation, and control of an active suspension system, highlighting its advantages over conventional passive systems in providing both comfort and control. It discusses the components and working principles of active suspension, including the use of PID controllers for performance improvement through simulations in MATLAB/Simulink. The paper presents a detailed comparison of active and passive systems, emphasizing the effectiveness of active systems in enhancing vehicle stability and passenger comfort.Modeling and control of a Quadrotor UAV
Modeling and control of a Quadrotor UAVAniket Shirsat
Ěý
The document describes the modeling and control of a quadrotor unmanned aerial vehicle (UAV). It first outlines various modeling assumptions. It then derives the nonlinear model, including kinematic and dynamic equations, by defining reference frames, rotational matrices, forces and moments. Linear models are developed by linearizing the nonlinear model. Finally, it discusses control design, analysis and simulation for the quadrotor.Controller design of inverted pendulum using pole placement and lqr
Controller design of inverted pendulum using pole placement and lqreSAT Publishing House
Ěý
The document presents a study on the controller design for an inverted pendulum using pole placement and linear quadratic regulator (LQR) techniques. It details the modeling of the pendulum using the Euler-Lagrange energy equation, comparisons between controllers, and the derivation of necessary equations for stabilization. The findings indicate that both state feedback and LQR controllers effectively stabilize the pendulum, although LQR design may be more complicated due to constant selection.Thesis_PPT
Thesis_PPTSudipta Saha
Ěý
This document describes the design and validation of a slip-based traction control system using co-simulation between ADAMS and MATLAB/SIMULINK. The objectives are to develop a traction control scheme to enhance vehicle stability under changing road conditions. A sliding mode controller is designed in SIMULINK and a vehicle model is created in ADAMS. Co-simulation is performed to validate that the controller can robustly control wheel slip as road parameters and vehicle mass vary. Simulation results demonstrate the controller tracks the desired slip ratios under different road surfaces and mass values, improving vehicle stability compared to open-loop control.MODELLING AND SIMULATION OF INVERTED PENDULUM USING INTERNAL MODEL CONTROL
MODELLING AND SIMULATION OF INVERTED PENDULUM USING INTERNAL MODEL CONTROLJournal For Research
Ěý
The document discusses the modeling and simulation of an inverted pendulum using Internal Model Control (IMC), highlighting that control can only be achieved if the control system effectively represents the process. The study compares IMC with PID control, showing IMC provides better performance and robustness, particularly in the presence of disturbances. Results from MATLAB/Simulink simulations confirm the effectiveness of IMC in stabilizing the inverted pendulum, although its efficacy relies on an accurate matching of the plant and model.Inverted Pendulum Control: A Brief Overview
Inverted Pendulum Control: A Brief OverviewIJMER
Ěý
1) The document provides an overview of inverted pendulum control, focusing on mobile inverted pendulums.
2) It describes the structure of a mobile inverted pendulum system with a cart and mounted pendulum. Equations of motion are provided.
3) Two common control strategies for inverted pendulums are discussed: PID control and fuzzy logic control. Performance comparisons using simulations show fuzzy logic control provides better response.The Controller Design For Linear System: A State Space Approach
The Controller Design For Linear System: A State Space ApproachYang Hong
Ěý
This document discusses the design of controllers for linear systems using a state-space approach, focusing on state feedback controllers, state observers, and servo controllers with optimal control laws. It outlines the objectives of controller design, the analysis of the systems involved, techniques for achieving stability through pole placement, and the application of Luenberger observers for estimating system states. Key findings include the ability to achieve zero steady-state error and minimal overshoot in system responses.Simulation of an Active Suspension Using PID Control
Simulation of an Active Suspension Using PID ControlSuzana Avila
Ěý
The document simulates an active vehicle suspension using PID control. It builds a quarter car model and analyzes the controllability and observability. Numerical simulations show the active suspension with PID controller improves performance over the passive suspension by reducing displacement peaks and settling times for step, harmonic, and noise road profiles. The active suspension improves comfort but has higher manufacturing costs than passive suspensions.Free piston linear engine and its control systems
Free piston linear engine and its control systemsShafeequr Rahman
Ěý
This document provides an overview of a review on free piston linear engines (FPLEs) and their control systems. It discusses the basics of FPLEs, including their operating principle and various piston configurations like single piston, dual piston, and opposed piston. It also describes experimental setups used to test FPLEs. Additionally, it covers piston dynamics and control topics like timing control, starting/restarting control, and misfire control. Applications of FPLEs discussed include improvements to efficiency, emissions reductions, and use in hybrid electric vehicles. The conclusion summarizes that two-stroke FPLEs are most commonly investigated due to advantages in structure and control.Four-Wheel Vehicle Suspension Model
Four-Wheel Vehicle Suspension ModelRochester Institute of Technology
Ěý
This document presents a mathematical model of a vehicle suspension that was developed as a midterm project. It includes:
1) A quarter-car model to simulate the bounce of one wheel over a pothole or bump.
2) A full-car model combining 4 quarter-car models to simulate the bounce of each tire.
3) An extension of the full-car model to simulate pitching of the vehicle body when encountering road variations.
4) Consideration of rolling of the vehicle body when taking turns. Non-linear springs are proposed to improve the model.Helicopter Simulation
Helicopter Simulationandreipopov
Ěý
This document outlines the development of a helicopter flight simulator in Matlab/Simulink. It discusses (1) the equations of motion for modeling a rotorcraft's attitude and position using Newton's laws of motion and forces/moments. (2) Stability and control theory using a states vector to model aerodynamic forces from changes in states using stability derivatives for forces, moments, speeds and angular speeds. (3) The simulation model using a controls/states vector and linear differential equations. It then details the (4) Simulink schematic, (5) 6 degree of freedom Simulink model, and (6) including cockpit instruments and controls to evaluate (7) helicopter performance.final project
final projectvishal ravindran
Ěý
This document is the final project report for controlling an inverted pendulum system. It includes modeling the nonlinear dynamics of the pendulum cart system and deriving the state space equations. The goal is to balance the pendulum in the vertically upward unstable equilibrium position using feedback control. The report outlines modeling the system, linearizing about the unstable point, designing a feedback controller using linear quadratic regulation, and simulating the closed-loop response. Parameter perturbations are also analyzed through simulation to study the transient behavior and stability margins of the controlled system.Thesis presentation on inverted pendulum
Thesis presentation on inverted pendulum Nowab Md. Aminul Haq
Ěý
This document summarizes a student project on stabilizing and balancing linear and rotary inverted pendulum systems. It discusses the design and implementation of PID controllers to balance an inverted pendulum mounted on a cart (linear system) and a rotary inverted pendulum prototype. Key steps included mathematical modeling, simulation in MATLAB, PID controller tuning, and applying the controller to experimental setups. Results showed the systems could be stabilized using optimized PID and LQR controllers designed via pole placement and minimizing cost functions.Quarter model of passive suspension system with simscape
Quarter model of passive suspension system with simscapeabuamo
Ěý
The document summarizes key aspects of vehicle suspension systems. It defines a suspension system as using springs and shock absorbers to connect wheels/axles to the vehicle chassis. Suspension systems serve to carry weight, maximize tire traction, provide stability and handling, and ensure passenger comfort by smoothing bumps. Springs absorb shock from bumps by converting it to potential energy, while shock absorbers dissipate shock without causing undue vehicle oscillation. Passive suspensions use traditional springs and dampers, while active suspensions constantly sense the road and adjust components like shock stiffness electronically. Simscape software can be used to model and simulate multi-domain physical systems like vehicle suspensions.Inverted Pendulum
Inverted PendulumCarlos
Ěý
This document discusses different control methods for an inverted pendulum system, including a lead controller, full state feedback controller, and LQR controller. The full state feedback controller is able to place poles for good behavior but requires tuning multiple gain values. The LQR controller provides optimal control through minimizing costs and finds the gain coefficients in a more efficient way than full state feedback. Simulation results show the full state feedback and LQR controllers perform better than the lead controller in keeping the pendulum upright and being tolerant to disturbances.Analysis of Automobile Suspension
Analysis of Automobile SuspensionQuickoffice Test
Ěý
This document analyzes the suspension system of an automobile modeled as a two-degree-of-freedom spring-mass-damper system. Equations of motion were derived using Lagrange's equations and modeled in SIMULINK. Natural frequencies were found to be 5.1 rad/s and 6.5 rad/s. Increasing damping reduced bounce by 3x10⁻³ m to 1x10⁻³ m and pitch by 5x10⁻⁴ m to less than 1x10⁻⁴ m. MATLAB modal analysis verified results and natural frequencies were compared.Abs(anti lock braking system)
Abs(anti lock braking system)Khamkar Abhishek
Ěý
The document discusses antilock braking systems (ABS). It describes how ABS monitors wheel slip and modulates brake pressure to prevent locking and maintain vehicle control during braking. It outlines the key components of ABS including sensors, control modules, valves and pumps. ABS improves stability and reduces braking distances on slippery surfaces. While effective for safety, ABS does increase maintenance costs compared to traditional braking systems.Design control FDA requirements
Design control FDA requirementsLatvian University
Ěý
The document discusses design controls, which are a set of quality practices and procedures incorporated into the design and development process to control the design process and ensure medical device specifications meet user needs and intended use. It provides an overview of the seven key elements of design controls according to FDA regulations: design and development planning, design input, design output, design review, design verification, design validation, and design changes. It emphasizes that design controls are important for medical device safety and quality.Ad
Similar to Linear Modeling (10)
2.6b scatter plots and lines of best fit
2.6b scatter plots and lines of best fithartcher
Ěý
This document provides instructions for using a graphing calculator to perform linear regression on a dataset and find the line of best fit. It describes entering paired x and y data values into separate lists, using the LinReg(ax+b) function to determine the regression equation, optionally creating a scatter plot of the original data and regression line, and using the line equation to forecast values. As an example, it analyzes a dataset of alternative-fueled vehicles in the US from 1997 to predict the number in 2014. PHStat Notes Using the PHStat Stack Data and .docx
PHStat Notes Using the PHStat Stack Data and .docxShiraPrater50
Ěý
The document is a comprehensive guide covering statistics, data analysis, and decision modeling, including numerous chapters on descriptive statistics, probability concepts, hypothesis testing, and regression analysis. It provides detailed instructions on using Microsoft Excel for statistical analysis, presenting data, and implementing various statistical methods and functions. Additionally, it includes extensive content on decision-making models, uncertainty, risk, and quality control, with numerous exercises and applications throughout.Introduction to Business Statistics 6th Edition Ronald M. Weiers
Introduction to Business Statistics 6th Edition Ronald M. Weierscochaclecir
Ěý
Introduction to Business Statistics 6th Edition Ronald M. Weiers
Introduction to Business Statistics 6th Edition Ronald M. Weiers
Introduction to Business Statistics 6th Edition Ronald M. WeiersSession ii g3 lab behavior science mmc
Session ii g3 lab behavior science mmcUSD Bioinformatics
Ěý
This document describes using information management tools and systems biology modeling in epidemiology. It outlines tasks for creating a Google survey, performing descriptive and inferential statistics in Excel and the data mining software Tanagra, and modeling disease spread using the NetLogo simulation epiDEM Travel and Control. The aims are to understand behavioral science data analysis and mining using statistics, and apply bioinformatics and systems biology tools to epidemiology problems. Skills gained include survey design, descriptive statistics, data visualization, association rule mining, k-means clustering, and agent-based modeling of disease transmission.08 calc and nonlinear
08 calc and nonlinearbplett
Ěý
1. The document provides instructions for performing statistical plots, regression equations, and exponential graphs on a graphing calculator.
2. It explains how to create lists of data, turn on stat plots, choose appropriate window settings, and select different types of regression analyses.
3. Examples are given for linear, quadratic, cubic, and exponential regression equations and how to graph the generated equations. Students are directed to practice examples in their textbook in preparation for a similar quiz tomorrow.Business Statistics using Excel 2nd Edition Glyn Davis
Business Statistics using Excel 2nd Edition Glyn Davishajvanmesine
Ěý
Business Statistics using Excel 2nd Edition Glyn Davis
Business Statistics using Excel 2nd Edition Glyn Davis
Business Statistics using Excel 2nd Edition Glyn DavisMath 221 Massive Success / snaptutorial.com
Math 221 Massive Success / snaptutorial.comStephenson164
Ěý
The document includes quizzes and iLabs for a Math 221 course, covering topics such as Excel functions, data collection methods, regression equations, probability distributions, and confidence intervals. It presents various statistical problems related to data analysis, drawing insights from data and applying statistical formulas in Excel. Additionally, it emphasizes interpreting results and understanding statistical significance through question and answer formats.cs 601 - lecture 1.pptx
cs 601 - lecture 1.pptxGopalPatidar13
Ěý
The document outlines the course contents for a theory course on machine learning. It covers 5 units: (1) introduction to machine learning concepts including regression, probability, statistics, linear algebra, convex optimization, and data preprocessing; (2) linear and nonlinear models including neural networks, loss functions, and regularization; (3) convolutional neural networks; (4) recurrent neural networks; and (5) support vector machines and applications of machine learning. It also lists recommended textbooks on pattern recognition, machine learning, and deep learning.L8 scientific visualization of data
L8 scientific visualization of dataSeppo Karrila
Ěý
The document discusses scientific visualization methodologies focused on extracting insights from small sets of experimental data, emphasizing that the goal is to create or corroborate hypotheses rather than to produce visually appealing infographics. It critiques the use of observational data for establishing causation and recommends certain software tools like Excel, JASP, and Jamovi for data analysis and visualization. It concludes that while Excel can be useful for basic data manipulation and visualization, more advanced exploratory tools like DataWarrior offer greater capabilities for industry-strength visualizations.Project #4 Due 121015 by 500pm Upload one PowerPoint and .docx
Project #4 Due 121015 by 500pm Upload one PowerPoint and .docxwkyra78
Ěý
The document outlines the requirements for a project due on 12/10/15, involving the selection of a Fortune 500 company for performance data assessment through SEC filings, with deliverables in PowerPoint and Excel formats. It specifies tasks including analyzing financial data, creating scatterplots, and summarizing statistical results. Additionally, it discusses the role and significance of IEEE standards in ensuring consistency and reliability in technology development.Ad
More from toni dimella (20)
Parent functions and Transformations
Parent functions and Transformationstoni dimella
Ěý
This document discusses transformations of parent functions. It defines a parent function as the simplest form of a function, such as y=x, y=x^2, etc. Transformations include horizontal and vertical shifts which move the graph left, right, up or down; stretches which multiply the y-values making the graph skinnier; shrinks which reduce the y-values making the graph fatter; and reflections which flip the graph over the x-axis. Examples are provided to demonstrate how to graph different transformations of common parent functions. The document concludes by describing the transformation y=4x-2-5 as a shrink by a factor of 4, a right shift of 2 units, and a down shift of 5Module 2 lesson 4 notes
Module 2 lesson 4 notestoni dimella
Ěý
Parent functions are families of graphs that share unique properties. Transformations can move the graph around the plane. The main parent functions explored are the constant, linear, absolute value, quadratic, cubic, square root, cubic root, and exponential functions. Each has a characteristic shape and number of intercepts. Domains and ranges depend on the specific function but often extend to positive and negative infinity.Module 2 Lesson 2 Notes
Module 2 Lesson 2 Notestoni dimella
Ěý
This document defines polynomial functions and discusses their key properties. It defines polynomials as expressions with real number coefficients and positive integer exponents. Examples of polynomials and non-polynomials are provided. The document discusses defining polynomials by degree or number of terms, and classifying specific polynomials. It covers finding zeros of polynomial functions and their multiplicities. The document also addresses end behavior of polynomials based on the leading coefficient and degree. It provides an example of analyzing a polynomial function by defining it, finding zeros and multiplicities, describing end behavior, and sketching its graph.Module 1 Lesson 1 Remediation Notes
Module 1 Lesson 1 Remediation Notestoni dimella
Ěý
The document provides information about functions and relations. It defines a function as a relation where each x-value is paired with exactly one y-value. To determine if a relation is a function, it describes using the vertical line test, where a relation is a function if a vertical line can only intersect the graph at one point. It gives examples of applying the vertical line test to graphs and determining the domain and range of relations.M1 L5 Remediation Notes
M1 L5 Remediation Notestoni dimella
Ěý
This document discusses solving systems of equations and inequalities through three main methods: graphing, substitution, and elimination. It provides examples of each method. For graphing systems, it explains the three possibilities for the graphs: consistent systems with one solution where the lines intersect, inconsistent systems with no solution where the lines are parallel, and dependent systems with infinite solutions where the lines coincide. It then works through examples of using substitution and elimination to solve systems algebraically. [/SUMMARY]Relations and Functions
Relations and Functionstoni dimella
Ěý
The document discusses relations, functions, domains, and ranges. It defines a relation as a set of ordered pairs and a function as a relation where each x-value is mapped to only one y-value. It explains how to identify the domain and range of a relation, and use the vertical line test and mappings to determine if a relation is a function. Examples of evaluating functions are also provided.Multiplying Polynomials (no conjugates)
Multiplying Polynomials (no conjugates)toni dimella
Ěý
This document discusses techniques for multiplying polynomials including FOIL, the double distributive property, and squaring binomials. It provides examples of squaring binomial expressions like (x + 3)2 by multiplying (x + 3) by itself using FOIL. The document also lists more example problems but does not show the solutions.Fractions, Decimals, and Percents
Fractions, Decimals, and Percentstoni dimella
Ěý
This document defines decimals, fractions, and percents and provides steps for converting between them. Decimals are numbers with a decimal point, fractions show parts of a whole, and percents express amounts out of 100. To convert a fraction to a decimal, divide the numerator by the denominator. To convert a fraction to a percent, change it to a decimal then multiply by 100. Converting between other forms follows similar steps of changing the number to an equivalent decimal or percent value.C3 Study şÝşÝߣs - MAT 151
C3 Study şÝşÝߣs - MAT 151toni dimella
Ěý
This document contains lecture slides about statistics for describing, exploring, and comparing data. It discusses measures of center such as the mean, median, and mode. It also discusses variance and standard deviation as measures of spread. Additional topics covered include finding the mode, determining if a value is unusually high or low based on the mean and standard deviation, calculating percentiles, and comparing the detail provided by different graphic displays of data.C2 Study şÝşÝߣs - MAT 151
C2 Study şÝşÝߣs - MAT 151toni dimella
Ěý
The document contains multiple choice questions about summarizing and graphing data. It asks questions about outliers, frequency distributions, class boundaries, histograms, and types of charts including pie charts. One question asks the reader to use a pie chart showing housing types to find the number of people living in single family housing in a town of 12,200 people.C1 Study şÝşÝߣs - MAT151
C1 Study şÝşÝߣs - MAT151toni dimella
Ěý
The document contains lecture slides on introductory statistics topics including definitions of population, quantitative vs qualitative data, types of measurement scales, and examples of different sampling methods and study designs. Key points covered are the definition of a population as the complete collection of all elements, examples of quantitative data like weights vs qualitative nominal categories, ordinal scales involving ranking, and retrospective study designs using existing historical data.C3 test Doc
C3 test Doctoni dimella
Ěý
This document contains 16 logic and critical thinking problems involving statements, truth tables, logic symbols, validity of arguments, and Euler diagrams. The problems cover topics such as determining logical equivalences, constructing and analyzing truth tables, identifying inverse, converse and contrapositive statements, and determining the validity of arguments using logic rules or diagrams.C3 test
C3 testtoni dimella
Ěý
This document contains 16 logic and critical thinking problems involving statements, truth tables, logic symbols, validity of arguments, and Euler diagrams. The problems cover topics such as determining logical equivalence, constructing and analyzing truth tables, identifying inverse, converse and contrapositive statements, and determining the validity of arguments using logic rules or diagrams.Intro to Logs
Intro to Logstoni dimella
Ěý
The document introduces logarithms, defining them as the exponent that a fixed number (the base) must be raised to to equal the value. It provides examples of converting between logarithmic and exponential forms, and covers the key properties of logarithms including product, quotient, power, expanding, condensing, and the change of base formula.Logs
Logstoni dimella
Ěý
The document introduces logarithms, defining them as the exponent that a base number must be raised to to equal the value. It provides examples of converting between logarithmic and exponential forms, and discusses properties of logarithms such as the product, quotient, and power properties. It also covers expanding, condensing, and changing the base of logarithmic expressions.Intro to Polynomials
Intro to Polynomialstoni dimella
Ěý
This document discusses polynomial functions and how to graph them. It defines a polynomial as a sum of terms with non-negative integer exponents. Polynomial graphs are smooth curves that may be lines, parabolas, or higher-order curves. To graph a polynomial, one determines the end behavior from the leading term, finds the x-intercepts by setting the polynomial equal to 0, and uses intercepts and test points to plot the graph over intervals. Multiplicity of roots affects whether the graph crosses or is tangent to the x-axis at those points.Completing the Square
Completing the Squaretoni dimella
Ěý
The document explains how to solve quadratic equations by completing the square. It defines a perfect square trinomial as having the form x^2 + bx + c, where c is the square of half of b. It provides steps for completing the square, which involves adding a constant term to both sides of the equation such that the left side becomes a perfect square trinomial that can be factorized. This process results in the solution(s) to the quadratic equation. Two examples demonstrating this process are included.Graph Quadratics
Graph Quadraticstoni dimella
Ěý
The document discusses graphing quadratic functions in standard form (y=ax^2 + bx + c). It explains that the graph is a parabola that can open up or down depending on whether a is positive or negative. The line of symmetry for the parabola passes through the vertex and is given by the equation x=-b/2a. The steps to graph are: 1) find the line of symmetry, 2) plug the x-value into the original equation to find the vertex, 3) find two other points and reflect them across the line of symmetry.Composite functions
Composite functionstoni dimella
Ěý
Composite functions are formed by taking the output of one function and using it as the input of another function. This is shown notationally as f(g(x)), where the result of g(x) is used as the input for f. Changing the order of the functions changes the result, as the output of the inner function determines the input to the outer function. Examples show evaluating composite functions by substituting the output of the inner function into the outer function and simplifying.Linear Modeling
- 1. Linear ModelingOk...grab a TI and follow along with the problem:
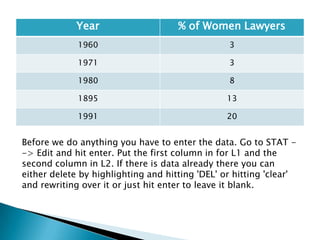
- 2. The number of women practicing law has increased substantially in the last four decades. Use a graphing calculator and the data in the table to:Make a scatter plot of the data.Find the equation of the line of best fit. Predict the percent of lawyers who will be women in 2010.
- 3. Before we do anything you have to enter the data. Go to STAT --> Edit and hit enter. Put the first column in for L1 and the second column in L2. If there is data already there you can either delete by highlighting and hitting 'DEL' or hitting 'clear' and rewriting over it or just hit enter to leave it blank.
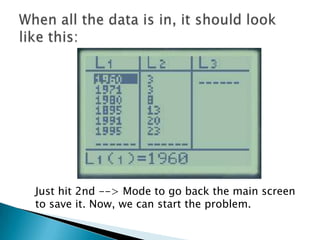
- 4. When all the data is in, it should look like this:Just hit 2nd --> Mode to go back the main screen to save it. Now, we can start the problem.
- 5. To graph it on the calc,Ěýhit 2nd --> y = to open theĚý'STAT PLOT'Ěýmenu. Highlight 1: and hit enter to go toĚýsub screen. Move the cursor on to 'ON' and hit enter. You'll see theĚý'ON' is now highlighted. Now hit graph. To make a scatter plot you can either sketch it by hand or use your TI
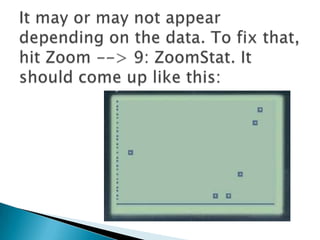
- 6. It may or may not appear depending on the data. To fix that, hit Zoom --> 9: ZoomStat.ĚýIt should come up like this:
- 7. To find the line of best, go back to the main screen. (by hitting 2nd--> Mode)ĚýThen select Stat --> Calc --> 8: LnReg (a + bx). This will come up on the main screen. Hit enter to run the program. You're result will look like…………………….
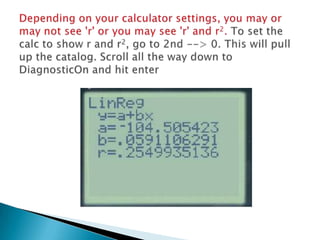
- 8. Depending on your calculator settings, you may or may not see 'r' or you may see 'r' and r2.To set the calc to show r and r2, go to 2nd --> 0. This will pull up the catalog. Scroll all the way down to DiagnosticOn and hit enter
- 9. So the equation for the line of best fit y = .059x - 104.51. As a side note, the correlation is a .25 which is terrible!!To predict what percent of women lawyers there will be in 2010, plug 2010 in for x and simplify. Your answer will be about 14.08%, but judging by the low correlation, this probably isn't a very good estimate