

![’é¦How to install Matplotlib on Jupyter?
’é¦Open the jupyter notebook and type the following code:
!pip install matplotlib
Import matplotlib.pyplot as plt // as means alias (named)
import numpy as np
xpts = np.array([0,4])
ypts = np.array([0,6])
plt.plot(xpts,ypts)
plt.show()
7](https://image.slidesharecdn.com/introductiontoml2-240429042228-edede412/85/Introduction-to-Machine-Learning-by-MARK-7-320.jpg)

![’é¦ Installing Pillow library:
’é¦ Pip install pillow
’é¦ from PIL import Image
’é¦ # Open an image file
’é¦ original_image =
Image.open("example.jpg")
’é¦ # Display basic information about
the image
’é¦ print("Original Image Format:",
original_image.format)
’é¦ print("Original Image Size:",
original_image.size)
’é¦ # Resize the image
’é¦ new_size = (original_image.size[0] //
2, original_image.size[1] // 2)
’é¦ # Reduce size by half
’é¦ resized_image =
original_image.resize(new_size)
11
# Display new size
print("Resized Image Size:", resized_image.size)
# Save the resized image with a new name
resized_image.save("resized_example.jpg")
# Close the original and resized images
original_image.close()
resized_image.close()
print("Resized image saved successfully!")](https://image.slidesharecdn.com/introductiontoml2-240429042228-edede412/85/Introduction-to-Machine-Learning-by-MARK-11-320.jpg)


![’é¦ Installing plotly library:
’é¦ Pip install plotly
’é¦ import plotly.graph_objects as go
’é¦ # Sample data
’é¦ x_values = [1, 2, 3, 4, 5]
’é¦ y_values = [2, 3, 5, 7, 11]
’é¦ # Create a line plot
’é¦ fig = go.Figure(data=go.Scatter(x=x_values, y=y_values,
mode='lines'))
’é¦ # Add title and axis labels
’é¦ fig.update_layout(title='Simple Line Plot',
’é¦ xaxis_title='X-axis',
’é¦ yaxis_title='Y-axis')
’é¦ # Show the plot
’é¦ fig.show() 19](https://image.slidesharecdn.com/introductiontoml2-240429042228-edede412/85/Introduction-to-Machine-Learning-by-MARK-19-320.jpg)
![’é¦Exporting the Data :
import pandas as pd
# Example DataFrame
data = {
'Name': ['John', 'Alice', 'Bob'],
'Age': [25, 30, 35],
'City': ['New York', 'Los Angeles', 'Chicago']
}
df = pd.DataFrame(data)
# Export DataFrame to CSV
df.to_csv('output.csv', index=False) 21](https://image.slidesharecdn.com/introductiontoml2-240429042228-edede412/85/Introduction-to-Machine-Learning-by-MARK-21-320.jpg)

![’é¦ import pandas as pd
’é¦ # Load the dataset
’é¦ data = {
’é¦ 'Name': ['John', 'Alice', 'Bob', 'Anna', 'Mike', 'Emily'],
’é¦ 'Age': [25, 30, None, 35, 40, ''],
’é¦ 'City': ['New York', 'Los Angeles', 'Chicago', 'San Francisco', '',
'Seattle'],
’é¦ 'Gender': ['Male', 'Female', 'Male', '', 'Male', 'Female'],
’é¦ 'Salary': ['$50000', '$60000', '$70000', '$80000', '90000', '$100000']
’é¦ }
’é¦ df = pd.DataFrame(data)
’é¦ # Display the original DataFrame
’é¦ print("Original DataFrame:")
’é¦ print(df)
’é¦ print()
’é¦ # Clean and format the data
’é¦ # 1. Convert Age to numeric and fill missing values with the median
age
’é¦ df['Age'] = pd.to_numeric(df['Age'], errors='coerce')
23
median_age = df['Age'].median() #
Calculate median age
df['Age'].fillna(median_age, inplace=True)
# Fill missing values with median
# 2. Remove rows with missing or empty
values in City and Gender columns
df = df[df['City'].notna() &
df['Gender'].notna() & (df['Gender'] != '')]
# 3. Convert Salary to numeric and remove
dollar signs
df['Salary'] = df['Salary'].replace('[$,]', '',
regex=True).astype(float)
# Display the cleaned and formatted
DataFrame
print("Cleaned and Formatted
DataFrame:")
print(df)](https://image.slidesharecdn.com/introductiontoml2-240429042228-edede412/85/Introduction-to-Machine-Learning-by-MARK-23-320.jpg)

![’é¦ Feature Scaling:
’é¦ Feature scaling is the process of standardizing or normalizing the range of
independent variables or features in the dataset.
’é¦ It is essential for algorithms that are sensitive to the scale of the input
features, such as gradient descent-based algorithms (e.g., linear regression,
logistic regression) or distance-based algorithms (e.g., k-nearest neighbors,
support vector machines).
’é¦ Common techniques for feature scaling include:
’é¦ Min-Max Scaling: Scaling features to a fixed range, usually [0, 1].
’é¦ Standardization (Z-score normalization): Scaling features so that they have
the properties of a standard normal distribution with a mean of 0 and a
standard deviation of 1.
’é¦ Robust Scaling: Scaling features using statistics that are robust to outliers,
such as the median and interquartile range.
25](https://image.slidesharecdn.com/introductiontoml2-240429042228-edede412/85/Introduction-to-Machine-Learning-by-MARK-25-320.jpg)
![’é¦ Feature Scaling:
’é¦ import numpy as np
’é¦ from sklearn.preprocessing import MinMaxScaler, StandardScaler
’é¦ # Sample dataset with two features
’é¦ data = np.array([[10, 0.5],
’é¦ [20, 0.7],
’é¦ [30, 0.9]])
’é¦ # Min-Max Scaling
’é¦ scaler_minmax = MinMaxScaler() # Initialize MinMaxScaler
’é¦ data_minmax = scaler_minmax.fit_transform(data) # Perform Min-Max Scaling
’é¦ print("Min-Max Scaled Data:")
’é¦ print(data_minmax)
’é¦ print()
’é¦ # Standardization (Z-score normalization)
’é¦ scaler_standard = StandardScaler() # Initialize StandardScaler
’é¦ data_standard = scaler_standard.fit_transform(data) # Perform Standardization
’é¦ print("Standardized Data:")
’é¦ print(data_standard) 26](https://image.slidesharecdn.com/introductiontoml2-240429042228-edede412/85/Introduction-to-Machine-Learning-by-MARK-26-320.jpg)


![Unit 6 Image processing Libraries.[pptx]](https://cdn.slidesharecdn.com/ss_thumbnails/unit6imageprocessinglibraries-241221110926-7ed62a13-thumbnail.jpg?width=560&fit=bounds)


More Related Content
Similar to Introduction to Machine Learning by MARK (20)
More from MRKUsafzai0607 (6)


Recently uploaded (20)


Introduction to Machine Learning by MARK
- 1. Presenter: Muhammad Rizwan Khan Usafzai 1
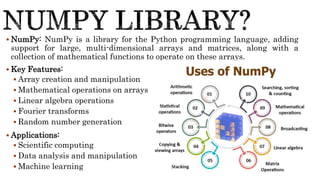
- 2. ’é¦ NumPy: NumPy is a library for the Python programming language, adding support for large, multi-dimensional arrays and matrices, along with a collection of mathematical functions to operate on these arrays. ’é¦ Key Features: ’é¦ Array creation and manipulation ’é¦ Mathematical operations on arrays ’é¦ Linear algebra operations ’é¦ Fourier transforms ’é¦ Random number generation ’é¦ Applications: ’é¦ Scientific computing ’é¦ Data analysis and manipulation ’é¦ Machine learning 2
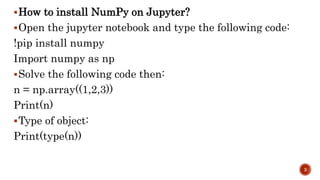
- 3. ’é¦How to install NumPy on Jupyter? ’é¦Open the jupyter notebook and type the following code: !pip install numpy Import numpy as np ’é¦Solve the following code then: n = np.array((1,2,3)) Print(n) ’é¦Type of object: Print(type(n)) 3
- 4. ’é¦ OpenCV (Open Source Computer Vision Library): ’é¦ OpenCV is an open-source computer vision and machine learning software library. It provides a wide range of functionalities for real-time computer vision, including image and video processing, object detection, face recognition, and more. ’é¦ Key Features: ’é¦ Image and video I/O ’é¦ Image processing algorithms ’é¦ Object detection and tracking ’é¦ Machine learning algorithms for computer vision tasks ’é¦ Applications: ’é¦ Robotics ’é¦ Augmented reality ’é¦ Surveillance systems ’é¦ Medical image analysis 4
- 5. ’é¦How to install Open CV on Jupyter? ’é¦Open the jupyter notebook and type the following code: !pip install opencv-python import cv2 img = cv2.imread("img1.png") cv2.imshow("MRK",img) cv2.waitKey(10000) cv2.destroyAllWindows() 5
- 6. ’é¦ Matplotlib is a comprehensive library for creating static, animated, and interactive visualizations in Python. It provides a MATLAB-like interface and supports a wide variety of plots and graphs. ’é¦ Key Features: ’é¦ Line plots, scatter plots, and histograms ’é¦ 2D and 3D plotting ’é¦ Customization of plots ’é¦ Integration with NumPy arrays ’é¦ Applications: ’é¦ Data visualization ’é¦ Scientific plotting ’é¦ Statistical analysis 6
- 7. ’é¦How to install Matplotlib on Jupyter? ’é¦Open the jupyter notebook and type the following code: !pip install matplotlib Import matplotlib.pyplot as plt // as means alias (named) import numpy as np xpts = np.array([0,4]) ypts = np.array([0,6]) plt.plot(xpts,ypts) plt.show() 7
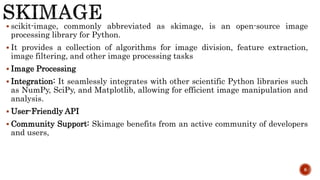
- 8. ’é¦ scikit-image, commonly abbreviated as skimage, is an open-source image processing library for Python. ’é¦ It provides a collection of algorithms for image division, feature extraction, image filtering, and other image processing tasks ’é¦ Image Processing ’é¦ Integration: It seamlessly integrates with other scientific Python libraries such as NumPy, SciPy, and Matplotlib, allowing for efficient image manipulation and analysis. ’é¦ User-Friendly API ’é¦ Community Support: Skimage benefits from an active community of developers and users, 8
- 9. ’é¦Installing scikit-image library: ’é¦Pip install scikit-image ’é¦Import skimage ’é¦from skimage import io ’é¦# Load an image from a file ’é¦image = io.imread('example_image.jpg') ’é¦# Display the image ’é¦io.imshow(image) ’é¦io.show() 9
- 10. ’é¦ Pillow is a Python Imaging Library (PIL) fork, which adds extensive image processing capabilities to Python. It provides support for opening, manipulating, and saving many different image file formats. ’é¦ Image Manipulation: Pillow offers a wide range of image handling functionalities such as resizing, cropping, rotating, filtering, and enhancing images. ’é¦ Image File Support: It supports various image file formats including JPEG, PNG, GIF, etc. making it suitable for handling varied image data. ’é¦ Integration: Pillow seamlessly integrates with other Python libraries such as NumPy and Matplotlib, enabling easy interoperability with scientific computing and data visualization tools. ’é¦ Ease of Use: Pillow provides a simple and intuitive API for working with images, making it accessible to users with varying levels of programming experience. ’é¦ Activeness: Pillow is actively maintained and updated, ensuring compatibility with the latest Python versions and continued support for new features and improvements. 10
- 11. ’é¦ Installing Pillow library: ’é¦ Pip install pillow ’é¦ from PIL import Image ’é¦ # Open an image file ’é¦ original_image = Image.open("example.jpg") ’é¦ # Display basic information about the image ’é¦ print("Original Image Format:", original_image.format) ’é¦ print("Original Image Size:", original_image.size) ’é¦ # Resize the image ’é¦ new_size = (original_image.size[0] // 2, original_image.size[1] // 2) ’é¦ # Reduce size by half ’é¦ resized_image = original_image.resize(new_size) 11 # Display new size print("Resized Image Size:", resized_image.size) # Save the resized image with a new name resized_image.save("resized_example.jpg") # Close the original and resized images original_image.close() resized_image.close() print("Resized image saved successfully!")
- 12. ’é¦ Pandas is a powerful Python library for data manipulation and analysis. It offers data structures and functions to efficiently work with structured data like time series, tabular, and heterogeneous data. ’é¦ Data Structures: Pandas provides two main data structures: Series (1D labeled array) and DataFrame (2D labeled data structure), which offer powerful data manipulation capabilities. ’é¦ Data Handling: It offers functionalities for reading and writing data from various formats like CSV, Excel, SQL databases etc. ’é¦ Data Analysis: Pandas supports data analysis tasks including data cleaning, filtering, grouping, merging, and reshaping, making it indispensable for exploratory data analysis. ’é¦ Integration: It seamlessly integrates with other Python libraries such as NumPy, Matplotlib, and scikit-learn, enhancing its capabilities in scientific computing and machine learning tasks. 12
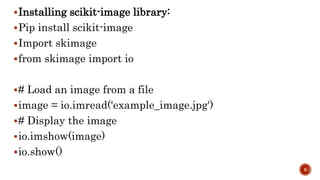
- 13. ’é¦ Installing Pandas library: Pip install pandas Some time it shows for pip upgrade then use the following to upgrade your pip: Python.exe -m pip install --upgrade pip import pandas as pd # Read a CSV file into a DataFrame df = pd.read_csv("example.csv") # Display the first few rows of the DataFrame print("First few rows of the DataFrame:") print(df.head()) 13 # Display summary information about the DataFrame print("nSummary information:") print(df.info()) # Display basic statistics of numerical columns print("nBasic statistics:") print(df.describe())
- 14. ’é¦ Definition: scikit-learn is a versatile machine learning library for Python. It offers simple and efficient tools for data mining and data analysis, implementing a wide range of machine learning algorithms. ’é¦ Machine Learning Algorithms: scikit-learn provides implementations for various machine learning algorithms including classification, regression, clustering, dimensionality reduction, and model selection. ’é¦ Model Evaluation: It offers tools for model evaluation, cross-validation, and hyperparameter tuning, facilitating the development of robust and accurate machine learning models. ’é¦ Integration: scikit-learn seamlessly integrates with other Python libraries such as NumPy, SciPy, and Pandas, enabling easy preprocessing, training, and evaluation of machine learning models. ’é¦ Scalability: It is designed to be scalable and efficient, making it suitable for working with large datasets and complex models. 14
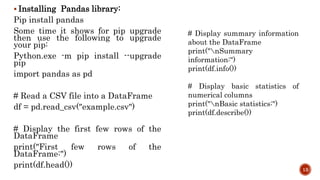
- 15. ’é¦ Installing scikit-learn library: ’é¦ Pip install scikit-learn ’é¦ Import sklearn ’é¦ from sklearn.datasets import load_iris ’é¦ from sklearn.model_selection import train_test_split ’é¦ from sklearn.ensemble import RandomForestClassifier ’é¦ from sklearn.metrics import accuracy_score, classification_report ’é¦ # Load the Iris dataset ’é¦ iris = load_iris() ’é¦ X = iris.data # Features ’é¦ y = iris.target # Target variable ’é¦ # Split the dataset into training and testing sets ’é¦ X_train, X_test, y_train, y_test = train_test_split(X, y, test_size=0.2, random_state=42) 15 # Initialize the Random Forest classifier rf_classifier = RandomForestClassifier(n_estimators=100, random_state=42) # Train the classifier rf_classifier.fit(X_train, y_train) # Predict on the test set y_pred = rf_classifier.predict(X_test) # Evaluate the model accuracy = accuracy_score(y_test, y_pred) print("Accuracy:", accuracy) # Display classification report print("nClassification Report:") print(classification_report(y_test, y_pred, target_names=iris.target_names))
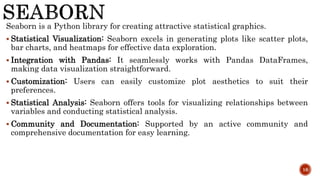
- 16. Seaborn is a Python library for creating attractive statistical graphics. ’é¦ Statistical Visualization: Seaborn excels in generating plots like scatter plots, bar charts, and heatmaps for effective data exploration. ’é¦ Integration with Pandas: It seamlessly works with Pandas DataFrames, making data visualization straightforward. ’é¦ Customization: Users can easily customize plot aesthetics to suit their preferences. ’é¦ Statistical Analysis: Seaborn offers tools for visualizing relationships between variables and conducting statistical analysis. ’é¦ Community and Documentation: Supported by an active community and comprehensive documentation for easy learning. 16
- 17. ’é¦ Installing seaborn library: ’é¦ Pip install seaborn ’é¦ import seaborn as sns ’é¦ import matplotlib.pyplot as plt ’é¦ from sklearn.datasets import load_iris ’é¦ # Load the Iris dataset ’é¦ iris = load_iris() ’é¦ iris_df = sns.load_dataset("iris") # Load Iris dataset as a DataFrame ’é¦ # Create a pairplot using Seaborn ’é¦ sns.pairplot(iris_df, hue='species', palette='Set1') ’é¦ # Add title ’é¦ plt.suptitle("Pairplot of Iris Dataset") ’é¦ # Show the plot ’é¦ plt.show() 17
- 18. Plotly is a Python library for creating interactive and publication-quality graphs. ’é¦ Interactive Visualization: Plotly allows users to interactively explore data through zooming and hovering over data points. ’é¦ Online Platform: It offers an online platform for hosting and sharing interactive plots. ’é¦ Chart Types: Supports a wide range of chart types including scatter plots, line plots, and 3D surface plots. ’é¦ Integration: Easily integrates with other Python libraries for seamless data manipulation and visualization. ’é¦ Customization: Provides extensive options for customizing plot appearance for tailored visualizations. 18
- 19. ’é¦ Installing plotly library: ’é¦ Pip install plotly ’é¦ import plotly.graph_objects as go ’é¦ # Sample data ’é¦ x_values = [1, 2, 3, 4, 5] ’é¦ y_values = [2, 3, 5, 7, 11] ’é¦ # Create a line plot ’é¦ fig = go.Figure(data=go.Scatter(x=x_values, y=y_values, mode='lines')) ’é¦ # Add title and axis labels ’é¦ fig.update_layout(title='Simple Line Plot', ’é¦ xaxis_title='X-axis', ’é¦ yaxis_title='Y-axis') ’é¦ # Show the plot ’é¦ fig.show() 19
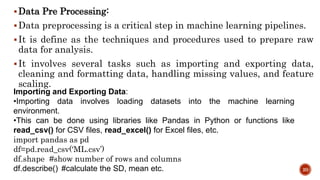
- 20. ’é¦Data Pre Processing: ’é¦Data preprocessing is a critical step in machine learning pipelines. ’é¦It is define as the techniques and procedures used to prepare raw data for analysis. ’é¦It involves several tasks such as importing and exporting data, cleaning and formatting data, handling missing values, and feature scaling. 20 Importing and Exporting Data: ŌĆóImporting data involves loading datasets into the machine learning environment. ŌĆóThis can be done using libraries like Pandas in Python or functions like read_csv() for CSV files, read_excel() for Excel files, etc. import pandas as pd df=pd.read_csv(ŌĆśML.csvŌĆÖ) df.shape #show number of rows and columns df.describe() #calculate the SD, mean etc.
- 21. ’é¦Exporting the Data : import pandas as pd # Example DataFrame data = { 'Name': ['John', 'Alice', 'Bob'], 'Age': [25, 30, 35], 'City': ['New York', 'Los Angeles', 'Chicago'] } df = pd.DataFrame(data) # Export DataFrame to CSV df.to_csv('output.csv', index=False) 21
- 22. ’é¦ Cleaning and Formatting Data: ’é¦ Cleaning data involves identifying and handling anomalies, inconsistencies, and errors in the dataset. ’é¦ This may include removing duplicates, correcting data types, dealing with outliers, etc. ’é¦ Formatting data involves ensuring that data is in the appropriate format for analysis. ’é¦ For example, converting categorical variables into numerical representations, standardizing date formats, etc. 22
- 23. ’é¦ import pandas as pd ’é¦ # Load the dataset ’é¦ data = { ’é¦ 'Name': ['John', 'Alice', 'Bob', 'Anna', 'Mike', 'Emily'], ’é¦ 'Age': [25, 30, None, 35, 40, ''], ’é¦ 'City': ['New York', 'Los Angeles', 'Chicago', 'San Francisco', '', 'Seattle'], ’é¦ 'Gender': ['Male', 'Female', 'Male', '', 'Male', 'Female'], ’é¦ 'Salary': ['$50000', '$60000', '$70000', '$80000', '90000', '$100000'] ’é¦ } ’é¦ df = pd.DataFrame(data) ’é¦ # Display the original DataFrame ’é¦ print("Original DataFrame:") ’é¦ print(df) ’é¦ print() ’é¦ # Clean and format the data ’é¦ # 1. Convert Age to numeric and fill missing values with the median age ’é¦ df['Age'] = pd.to_numeric(df['Age'], errors='coerce') 23 median_age = df['Age'].median() # Calculate median age df['Age'].fillna(median_age, inplace=True) # Fill missing values with median # 2. Remove rows with missing or empty values in City and Gender columns df = df[df['City'].notna() & df['Gender'].notna() & (df['Gender'] != '')] # 3. Convert Salary to numeric and remove dollar signs df['Salary'] = df['Salary'].replace('[$,]', '', regex=True).astype(float) # Display the cleaned and formatted DataFrame print("Cleaned and Formatted DataFrame:") print(df)
- 24. ’é¦ Handling Missing Values: ’é¦ Missing values are common in datasets and can significantly affect the performance of machine learning models if not handled properly. ’é¦ Techniques for handling missing values include: ’é¦ Imputation: Replacing missing values with a calculated or estimated value (e.g., mean, median, mode). ’é¦ Deletion: Removing rows or columns with missing values. ’é¦ Advanced techniques like predictive modeling to estimate missing values based on other features. ’é¦ The example is same as previous. 24
- 25. ’é¦ Feature Scaling: ’é¦ Feature scaling is the process of standardizing or normalizing the range of independent variables or features in the dataset. ’é¦ It is essential for algorithms that are sensitive to the scale of the input features, such as gradient descent-based algorithms (e.g., linear regression, logistic regression) or distance-based algorithms (e.g., k-nearest neighbors, support vector machines). ’é¦ Common techniques for feature scaling include: ’é¦ Min-Max Scaling: Scaling features to a fixed range, usually [0, 1]. ’é¦ Standardization (Z-score normalization): Scaling features so that they have the properties of a standard normal distribution with a mean of 0 and a standard deviation of 1. ’é¦ Robust Scaling: Scaling features using statistics that are robust to outliers, such as the median and interquartile range. 25
- 26. ’é¦ Feature Scaling: ’é¦ import numpy as np ’é¦ from sklearn.preprocessing import MinMaxScaler, StandardScaler ’é¦ # Sample dataset with two features ’é¦ data = np.array([[10, 0.5], ’é¦ [20, 0.7], ’é¦ [30, 0.9]]) ’é¦ # Min-Max Scaling ’é¦ scaler_minmax = MinMaxScaler() # Initialize MinMaxScaler ’é¦ data_minmax = scaler_minmax.fit_transform(data) # Perform Min-Max Scaling ’é¦ print("Min-Max Scaled Data:") ’é¦ print(data_minmax) ’é¦ print() ’é¦ # Standardization (Z-score normalization) ’é¦ scaler_standard = StandardScaler() # Initialize StandardScaler ’é¦ data_standard = scaler_standard.fit_transform(data) # Perform Standardization ’é¦ print("Standardized Data:") ’é¦ print(data_standard) 26