LiuT_GIS_Jan22_brief
Download as pptx, pdf0 likes119 views

This document summarizes various spatial analysis methods for evaluating tobacco retailer outlet (TRO) exposure, including: 1) using cluster analysis and spatial weighting to identify areas of high smoking activity and buildings associated with clusters; 2) creating probability surfaces of smoking activity through empirical Bayesian kriging and kernel density estimation; and 3) evaluating TRO exposure by calculating the number of smoking activity points within buffer zones of varying distances from each TRO to rank the most exposed TROs.


LiuT_GIS_Jan22_brief
- 1. GIS PROGRESS BRIEF Tianyuan Liu Jan 22 2016
- 2. Outline Ō¢Ā Cluster Presentation (for Annotation Purpose) Ō¢Ā Probability surfaces Ō¢Ā Spatial weighted overlay (distance toTRO + density)
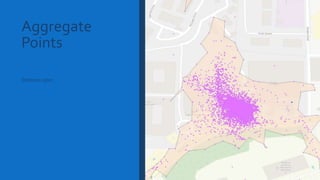
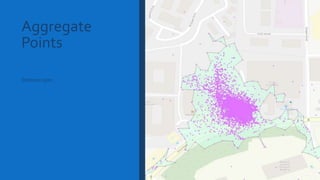
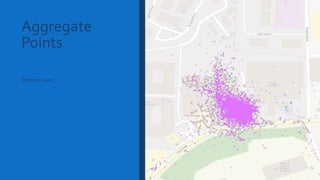
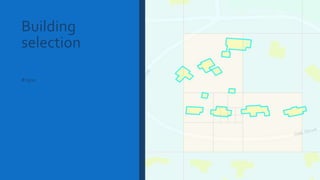
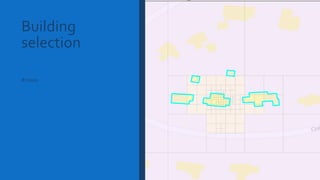
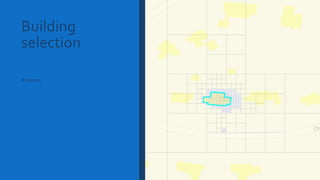
- 4. Aggregate Points Ō¢Ā Generate polygons to enclose points that shows clustered patterns ŌĆō Tool: CartographyTools/Generalization/Aggregate Points ŌĆō Simplify the presentation of clusters Ō¢Ā Use the polygons to intersect with existing building footprints ŌĆō Potentially identify the buildings where the person spends long time Ō¢Ā Caveats: ŌĆō Oversimplify the cluster Ō¢Ā Cluster of 3 points or more
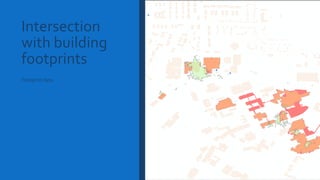
- 8. Intersection with building footprints Using distance=10m as an example
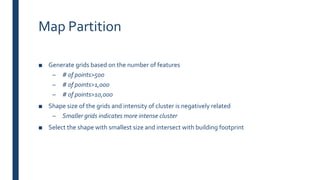
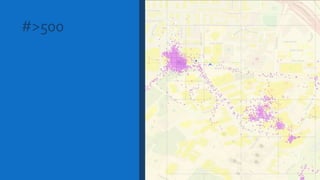
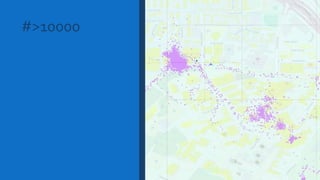
- 10. Map Partition Ō¢Ā Generate grids based on the number of features ŌĆō # of points>500 ŌĆō # of points>1,000 ŌĆō # of points>10,000 Ō¢Ā Shape size of the grids and intensity of cluster is negatively related ŌĆō Smaller grids indicates more intense cluster Ō¢Ā Select the shape with smallest size and intersect with building footprint
- 11. #>500
- 12. #>10000
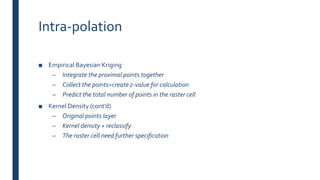
- 17. Intra-polation Ō¢Ā Empirical Bayesian Kriging ŌĆō Integrate the proximal points together ŌĆō Collect the points=create z-value for calculation ŌĆō Predict the total number of points in the raster cell Ō¢Ā Kernel Density (contŌĆÖd) ŌĆō Original points layer ŌĆō Kernel density + reclassify ŌĆō The raster cell need further specification
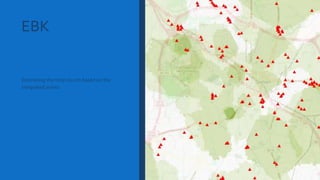
- 18. EBK Estimating the total counts based on the integrated points
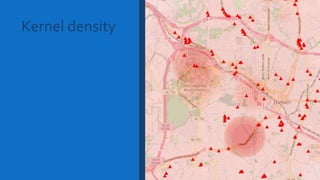
- 19. Kernel density
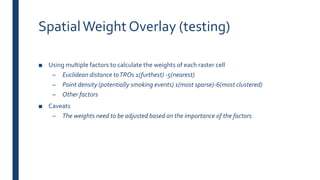
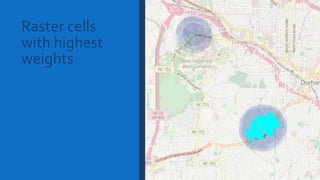
- 21. SpatialWeight Overlay (testing) Ō¢Ā Using multiple factors to calculate the weights of each raster cell ŌĆō Euclidean distance toTROs 1(furthest) -5(nearest) ŌĆō Point density (potentially smoking events) 1(most sparse)-6(most clustered) ŌĆō Other factors Ō¢Ā Caveats ŌĆō The weights need to be adjusted based on the importance of the factors
- 24. Total count of numbers within the geometric buffer Ō¢Ā UsingTRO buffers to intersect the original data points ŌĆō 30m buffer ŌĆō 30-50m buffer ring ŌĆō 50-100m buffer ring Ō¢Ā Rank theTROs by the total number of points fall in the three buffer (ring) Ō¢Ā Most exposedTROs and the distribution of activity points within the buffer
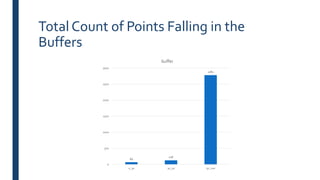
- 25. Total Count of Points Falling in the Buffers 69 126 2782 0 500 1000 1500 2000 2500 3000 0_30 30_50 50_100 buffer
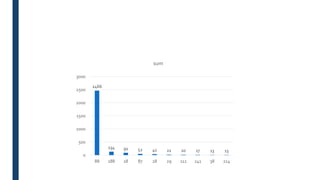
- 26. 2466 134 91 52 41 22 20 17 13 13 0 500 1000 1500 2000 2500 3000 88 188 18 87 28 29 111 241 38 214 sum
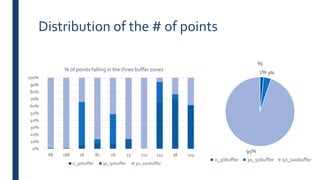
- 27. Distribution of the # of points 0% 10% 20% 30% 40% 50% 60% 70% 80% 90% 100% 88 188 18 87 28 29 111 241 38 214 % of points falling in the three buffer zones 0_30buffer 30_50buffer 50_100buffer 2% 3% 95% % 0_30buffer 30_50buffer 50_100buffer
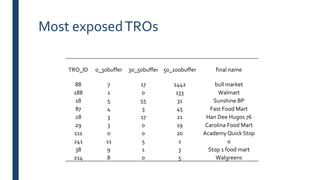
- 28. Most exposedTROs TRO_ID 0_30buffer 30_50buffer 50_100buffer final name 88 7 17 2442 bull market 188 1 0 133 Walmart 18 5 55 31 Sunshine BP 87 4 3 45 Fast Food Mart 28 3 17 21 Han Dee Hugos 76 29 3 0 19 Carolina Food Mart 111 0 0 20 Academy Quick Stop 241 11 5 1 0 38 9 1 3 Stop 1 food mart 214 8 0 5 Walgreens
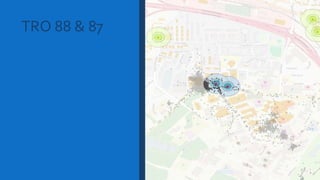
- 29. TRO 88 & 87
Editor's Notes
- #4: The heat map function is not well supported in ArcGIS, therefore I am looking for some substitutions. I am testing about generating heat maps in QGIS.
- #5: Creating a boundary with the points by enclosing points being identified with a cluster pattern. Might lose some information at the fringe of the polygons.
- #10: Feedback: useful for annotation
- #11: Similar idea with aggregate: trying to identify the area that can be used to annotate.
- #16: The higher threshold is set, the more accurate the buildings are identified. Extreme clusters and less clusterd area Demand: interactive, heatmap overlapping
- #18: Still in progress. Testing Geostatistics Tools (IDW, Kriging), Spatial Analyst Tools (distance, density), and others.
- #20: Why not using cartoBD
- #22: TRO identification showing weights the factors Annotation: feb 15 start tracking 2 weeks, bring data back
- #23: This tool can be used to evaluate the importance of the TROs (with relative different weights to each participant), the distance to the specific TROs, and other attributes such as the probability of staying in the lieu.
- #25: Geometric buffer:building footprint + front gate
- #30: Can be used to create a weight table for further calculation. Feed back=need more screenshots Spreadsheet: TRO correction Priority: Buffers with refined TROs IRB certificate Comparison: 12 important TROs vs 12 non-important out of activity spaces TROs=adding attribute table, census data, types of business (distance to the nearest high school, zoning, ), store type coding, other codes (descriptive variables? Types to the TRO)