The document summarizes information about the Prudential Regulation Authority (PRA) stress test scenarios for UK banks in 2014 and 2015. It provides details on the key economic metrics used in the adverse scenario, including a 3.9% drop in GDP, 6.5% inflation rate, 5.2% rise in unemployment, 35% fall in house prices and 30% drop in commercial real estate prices. It also outlines the PRA's methodology, including implementation of capital rules, no prudential filters for assets, and minimum capital ratios of 7% CET1 in the base case and 4.5% in the stress case.
Credit Suisse is scaling down its Prime Services unit. The revenue impact may be minimal: the bank has a strong synthetic financing capability, which could be folded into equity derivatives.
We disagree with the mainstream medias unflattering coverage. CS cautious approach to restructuring is justified by the uncertain regulatory outlook, and the bank is, in fact, very close to achieving its key financial targets.
This document provides a general overview of non-performing loans (NPLs) on a global scale. It discusses that NPLs increased significantly following the 2008 financial crisis for banks in the US, Europe, and Asia. In Europe specifically, the level of NPLs across major banks was 6% of total loans outstanding or 10% excluding other financial institutions, compared to 3% for major US banks. Most Asian banking systems saw NPL ratios fall below 5% after the crisis. The document aims to educate about causes and effects of NPLs as well as mechanisms for banks to manage high NPLs.
Non Performing Loans (NPLs) how to handle and optimizeL叩szl坦 rvai
油
NPL portfolios across Europe
2.
Outcome and treatment in the AQR test of ECB
3.
Relevance for banks equity and P&L account
4.
Possible solution strategies: restructure, liquidate, sale
5.
Sale of NPLs
6.
NPLs of corporates, real estate and retail
7.
Most successful recoveries for corporate loans
This document summarizes a presentation on redefining business models in the post-trade industry. It discusses several key points:
1. Regulatory changes and market forces are converging and forcing banks to reevaluate their business models, exit unprofitable lines, and focus on reducing costs.
2. Independent research shows returns for capital markets businesses declining while regulation and costs increase, putting pressure on profitability.
3. Emerging technologies, providers, and partnerships provide opportunities for banks to tackle high costs by moving to variable models, combining resources, and outsourcing certain functions.
4. The market and competitive landscape is redefining as larger non-bank firms enter the space and competitors combine various post
CardinalStone Research - Banking sector update-where will the dust settle (2)Clement Adewuyi
油
The document analyzes the potential impact of further depreciation of the Nigerian naira on the capital adequacy ratios of Nigerian banks. It finds that based on half-year 2016 results, five out of seven banks saw declines in their capital adequacy ratios following the 42% devaluation in June 2016. Simulations of capital adequacy at exchange rates of N305, N350 and N400 to the dollar indicate that only a few banks would remain above regulatory minimums of 15% at higher exchange rates. The author believes continued naira depreciation could significantly erode bank capital and negatively impact the financial system.
This document summarizes an investment note on Access Bank's recent $300 million Eurobond issuance and its bonds maturing in 2021. It discusses the bank's strong financial performance in recent years and stable asset quality. While the new bond issue will help refinance existing debt, its higher yield may reduce earnings from currency swap assets. The note recommends allowing time for the new bond's price to stabilize before investing.
This presentation discusses non-performing assets (NPAs) in the Indian banking sector. It defines NPAs as loans where interest or principal payments are overdue for more than 90 days. NPAs hurt bank profitability, liquidity, and capital adequacy. Common causes of NPAs include willful defaults, diversion of funds, and an inability to raise capital. While banks have taken measures to manage NPAs like quick identification and monitoring, NPAs remain a major concern as they affect asset quality and bank survival. Proper NPA management is essential for a healthy banking environment.
MTBiz is for you if you are looking for contemporary information on business, economy and especially on banking industry of Bangladesh. You would also find periodical information on Global Economy and Commodity Markets.
Signature content of MTBiz is its Article of the Month (AoM), as depicted on Cover Page of each issue, with featured focus on different issues that fall into the wide definition of Market, Business, Organization and Leadership. The AoM also covers areas on Innovation, Central Banking, Monetary Policy, National Budget, Economic Depression or Growth and Capital Market. Scale of coverage of the AoM both, global and local subject to each issue.
MTBiz is a monthly Market Review produced and distributed by Group R&D, MTB since 2009.
Tricumen / 'Rescuing' banks from Hedge Fund & Private Equity investments_9-Ja...Tricumen Ltd
油
Rescuing banks from Hedge Fund & Private Equity investments
Our analysis shows that Top 14 US and European banks generated $35.5bn in net revenue from their HF and PE investments in 5 years to end-2011
and that revenue is likely to all but disappear as a result of the Volcker Rule and similar legislation being discussed in Europe and APAC.
This document defines non-performing assets (NPAs) for banks and outlines how they are classified and provisions are made for them. It states that an asset becomes non-performing when it stops generating income for the bank. It was defined as a credit facility where interest or principal has remained past due for a specified period. This period was reduced over time to two quarters by 1995 and then a 90 day past due norm was adopted in 2004. The document also describes how NPAs are classified as substandard, doubtful or loss assets depending on how long they have been non-performing. It provides the classification categories and associated provisioning requirements. Trends in NPA levels across public and private sector banks in India are also presented
NPA - Non Performing Assets by Meka SantoshSantosh Meka
油
NPA which is gobal problem for the banks with the borrower who they not pay money back to the banks with the given period of time.The silde have been describing toward INDIAN bank. More over it includes the impact, problem, solution and action taken by RBI and Govt of India to solve the issue of NPA.
The document provides information about Tele2 AB's proposal for a mandatory share redemption to be voted on at the Annual General Meeting on May 13, 2013. If approved, each Tele2 share will split into two shares, one of which will be redeemed for SEK 28 per share. Approximately SEK 12.5 billion will be distributed to shareholders. The redemption shares will trade from May 21 to June 5, after which they will be automatically redeemed on June 14. The proposal aims to return value to shareholders from the sale of Tele2 Russia.
This document discusses non-performing assets (NPAs) in the banking sector. It defines NPAs as loans that are in default or where payments are delayed. It categorizes NPAs as sub-standard, doubtful, and loss assets based on the period of default. The document also discusses the provisioning required for different categories of NPAs, the effects of high NPAs on banks, and tools used by banks to recover NPAs such as the SARFAESI Act and debt recovery tribunals.
Non-performing assets (NPAs) refer to loans that are in default or close to being in default. NPAs have become a major issue for Indian banks and financial institutions, totaling over Rs. 1.1 trillion. The origin of rising NPAs lies in poor credit risk management practices in banks. To resolve NPAs, the government established asset reconstruction companies (ARCs) to purchase NPAs from banks and resolve them to enable banks to focus on core operations and lending. ARCs operate under the legal framework of the Securitization and Reconstruction of Financial Assets and Enforcement of Security Interest Act of 2002.
Central Bank of Finnish Savings Banks - Full Rating report in EnglishS辰辰st旦pankki Sparbanken
油
Central Bank of Savings Banks Finland Plc is the central credit institution of Savings Banks Group in Finland. Standard & Poor's rates Central Bank of Savings Banks with an A- long-term issuer credit rating with a negative outlook. The rating reflects Savings Banks Group's weak business position due to its concentrated operations in Finland, very strong capitalization, and moderate risk position due to loan concentration. The negative outlook reflects risks from Finland's weak economic recovery and potential changes to extraordinary government support under new EU resolution frameworks.
This document discusses non-performing assets (NPAs) in the Indian banking system. It defines NPA and categorizes them as standard, sub-standard, doubtful or loss assets. It examines the causes of NPA, including lack of due diligence, speculation, default, fraud and policy changes. The high levels of NPA have negatively impacted banks' profits, cash flows, goodwill and equity values. The document analyzes factors driving the rise in NPA, both internal like management issues, and external like economic conditions. It provides bank-wise NPA ratios for 2017-18 and discusses strategies to manage NPA, including preventive monitoring and curative actions like restructuring loans, settlements and legal recovery processes.
A non-performing asset (NPA) is a loan or advance where interest or principal remains overdue for a period of 90 days. NPAs are categorized as substandard, doubtful, or loss assets based on how long they have remained non-performing. The Reserve Bank of India mandates minimum provisioning norms for each category - 0.25% for standard assets, 10-100% for substandard/doubtful assets depending on period outstanding, and 100% for loss assets. The document provides gross and net NPA figures for a bank for the year ended March 2011, along with movement in provisions.
A powerful presentation on non performing assets which very much influencial when presented before others. Being a law student, I myself created the presentation and presented before the elite authorities which impressed them to a larger extent.
This document discusses the management of non-performing assets (NPAs) by banks in India. It defines NPAs and categorizes them into substandard, doubtful, and loss assets. It outlines the provisioning norms required for each category. The document also discusses the factors that contribute to the growth of NPAs, their impact on bank operations, and the status of NPAs from 2005-2006. It describes various preventive measures taken by RBI and resolution methods used by banks to manage NPAs such as compromise settlements, restructuring, Lok Adalats, corporate debt restructuring, and SARFAESI Act.
This document discusses non-performing assets (NPAs) in banks, particularly public sector banks in India. It notes that NPAs occur when borrowers default on loan repayments of principal or interest, representing credit risk for banks. Growing NPAs negatively impact banks by reducing profits from interest income, increasing provisioning costs, and eroding capital resources. The rise in Indian public sector bank NPAs in recent years was attributed to the global recession and domestic economic slowdown impacting corporate and SME borrowers. Data showed thirty large companies owed over $2 billion to public banks, and gross NPAs as a percentage of advances have been trending upward, representing stressed assets that banks must address going forward.
This document discusses non-performing assets (NPAs) in banks. It defines NPAs as loans where interest or principal payments are overdue by 90 days. It describes how the Reserve Bank of India conducted an Asset Quality Review in 2015-2016 to check if banks were properly classifying assets, as the central bank believed banks were hiding bad loans. The document also outlines the different classifications of assets - standard, sub-standard, doubtful, and loss - and how higher levels of NPAs negatively impact banks' profits and balance sheets by requiring higher provisions. It gives examples of specific banks like ICICI that reported sharp drops in profits after the asset review revealed higher NPAs.
BMA Capital - Pakistan banks adopt a switch strategy!bmacapital
油
The document discusses recent headwinds facing the Pakistani banking sector, including monetary easing, interest rate corridor reductions, and new taxation measures. It recommends investors switch to blue chip banks like UBL, HBL, and ABL that have diversified income, strong asset quality, and lower costs. Moody's also upgraded ratings for some major Pakistani banks based on strengthening financial profiles. The budget proposals are expected to reduce earnings for banks in 2015 and 2016 through increased taxes on income and lower tax refund rates.
Non-performing assets (NPAs) are loans that are in default or close to being in default. In India, NPAs are classified as standard, sub-standard, doubtful, or loss assets depending on the period of default. The NPA rate in Indian banks peaked in 2015 at over 5% due to bad loans in sectors like infrastructure and steel. Measures to reduce NPAs include debt recovery tribunals, loan restructuring, and selling NPAs to asset reconstruction companies at a discount. High NPAs have significantly impacted Indian bank profits in recent years.
This document discusses non-performing assets (NPAs) in the banking sector. It defines NPAs as loans where interest or principal payments are overdue by more than 180 days. It describes the different categories of NPAs based on their risk level and explains how gross and net NPAs are calculated. The document then outlines various internal and external factors that can cause loans to become NPAs, the impact of high NPAs on banks' profitability and liquidity, and some methods that banks use to reduce their NPAs, such as the SARFAESI Act, Lok Adalats, and compromise settlements.
Research on banking sector by witty advisoryAnkit Gupta
油
The document provides an analysis and outlook of the Indian banking sector as of June 5th, 2012 by Witty Advisory. It discusses key parameters like earnings per share, price-to-earnings ratio, revised banking rates, ratio analysis terms, and an outlook on major banks. Overall, it finds the banking sector has been relatively insulated from the global financial crisis but notes signs of slowing economic growth. It provides performance metrics and commentary on several large banks and concludes with a short-term outperforming outlook for the sector overall in the long-term.
The document discusses non-performing assets (NPAs) in the Indian banking system. It defines NPAs and outlines the different categories of assets based on their performance - standard, sub-standard, doubtful, and loss assets. Gross and net NPAs are also defined. The rise of NPAs can be attributed to both internal and external factors. Banks employ both preventive and curative strategies to manage their NPAs, such as restructuring loans, pursuing debt recovery, and using asset reconstruction companies. Tables show trends in NPAs for public sector banks, private banks, and all scheduled commercial banks from 2006-2007 to 2010-2011.
Leveling the Playing Field in Liquidity Management & Solutions for Participat...Erkan Kilimci
油
Updated version presentation prepared for Islamic Finance Conference
https://www.google.com.tr/url?sa=t&rct=j&q=&esrc=s&source=web&cd=2&cad=rja&uact=8&ved=0ahUKEwjrqerv3vfLAhUBLZoKHamNCesQFgghMAE&url=http%3A%2F%2Fwww.borsaistanbul.com%2Fdocs%2Fdefault-source%2Fduyuru-dosyalari%2Fttp022-may-june-2014-islamic-finance-48-53.pdf%3Fsfvrsn%3D2&usg=AFQjCNGZTX5iVaIC5XSB0eoCSLNVZnC7Dg&sig2=fRsFOA58DCbPBYr70N74GQ
This document compares the non-performing assets (NPAs) of State Bank of India and HDFC Bank for the years 2008-2012. It defines NPAs and outlines categories and provisioning norms. SBI had higher gross and net NPA ratios compared to HDFC Bank for all years. While SBI's gross NPA ratio ranged from 4.43% to 4.61%, HDFC Bank's ratio was lower at 1.02% to 1.05%. Similarly, SBI's net NPA ratio was between 1.63% to 1.82% versus 0.18% to 0.19% for HDFC Bank, indicating better asset quality and loan recovery rates at HDFC Bank. The document concludes with a
This document summarizes a presentation given by Jeremy Lee of Redington and Nobby Clark of HSBC Pensions Solutions Group on non-cash funding solutions for pension schemes. The agenda included discussions of alternative funding options to cash such as asset-backed structures, a brief history of these types of deals, recent transactions completed, issues to consider, and an HSBC case study. Key points covered included how asset-backed deals can reduce funding deficits and IAS19 deficits while providing greater security for pension schemes through secured interests in corporate assets. Recent large deals were highlighted including those done by M&S, Lloyds, and John Lewis. Risks around asset concentration, future surplus management, and valuation were also noted.
Mercer Capital's Bank Watch | July 2015 | Small Bank Holding Companies Regula...Mercer Capital
油
Brought to you by the Financial Institutions Team of Mercer Capital, this monthly newsletter is focused on bank activity in five U.S. regions. Bank Watch highlights various banking metrics, including public market indicators, M&A market indicators, and key indices of the top financial institutions, providing insight into financial institution valuation issues.
Standard Chartered_credit risk management 140116Tricumen Ltd
油
Standard Chartered credit risk management
The collapse of Standard Chartereds ROE over the past three years was largely caused by rising impairment costs. In our view, the growth in impairments suggests that there are issues with the bank's risk management, rather than with the underlying business proposition.
The bank's current approach appears fragmented and lacks some of the dynamic techniques used to create a 'fortress balance sheet' of top-tier global universal banks.
The new senior management team appears well placed to effect such changes. The bank is undergoing a major strategic review, the focus of which is its local corporate and commercial banking franchise in key markets.
This document summarizes recent economic and banking news from Sri Lanka. It discusses Commercial Bank's results and branch openings. It notes Fitch downgrading Sri Lanka's credit rating to B+ with a negative outlook due to high debt levels and weaknesses. Inflation is rising in Sri Lanka driven by increases in core inflation. The trade deficit widened in 2015 as exports declined while imports saw a smaller drop. Moody's also cut China's outlook to negative due to rising debt and policy uncertainties.
Illiquid collateral and bank lending in euro area - Barthelemy et al. (2017)Benoit Nguyen
油
Presentation slides for the paper 'Illiquid collateral and bank lending during the Euro sovereign debt crisis'. Full paper downloadable here: https://publications.banque-france.fr/en/illiquid-collateral-and-bank-lending-during-european-sovereign-debt-crisis
131005 essential information neeed by members of the board of directors of banks191944
油
This presentation is intended for directors of banks in developing markets who may have limited technical knowledge. It seeks to provide them with an understanding of how banks work and what decisions they will have to make as directors responsible for the bank.
This document summarizes the financial results for OneSavings Bank for the year ended 31 December 2015. Key highlights include underlying profit before tax increasing 52% to 贈105.9m, loans and advances growing 31% to 贈5.1bn, and the cost to income ratio further reducing to 26%. The CEO notes continued strong performance across key metrics and growth in commercial lending segments. Looking forward, the bank remains well positioned for growth despite some potential headwinds in the buy-to-let market from tax changes.
The document discusses evolving liquidity issues and recent reports on strengthening liquidity standards from various financial institutions. It outlines the FSA's new framework for liquidity risk management including three approaches for intragroup liquidity - self sufficiency, whole firm waiver scheme, and intragroup firm waiver scheme. Key requirements under the approaches and implications for firms are summarized.
Liquidity Management of Standard Bank Limited: A Study on CDA Avenue Branch,...Md. Erfanul Hoque
油
This document summarizes a study on the liquidity management of Standard Bank Limited in Bangladesh. It discusses Standard Bank's liquidity position and ratios from 2013-2016. The bank maintained adequate reserves to meet regulatory requirements but faced some short-term liquidity gaps. The study recommends that Standard Bank improve its liquidity management strategies and policies to better deal with liquidity risks and disruptions. Diversifying funding sources and maintaining sufficient high-quality liquid assets were also suggested.
BOA Credit Research (Financial Institutions) 2016Pawan Talreja
油
The memorandum requests establishing a new $53.98 million investment limit in Bank of America Corporation (BAC) bonds for Safra National Bank of New York. Fitch rates BAC A/Stable as of July 2016. BAC has improved its earnings but still lags peers. Continued earnings growth and exceeding its cost of capital could lead to higher ratings. BAC has a large retail deposit base and strong liquidity. The analysis provides an overview of BAC's business segments and financial performance with total assets of $2.14 trillion as of Q1 2016.
SoSeBa Bank - Risk Managment of a fictitious BankAlliochah Gavyn
油
The document discusses risk management at SoSeBa Bank in Mauritius. It introduces the bank and outlines its mission to provide banking services to the working class population. It then discusses key risks like credit, liquidity, and market risk that the bank needs to measure and manage. It provides an overview of banking regulations in Mauritius as well as international standards like the Basel Accords. The document emphasizes the importance of robust risk management practices like risk modeling, exposure limits, and stress testing for the long-term success of the new bank.
Tricumen / Barclays Investment Bank_extending the cuts_151215Tricumen Ltd
油
Barclays Investment Bank: extending the cuts
Barclays remains focused on underlying profitability. Historically, however, the bank's main challenge was revenue generation, rather than cost control.
Our analysis highlights APAC equities, global credit, EMEA securitisation and US commodities as key areas of weak profitability.
The BBA and Oliver Wyman published a report on the competitiveness of the UK as an international banking center. The report finds that while the UK banking sector and international banking play a critical role in the UK economy, the UK's advantages as a banking hub have eroded in recent years. New technologies and growing competitors like Singapore and Hong Kong threaten the UK's position. The report recommends that the UK government, regulators, and industry work together to develop a vision and coherent strategy to promote the UK's competitiveness, including establishing sound global regulation, predictable domestic regulation, talent attraction, and innovation support.
X IDB Debt Group Annual Meeting . Regulations and sovereign riskCristina Pailh辿
油
1. New financial regulations like Basel III have direct and indirect consequences for sovereign debt markets by influencing banks' demand and pricing of sovereign debt.
2. Regulations like capital requirements, leverage ratios, and liquidity ratios incentivize banks to accumulate sovereign debt to meet requirements. Sovereign debt counts favorably for meeting ratios.
3. However, banks are no longer considered risk-free and high sovereign debt loads could undermine financial stability if a sovereign defaults. Regulations aim to balance financial stability with banks' sovereign debt demands.
Over and Under Valued Financial Institutions: Evidence from a Fair-Value...Ilias Lekkos
油
The aim of the study is to present our approach that allows us to evaluate relative over- and under-valuation of financial institutions based on the distance between their market-based price to book ratios and our estimated "fair-value" P/Bs.
We recently worked with a non banking financial institution and helped them create a professional looking version of their existing loan policy documents. The intent was to keep the document clean and impactful whilst breaking away from the usage of Word.
Most of the times these documents are made in softwares such as InDesign but we made it in PowerPoint. The client not only benefited because the document was editable but was also able to re-use it for future projects. Also, the cost of creating this document was in PowerPoint was 8 times lesser than what they would have paid for InDesign work!
Credit: A Core Building Block for DB Schemes Investing in a Low Yield Environ...Redington
油
The document summarizes a presentation given by Robert Gardner and Pete Drewienkiewicz of Redington on using credit as a key building block for defined benefit pension schemes. It discusses using credit strategies to increase returns in a low yield environment. It provides examples of restructuring a client's credit portfolio to incorporate more absolute return and illiquid credit strategies. It also presents a framework for overcoming governance hurdles to implementing credit strategies and concludes that credit offers pension funds tools to increase returns in a risk-controlled manner.
2. BEYOND CREDIT RATINGS
2
Output
Qualitative Factors
Credit
Ratings
Institution/Limits
LiquidityFunding
Lending
Exposure
6 Factor Quantitative Framework
Basel III
Relationship strength, operational reach, news flow and ease of business
Input
Combining traditional measures with these factors provides a strong
framework to set counterparty limits
Market
Data
Capital
Buffer
Regulatory
Environment
An approach to assessing and monitoring your bank limits beyond traditional Credit Ratings
3. LOW RISK BUSINESS MODEL
3
Increasing recognition of balance sheet strength and de-risking through best in peer group
CDS*
Apr-2012 101 301 15 417
Apr-2013 50 156 15 221
Apr-2014 53 74 15 142
Apr-2015 57 60 15 132
Apr-2016 59 102 15 176
15/04/16
EXAMPLE: 5YR Wholesale Deposit (bps)
PERIOD
3MTH
LIBOR
LLOYDS
BANK CDS
ARRANGEMENT
FEE
TOTAL DIFFERENTIAL
Source: Bloomberg Data & Lloyds Bank analytics as
-241
Lloyds Bank PLC 102.497
Banco Santander SA 124.779
Santander UK PLC 90.456
Barclays Bank PLC 125.947
Royal Bank Of Scotland PLC 124.573
HSBC Holdings PLC 98.39
Source: Bloomberg Data as at 15/04/16
INSTITUTION CDS (bps)
*CDS: A credit default swap is a particular type of swap designed to transfer the credit exposure of fixed income products between
two or more parties.
4. SUMMARY OF RISK FACTORS
LONG
TERM
SHORT
TERM
LONG
TERM
SHORT
TERM
LONG
TERM
SHORT
TERM
Lloyds Bank PLC 贈49,303.71 16 4.80% 13.00% A1 P-1 A+ F1 A A-1 102.497
Banco Santander SA 贈46,678.65 18 4.70% 10.05% A3 P-2 A- F2 A- A-2 124.779
Santander UK PLC N/A N/A 4.00% 11.60% A1 P-1 A F1 A A-1 90.456
Barclays Bank PLC 贈28,191.15 40 4.20% 11.10% A2 P-1 A F1 A- A-2 125.947
HSBC Holdings PLC 贈88,486.56 9 5.00% 11.90% Aa2 P-1 AA- F1+ AA- A-1+ 98.39
Royal Bank Of Scotland PLC 贈26,773.86 44 5.60% 15.50% A3 P-2 BBB+ F2 BBB+ A-2 124.573
15/04/16
FITCH S&P'S
CDS
Source: Bloomberg data as of
INSTITUTION
MARKET
CAP (MN)
MARKET
CAP
(RANKING)
(1)
LEVERAGE
RATIO (2)
FULLY
LOADED
TIER 1 (3)
MOODY'S
A typical risk summary used by treasury teams to help determine Bank limits for deposits
3. The Fully Loaded Tier 1 Ratio measures a bank's core equity capital compared with its total risk-weighted assets. This provides a form of measure of a bank's capital
adequacy or financial strength.
1. Ranking is based on the largest market capitalised banks (1731) in the world
2. The Basel III leverage ratio is defined as the Capital Measure (the numerator) divided by the Exposure Measure (the denominator), with this ratio
expressed as a percentage. The basis of the calculation is the average of the three month-end leverage ratios over a quarter. The ratio provides a form
of measure of the banks capital compared with its financial leveraging and the banks ability to meet financial obligations.
4
5. HSBC Bank PLC Lloyds Bank PLC Santander UK PLC Banco Santander SA Barclays Bank PLC RBS PLC
Fitch (review date 19th May 2015) Moody's (review date 28th May 2015) S&P (review date 9th June 2015)
FITCH
LONG TERM SENIOR DEBT RATING OF LLOYDS BANK PLC & LLOYDS BANKING
GROUP UPGRADED TO A+ FROM A (19TH MAY 2015)
MOODYS
LONG-TERM SENIOR DEBT AND DEPOSIT RATINGS OF LLOYDS BANK PLC
CONFIRMED AT A1 / P-1 & OUTLOOK UPGRADED TO POSITIVE (28TH MAY 2015)
S&P
LLOYDS SENIOR DEBT RATING ARRIFMED AT A (OUTLOOK STABLE) ON
CONCLUSION OF SOVEREIGN SUPPORT REVIEW (9TH JUNE 2015)
CREDIT RATING AGENCIES ACTIONS 2015
5
AA-
Aa2
AA-
A+ A1
A A
A1
A A A2
A-
A- A3
BBB+
A3
BBB+BBB+
One notch upgrade One notch downgrade
Revised rating landscape following Agencies removal of UK Bank assumed Sovereign support post
implementation of BRRD regulation
Spain not yet
adopted BRRD
therefore not
assessed
6. LOW RISK BUSINESS
Mortgage credit quality continues to improve with book supported by employment trends and low
interest rates
6
LBG: Lloyds Banking Group
LTV: Loan to Value
HPI: House Price Index
Source: Lloyds Banking Group FY2015 Results.
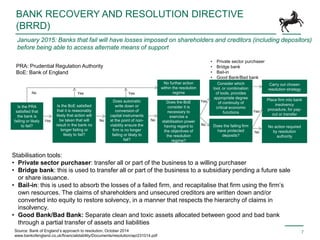
7. Is the PRA
satisfied that
the bank is
failing or likely
to fail?
Is the BoE satisfied
that it is reasonably
likely that action will
be taken that will
result in the bank no
longer failing or
likely to fail?
Does automatic
write down or
conversion of
capital instruments
at the point of non-
viability ensure the
firm is no longer
failing or likely to
fail?
Does the BoE
consider it is
necessary to
exercise a
stabilisation power
having regard to
the objectives of
the resolution
regime?
Does the failing firm
have protected
deposits?
Consider which
tool, or combination
of tools, provides
appropriate degree
of continuity of
critical economic
functions
No action required
by resolution
authority
Place firm into bank
insolvency
procedure, for pay-
out or transfer
Carry out chosen
resolution strategy
No further action
within the resolution
regimeNo
Yes
Stabilisation tools:
Private sector purchaser: transfer all or part of the business to a willing purchaser
Bridge bank: this is used to transfer all or part of the business to a subsidiary pending a future sale
or share issuance.
Bail-in: this is used to absorb the losses of a failed firm, and recapitalise that firm using the firms
own resources. The claims of shareholders and unsecured creditors are written down and/or
converted into equity to restore solvency, in a manner that respects the hierarchy of claims in
insolvency.
Good Bank/Bad Bank: Separate clean and toxic assets allocated between good and bad bank
through a partial transfer of assets and liabilities
January 2015: Banks that fail will have losses imposed on shareholders and creditors (including depositors)
before being able to access alternate means of support
Yes Yes
No No
No
Yes
Yes
No
Private sector purchaser
Bridge bank
Bail-in
Good Bank/Bad bank
PRA: Prudential Regulation Authority
BoE: Bank of England
Source: Bank of Englands approach to resolution, October 2014
www.bankofengland.co.uk/financialstability/Documents/resolution/apr231014.pdf
BANK RECOVERY AND RESOLUTION DIRECTIVE
(BRRD)
7
8. Bail-in order of priority (from January 2015)
*Interest incurred post-insolvency and liquidators will only arise in the event of liquidation where both will belong to the holding company
1
2
3
4
5
7
8
9
6
10
Source: Bank of Englands approach to resolution, October 2014
www.bankofengland.co.uk/financialstability/Documents/resolution/apr231014.pdf
Shareholders (ordinary shares)
Shareholders (preference shares)
Interest Incurred post-insolvency*
Unsecured subordinated creditors (eg subordinated bondholders)
Unsecured Senior Creditors
Floating charge holders
Preferential creditors (secondary)
Preferential creditors (ordinary)
Liquidators*
Fixed charge holders
BANK RECOVERY AND RESOLUTION DIRECTIVE
(BRRD)
8
Potential running order of a Bail In with supporting ring fence structure
9. Bail-In Waterfall (2)
12.0
2.1
Tier 2
ECN tier 2
Fully loaded
CET1
Tier 1
18.8
2.7
1.4
10.3
Dec 2013
pro forma
4.4
CET1* and total capital vs. peers(1) (%)
2015 CAPITAL POSITION OF PEER BANKS
9
Lloyds Banking Group is a strongly capitalised bank within its peer group with a 贈81bn Bail In buffer
Bail-In
贈28.5bn
贈19.5bn
贈33.0bn
贈222.0bn
贈229.0bn
贈33.0bn
Equity Capital
Sub Debt
Senior Unsecured
greater than one
year
Unsecured Funding
(e.g. Corporate &
Local Authority
Deposits)
FSCS (Retail)
Secured Funding
贈81BN
1) Peers are RBS, Barclays and HSBC as reported at Q3 2015 and Standard Chartered at HY 2015
2) Lloyds Banking Group as of 31st December 2015
3) LBG: 13.0% pro forma
*CET1: A measurement of a bank's core equity capital compared with its total risk-weighted assets. This is the measure of a bank's financial strength.
10. 贈10 loss
------------------ ------------------
贈300 assets 贈290 assets 贈290 assets
贈3 sub-debt
贈2 sub-debt
贈10 loss on
assets
贈10 loss on
assets
贈120 deposits
贈128 other
liabilities
贈9 Equity
贈40 senior
liabilities of
which 贈10
unsecured
贈40 senior
liabilities of
which 贈10
unsecured
贈33 senior
liabilities of
which 贈3
unsecured
贈9 Equity
贈120 deposits
贈128 other
liabilities
贈120 deposits
贈128 other
liabilities
Worked Bail In Example
Bank PLC has a balance sheet worth 贈300, funded by equity of 贈9 and other liabilities of 贈291.
Bank PLC incurs losses on its assets of 贈10, 贈9 of equity and 贈1 sub-debt are written down to absorb the 贈10 loss. This reduces the
assets and liabilities to 贈290.
The new balance sheet to meet the PRAs capital requirements. The 贈9 of equity and 贈1 of sub-deb have been written off to absorb
the 贈10 loss. Consequently, 贈7 of unsecured senior liabilities and 贈2 of sub-debt is converted to equity.
1 2 3
Source: Bank of Englands approach to resolution, October 2014
www.bankofengland.co.uk/financialstability/Documents/resolution/apr231014.pdf
1
2
3
贈300 贈300 Net 贈290/Gross 贈300 贈290 贈290 贈290
BANK RECOVERY AND RESOLUTION DIRECTIVE
(BRRD)
10
11. PRUDENTIAL REGULATION AUTHORITY (PRA) STRESS
TEST SCENARIOS 2014
11
Sourced from the Bank of England site (16/12/2014). http://www.bankofengland.co.uk/financialstability/Documents/fpc/keyelements.pdf
Annual GDP
Annual Inflation
Unemployment
HPI & CRE
Analysis of key metrics used by PRA
HPI: -35
CRE: -30%
+5.2%
-3.9%
+5.9%
-3.9%
SCENARIOSCAPITALRULESMETHODOLOGY
Key UK economic metrics (to trough):
GDP (Gross Domestic Product): 3.9%
CPI rate: 6.5%
Unemployment: +5.2%
HPI (House Price Index): -35%
CRE (Commercial Real Estate) : -30%
Base Rate: 4.25%
Equities: -28%
Market shock assessed against EBA
(European Banking Authority) scenarios.
PRA implementation of CRDIV
(Capital Requirement Regulation &
Directive) Capital Rules as outlined
in PS 7/13
No prudential filter applied for AFS
assets
Hurdle rates CET1 > 7% base, >
4.5% stress
Leverage ratio > 3% in base. No
hurdle in stress
Dynamic balance sheet with
deleveraging restrictions.
No post 31-Dec capital actions
included (balance sheet as of close
31 Dec 13)
Securitisation & Market risk
methodology aligned to EBA.
No additional methodology
restrictions
12. PRUDENTIAL REGULATION AUTHORITY (PRA) STRESS
TEST SCENARIOS 2015
12Sourced from Bank of England site (01/12/2015). http://www.bankofengland.co.uk/financialstability/Documents/fpc/results011215.pdf
Analysis of key metrics used by PRA
-3.9%
SCENARIOSCAPITALRULESMETHODOLOGY
Key UK economic metrics (to trough):
Oil falls to USD 38p/b
World GDP falls 7% from IMF World
economical forecast
China house prices 35%
Hong Kong CRE 45%
China GDP slows from 7.5% to 1.7%
CPI rate: -1.0%
UK house prices: -20%
UK Base Rate: 0%
CET1 ratio > 4.5% of RWAs
New Threshold for 2015 3% of
leverage exposure measure
Stress scenario would reduce
aggregate CET1 ratio across 7
banks from 11.2% to low of 7.6% in
2016
Aggregate Tier 1 leverage ratio
falls from 4.4% at the end of 2014 to
low of 3.5% in 2016
Designed to assess resilience of
UK banks
2015 stress test has 3 main
components:
1. Macroeconomic factors
2. Trade risk element of stress
3. Stressed projections for
potential misconduct
In house modelling played a
greater role than 2014 test
CPI and Bank Rate in the UK in the 2014 and
2015 stress scenarios
Differences in severity of GDP shocks between the
2014 and 2015 stress tests
Projected cumulative five-year impairment charges in
China and Hong Kong
UK residential property price index and commercial
real estate index in the 2014 and 2015 stress
scenarios
13. PRUDENTIAL REGULATION AUTHORITY (PRA) STRESS
TEST 2014 VS 2015
13
4.7%
5.0%
3.9%
5.0%
4.6%
5.0%
3.5%
4.2%
3.6%
4.1%
2.4%
3.9%
2.0%
2.9%
4.1%
3.5%
3.0%
3.2%
2.6%
3.3%
2014 2015 2014 2015 2014 2015 2014 2015 2014 2015
Lloyds Banking Group Royal Bank of Scotland HSBC Barclays Santander UK
Leverage Ratio Leverage Ratio (PRA Stressed)
PRA Stress Leverage Ratio Test Results
12.0%
13.7%
10.8%
12.7%
11.2%
11.8%
10.0%
11.1%
11.8% 11.7%
5.0%
9.5%
4.6%
5.9%
8.7%
7.0% 7.0% 6.8%
7.6%
9.5%
2014 2015 2014 2015 2014 2015 2014 2015 2014 2015
Lloyds Banking Group Royal Bank of Scotland HSBC Barclays Santander UK
CET1 Ratio CET1 Ratio (PRA Stressed)
PRA Stress CET1 Ratio Test Results
Sourced from the Bank of England site (01/12/2015). http://www.bankofengland.co.uk/financialstability/Documents/fpc/results011215.pdf
Past performance is not a guarantee of future results
14. BASEL III REPLACES INDIVIDUAL LIQUIDITY
ADEQUACY STANDARD (ILAS)
14
Key changes for Bank stress event buffer
*30 Day coverage period is called Liquidity Coverage Ratio (LCR)
Cash comes in 2 types
Basel III Coverage Period*
ILAS Coverage Period
Day 1 30 Days 94 Days
1
2
Current A/C
Client A/C
Cash Management
Call A/C
Term / Notice
Current A/C
Client A/C
Cash Management
* Subject to economic incentive guidelines for calculation of LCR
Operational Investment
Cash held contractually less than 30 days falls into the Basel III Coverage period
15. OUTFLOW COVERAGE: LIQUIDITY COVERAGE RATIO
(LCR)
15
LCR 1 day to 30 days coverage duration
Operational*
Current A/C
Client A/C
Cash Mgmt
Investment
Call A/C
Current A/C
Client A/C
Cash Mgmt
Day 30
32 Days 95 Days
3 months 6 monthsDay 1
Notice A/Cs
25% Outflow
40% Outflow
Last 30 days of term deposits
needs to be covered as
Investment at 40% * Subject to economic incentive guidelines for calculation of LCR
Until notice is given there is no coverage outflow
Cash held contractually less than 30 days is now less attractive to deposit takers
16. OUR PRODUCT GUIDE
16
<3MTH
Call Account
Transactional Bank Account*
<3MTH Fixed Term Deposit
32 Day Notice Account
3-12MTH Fixed Term Deposit
12MTH Fixed Term Deposit
12MTH+ Fixed Term Deposit
OPERATIONAL CASH
Generally required within 3 Months
for day to day business
CORE CASH
Generally required between 3 to 12
Months not for day to day business
STRATEGIC CASH
Generally not required for at least
12 Months
3-12MTH
12MTH+
*Transactional Bank Account is not provided by Financial Markets and is available from your Local Relationship
Management Team
Deposit products available from Lloyds Banking Group
17. Description
Variable interest rate is paid on funds that remain committed on a rolling 32
day basis
Minimum of 贈10000 and a maximum of 贈5,000,000
1
can be withdrawn giving
Lloyds Bank 32 calendar days notice, providing the remaining balance is over
贈10,000
Interest is calculated by reference to the Bank of England Bank Rate
32 Day Notice Accounts are available in GBP only
Benefits
Participate fully in any increase in the Bank of England Bank Rate.
Interest is paid to the account daily.
Limitations and Risks
The interest rate received on funds will decrease if the Bank of England Bank
Rate decreases
Funds are committed for a minimum period of 32 calendar days
Once notice is given a Reversion Rate will be applied on the notice account
balance. The Reversion Rate will apply for the entirety of the notice period.
32 DAY NOTICE ACCOUNT
17
32 Day Notice Account that pays a variable interest rate and has improved return over 32 day
Fixed Term Deposit for the same tenor
Quick Facts:
Account Type Notice Deposit
Currency GBP
Minimum Notice Period 32 Days
Interest Payment
Frequency
Daily
Minimum Opening
Balance
10,000 (贈)
Minimum Withdrawal
Amount
10,000 (贈)
Minimum Account
Balance
10,000 (贈)
Maximum Account
Balance1
5,000,000 (贈)
GBP
Interest Rate2
Variable interest rate
tracking BoE Bank Rate
with an agreed margin.
Reversion Rate BoE Bank Rate
1. Larger amounts may be available at Lloyds Banks discretion
2. Indicative Interest Rate only. The Interest Rate will be agreed
with you at account opening.
18. OPTION TO USE A LAYERED APPROACH
18
You can chose to use our layering deposit solution that may deliver flexibility of liquidity
The example above left shows an example rolling layered deposit
approach where we take an example 贈1M portfolio, split out into 4
equal amounts and place into a 3, 6, 9 and 12 month deposits.
On the maturity of each deposit there are two ways the deposits
can be rolled:
1. Preserving current maturity
Each deposit is then rolled at its maturity date into the
same term.
2. Maximising Return
When each deposit matures a new 12 month deposit
is entered into. At any time there is a 3 month liquidity
on 村 of the portfolio.
0 5 10 15
Months
250
250
250
250
DepositSize贈k
Rolling layered deposit initial set up
0 5 10 15 20
Months
DepositSize贈k
1. Rolling and preserving current maturity
0 5 10 15 20
Months
DepositSize贈k
2. Rolling into 12 month deposits
This is a hypothetical illustration, actual results may vary
250 250
250 250 250
250 250 250 250
250 250 250 250 250 250 250 250
250 250
250 25
250
250250
250
250
250
19. CASH-FLOW VS YIELD PORTFOLIO REVIEW
An approach to assessing cash-flow to potentially improve yield
Typical deposit portfolio:
Long Date
(12m+)
Medium Date (3m
11m)
Short Date (1 day
3m)
Call
Operational
Long Date
(12m+)
Medium Date (3m
11m)
Call
Revised deposit portfolio:
Enhanced blended return = Y%
Operational
Short Date (1 day
3m)
Supports
payment profile
Potential mix
change but
still supports
payment
profile
19
Return on capital Return on capital
Blended return = X%
Or 贈x return sum
Please note this is for illustrative purposes only
Scenario 1 Scenario 2
20. MONTHLY CASH-FLOW TOOL EXAMPLE
20
Change your return with Lloyds Bank
Returns are based on current Lloyds Bank deposits rates. Past performance is not a guarantee of
future results and potential returns and forecasts may not be achieved
21. UK OUTLOOK
21
Source: Lloyds Bank International Financial Outlook, April 2016
Forecast may not be achieved.
Lloyds Banking Group house view on key rates
23. DISCLAIMER
23
This presentation is for information purposes only. It is intended as a summary only and whilst it contains some information about the potential
risks and benefits of various financial instruments it should not of itself, form the basis for any investment decision. Whilst Lloyds Bank has
exercised reasonable care in preparing this presentation and any views, analysis or other information expressed or presented are based on
sources it believes to be accurate and reliable, no representation or warranty, express or implied, is made as to the accuracy, reliability or
completeness of the information contained herein. If you receive information from us which is inconsistent with other information which you have
received from us, you should refer this to your Lloyds Bank Sales representative for clarification.
Not all products or transactions will fulfill your requirements. You should be aware that any product or transaction which you enter into with us is,
in the absence of any written agreement to the contrary, on the basis that you are able to make your own independent assessment and decision
as to your requirements and whether that product or transaction fulfils those requirements. Your decision will be based on your own knowledge
and experience and any professional advice which you may have sought in relation to the financial, legal, regulatory, tax or accounting aspects of
the proposed product or transaction. Lloyds Bank, its directors, officers and employees accept no responsibility or liability for any loss (whether
direct, indirect, consequential, loss of profit or damages) howsoever caused or howsoever arising, in relation to this presentation or any
subsequent product or transaction entered into.
Lloyds Banking Group plc and its subsidiaries may participate in benchmarks in any one or more of the following capacities; as administrator,
submitter or user. Benchmarks may be referenced by Lloyds Banking Group plc for internal purposes or used to reference products, services or
transactions which we provide or carry out with you. More information about Lloyds Banking Group plcs participation in benchmarks is set out in
the Benchmark Transparency Statement which is available on our website.
This communication does not constitute an offer to sell or a solicitation of an offer to buy securities in the United States (US) and is not being
directed at persons who are located in the US or who are US Persons, as defined in Rule 902 of Regulation S under the U.S Securities Act 1933,
as amended (altogether, US Persons).
Lloyds Bank is a trading name of Lloyds Bank plc and Bank of Scotland plc, which are both subsidiaries of Lloyds Banking Group plc. Lloyds Bank
plc. Registered Office: 25 Gresham Street, London EC2V 7HN. Registered in England and Wales no. 2065. Bank of Scotland plc. Registered
Office: The Mound, Edinburgh EH1 1YZ. Registered in Scotland no. SC327000. Authorised by the Prudential Regulation Authority and regulated
by the Financial Conduct Authority and the Prudential Regulation Authority under registration numbers 119278 and 169628 respectively. (09.15).