Lund 2015 - QGIS workshop
4 likes1,381 views

This document provides an agenda for a workshop on landscape ecology analysis with QGIS. The workshop will cover working with GIS data formats and attributes, projections, georeferencing, and landscape analysis using the LecoS plugin. It includes example data and exercises to analyze land cover composition and heterogeneity for study sites on the island of Gotland. The workshop is intended to help participants learn skills for visualizing spatial data, conducting landscape metrics analysis, and presenting maps in QGIS.

![Workshop ®C Lund 2015 33
Other useful stuff -
Processing R commands
Command Function
##[datagis]=group Sets the group to °∞datagis°±
##layer = vector or raster Specifies the input layer to use
##distance=number 100 Sets a number field with default 100
##title=string France Get text input. Default is °∞France°±
##field=field layer Select a field from the vector layer °∞layer°±
hist(layer[[field]]) R-command: Histogram for fields from layer
##showplots Has to be set in order to see plot outputs
>t.test(layer[[field]]) Console output with a °∞>°± before command
##output=output vector File output as vector or raster](https://image.slidesharecdn.com/newpresi-150305072007-conversion-gate01/85/Lund-2015-QGIS-workshop-33-320.jpg)
![Workshop ®C Lund 2015 34
Example Script
##[Own Scripts]=group
##showplots
##layer=vector
##y=field layer
##x=field layer
plot(as.numeric( layer[[y]] )~as.numeric( layer[[x]] ),pch=19,bty="l",ylab=paste( y ),xlab=paste( x ) )
fit = lm( layer[[y]]~layer[[x]] )
abline(fit,col="blue",lwd=2)](https://image.slidesharecdn.com/newpresi-150305072007-conversion-gate01/85/Lund-2015-QGIS-workshop-34-320.jpg)

Lund 2015 - QGIS workshop
- 1. Workshop ®C Lund 2015 1 Landscape ecology analysis with QGIS Workshop at Lund University (2015) by Martin Jung
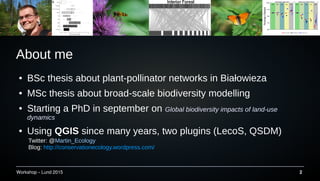
- 2. Workshop ®C Lund 2015 2 About me °Ò BSc thesis about plant-pollinator networks in Bia?owieza °Ò MSc thesis about broad-scale biodiversity modelling °Ò Starting a PhD in september on Global biodiversity impacts of land-use dynamics °Ò Using QGISQGIS since many years, two plugins (LecoS, QSDM) Twitter: @Martin_Ecology Blog: http://conservationecology.wordpress.com/
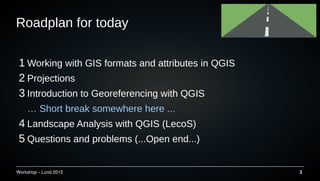
- 3. Workshop ®C Lund 2015 3 Roadplan for today 1 Working with GIS formats and attributes in QGIS 2 Projections 3 Introduction to Georeferencing with QGIS °≠ Short break somewhere here ... 4 Landscape Analysis with QGIS (LecoS) 5 Questions and problems (...Open end...)
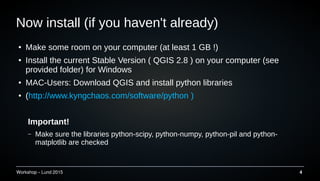
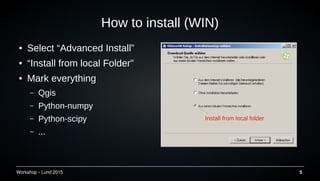
- 4. Workshop ®C Lund 2015 4 Now install (if you haven't already) °Ò Make some room on your computer (at least 1 GB !) °Ò Install the current Stable Version ( QGIS 2.8 ) on your computer (see provided folder) for Windows °Ò MAC-Users: Download QGIS and install python libraries °Ò (http://www.kyngchaos.com/software/python ) Important! ®C Make sure the libraries python-scipy, python-numpy, python-pil and python- matplotlib are checked
- 5. Workshop ®C Lund 2015 5 °Ò Select °∞Advanced Install°± °Ò °∞Install from local Folder°± °Ò Mark everything ®C Qgis ®C Python-numpy ®C Python-scipy ®C ... How to install (WIN) Install from local folder
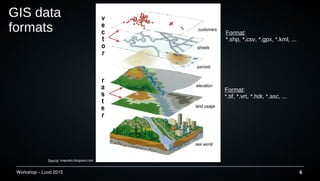
- 6. Workshop ®C Lund 2015 6 GIS data formats Source: maprabu.blogspot.com Format: *.shp, *.csv, *.gpx, *.kml, ... Format: *.tif, *.vrt, *.hdr, *.asc, ...
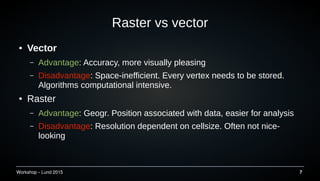
- 7. Workshop ®C Lund 2015 7 Raster vs vector °Ò Vector ®C Advantage: Accuracy, more visually pleasing ®C Disadvantage: Space-inefficient. Every vertex needs to be stored. Algorithms computational intensive. °Ò Raster ®C Advantage: Geogr. Position associated with data, easier for analysis ®C Disadvantage: Resolution dependent on cellsize. Often not nice- looking
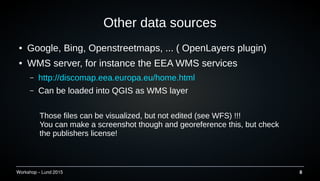
- 8. Workshop ®C Lund 2015 8 Other data sources °Ò Google, Bing, Openstreetmaps, ... ( OpenLayers plugin) °Ò WMS server, for instance the EEA WMS services ®C http://discomap.eea.europa.eu/home.html ®C Can be loaded into QGIS as WMS layer Those files can be visualized, but not edited (see WFS) !!! You can make a screenshot though and georeference this, but check the publishers license!
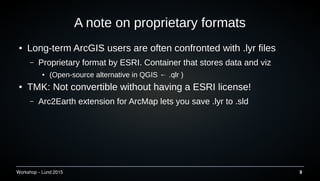
- 9. Workshop ®C Lund 2015 9 A note on proprietary formats °Ò Long-term ArcGIS users are often confronted with .lyr files ®C Proprietary format by ESRI. Container that stores data and viz °Ò (Open-source alternative in QGIS °˚ .qlr ) °Ò TMK: Not convertible without having a ESRI license! ®C Arc2Earth extension for ArcMap lets you save .lyr to .sld
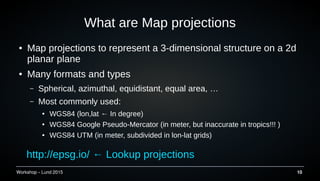
- 10. Workshop ®C Lund 2015 10 What are Map projections °Ò Map projections to represent a 3-dimensional structure on a 2d planar plane °Ò Many formats and types ®C Spherical, azimuthal, equidistant, equal area, °≠ ®C Most commonly used: °Ò WGS84 (lon,lat °˚ In degree) °Ò WGS84 Google Pseudo-Mercator (in meter, but inaccurate in tropics!!! ) °Ò WGS84 UTM (in meter, subdivided in lon-lat grids) http://epsg.io/ °˚ Lookup projections
- 11. Workshop ®C Lund 2015 11 Now hands on in QGIS
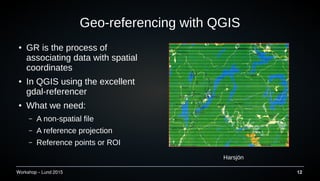
- 12. Workshop ®C Lund 2015 12 Geo-referencing with QGIS °Ò GR is the process of associating data with spatial coordinates °Ò In QGIS using the excellent gdal-referencer °Ò What we need: ®C A non-spatial file ®C A reference projection ®C Reference points or ROI Harsj?n
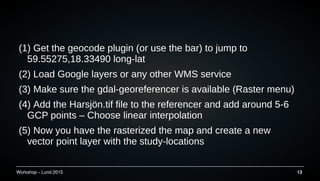
- 13. Workshop ®C Lund 2015 13 (1) Get the geocode plugin (or use the bar) to jump to 59.55275,18.33490 long-lat (2) Load Google layers or any other WMS service (3) Make sure the gdal-georeferencer is available (Raster menu) (4) Add the Harsj?n.tif file to the referencer and add around 5-6 GCP points ®C Choose linear interpolation (5) Now you have the rasterized the map and create a new vector point layer with the study-locations
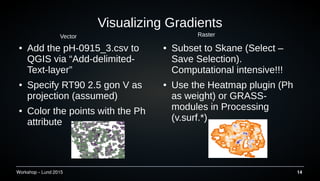
- 14. Workshop ®C Lund 2015 14 Visualizing Gradients °Ò Add the pH-0915_3.csv to QGIS via °∞Add-delimited- Text-layer°± °Ò Specify RT90 2.5 gon V as projection (assumed) °Ò Color the points with the Ph attribute °Ò Subset to Skane (Select ®C Save Selection). Computational intensive!!! °Ò Use the Heatmap plugin (Ph as weight) or GRASS- modules in Processing (v.surf.*) Vector Raster
- 15. Workshop ®C Lund 2015 15 Use the new Heatmap renderer (QGIS 2.8)
- 16. Workshop ®C Lund 2015 16 Short Break Kort paus Kurze Pause
- 17. Workshop ®C Lund 2015 17 LecoS °Ò Simple Plugin to extract landscape metrics from raster layer °Ò Inspired by FRAGSTAT °Ò With Graphical interface, but more options available in Processing Toolbox
- 18. Workshop ®C Lund 2015 18 Example Data set Use the data within the Gotland zip file
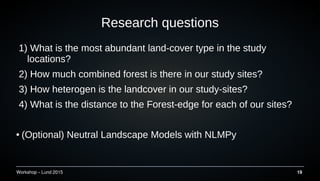
- 19. Workshop ®C Lund 2015 19 Research questions 1) What is the most abundant land-cover type in the study locations? 2) How much combined forest is there in our study sites? 3) How heterogen is the landcover in our study-sites? 4) What is the distance to the Forest-edge for each of our sites? °Ò (Optional) Neutral Landscape Models with NLMPy
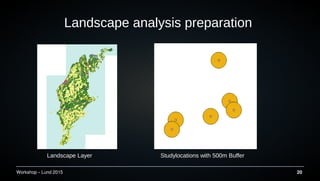
- 20. Workshop ®C Lund 2015 20 Landscape analysis preparation Landscape Layer Studylocations with 500m Buffer
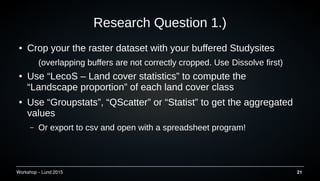
- 21. Workshop ®C Lund 2015 21 Research Question 1.) °Ò Crop your the raster dataset with your buffered Studysites (overlapping buffers are not correctly cropped. Use DissolveDissolve first) °Ò Use °∞LecoS ®C Land cover statistics°± to compute the °∞Landscape proportion°± of each land cover class °Ò Use °∞Groupstats°±, °∞QScatter°± or °∞Statist°± to get the aggregated values ®C Or export to csv and open with a spreadsheet program!
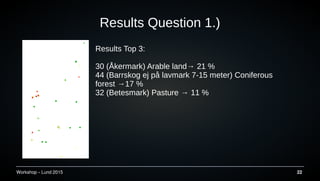
- 22. Workshop ®C Lund 2015 22 Results Question 1.) Results Top 3: 30 (?kermark) Arable land°˙ 21 % 44 (Barrskog ej p? lavmark 7-15 meter) Coniferous forest °˙17 % 32 (Betesmark) Pasture °˙ 11 %
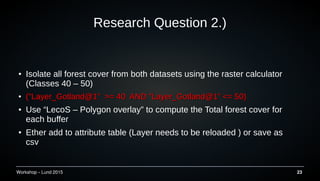
- 23. Workshop ®C Lund 2015 23 Research Question 2.) °Ò Isolate all forest cover from both datasets using the raster calculator (Classes 40 ®C 50) °Ò ("Layer_Gotland@1" >= 40 AND "Layer_Gotland@1" <= 50)("Layer_Gotland@1" >= 40 AND "Layer_Gotland@1" <= 50) °Ò Use °∞LecoS ®C Polygon overlay°± to compute the Total forest cover for each buffer °Ò Ether add to attribute table (Layer needs to be reloaded ) or save as csv
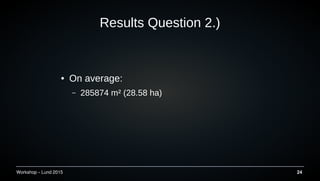
- 24. Workshop ®C Lund 2015 24 Results Question 2.) °Ò On average: ®C 285874 m? (28.58 ha)
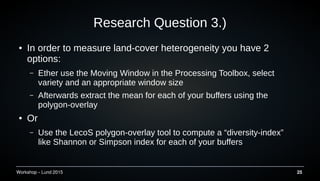
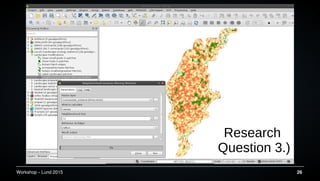
- 25. Workshop ®C Lund 2015 25 Research Question 3.) °Ò In order to measure land-cover heterogeneity you have 2 options: ®C Ether use the Moving Window in the Processing Toolbox, select variety and an appropriate window size ®C Afterwards extract the mean for each of your buffers using the polygon-overlay °Ò Or ®C Use the LecoS polygon-overlay tool to compute a °∞diversity-index°± like Shannon or Simpson index for each of your buffers
- 26. Workshop ®C Lund 2015 26 Research Question 3.)
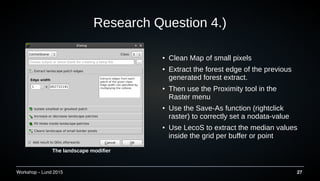
- 27. Workshop ®C Lund 2015 27 Research Question 4.) The landscape modifier °Ò Clean Map of small pixels °Ò Extract the forest edge of the previous generated forest extract. °Ò Then use the Proximity tool in the Raster menu °Ò Use the Save-As function (rightclick raster) to correctly set a nodata-value °Ò Use LecoS to extract the median values inside the grid per buffer or point
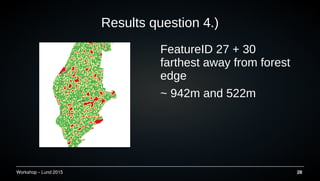
- 28. Workshop ®C Lund 2015 28 Results question 4.) FeatureID 27 + 30 farthest away from forest edge ~ 942m and 522m
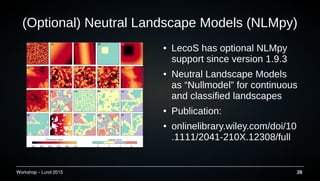
- 29. Workshop ®C Lund 2015 29 (Optional) Neutral Landscape Models (NLMpy) °Ò LecoS has optional NLMpy support since version 1.9.3 °Ò Neutral Landscape Models as °∞Nullmodel°± for continuous and classified landscapes °Ò Publication: °Ò onlinelibrary.wiley.com/doi/10 .1111/2041-210X.12308/full
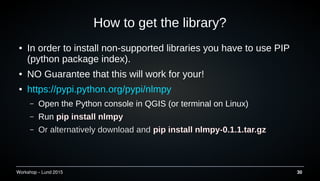
- 30. Workshop ®C Lund 2015 30 How to get the library? °Ò In order to install non-supported libraries you have to use PIP (python package index). °Ò NO Guarantee that this will work for your! °Ò https://pypi.python.org/pypi/nlmpy ®C Open the Python console in QGIS (or terminal on Linux) ®C Run pip install nlmpy ®C Or alternatively download and pip install nlmpy-0.1.1.tar.gz
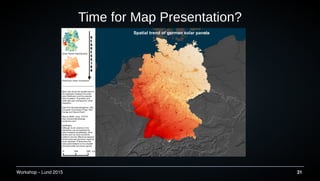
- 31. Workshop ®C Lund 2015 31 Time for Map Presentation?
- 32. Workshop ®C Lund 2015 32 Running scripts in the Processing Toolbox °Ò The Processing toolbox (formerly called Sextante) in QGIS can be used to write models and script to do repeatable tasks °Ò Currently Python and R scripts are supported °Ò In order to create a R-script, make sure that it is enabled in the Processing options (menu)
- 33. Workshop ®C Lund 2015 33 Other useful stuff - Processing R commands Command Function ##[datagis]=group Sets the group to °∞datagis°± ##layer = vector or raster Specifies the input layer to use ##distance=number 100 Sets a number field with default 100 ##title=string France Get text input. Default is °∞France°± ##field=field layer Select a field from the vector layer °∞layer°± hist(layer[[field]]) R-command: Histogram for fields from layer ##showplots Has to be set in order to see plot outputs >t.test(layer[[field]]) Console output with a °∞>°± before command ##output=output vector File output as vector or raster
- 34. Workshop ®C Lund 2015 34 Example Script ##[Own Scripts]=group ##showplots ##layer=vector ##y=field layer ##x=field layer plot(as.numeric( layer[[y]] )~as.numeric( layer[[x]] ),pch=19,bty="l",ylab=paste( y ),xlab=paste( x ) ) fit = lm( layer[[y]]~layer[[x]] ) abline(fit,col="blue",lwd=2)
- 35. Workshop ®C Lund 2015 35 Additional examples, help and tutorials °Ò http://www.gistutor.com/ °Ò http://qgis.spatialthoughts.com/ °Ò Youtube °˙ search QGIS °Ò http://gis.stackexchange.com °Ò QGIS-user mailing list °˙ http://lists.osgeo.org/listinfo/qgis-user
- 36. Workshop ®C Lund 2015 36 Thanks for your attention! Open questions....!