


More Related Content
What's hot (20)
Similar to Math Statistics IA December 2010 (20)


More from david1dave (7)


Math Statistics IA December 2010
- 1. The Relationship between the Average Amount of Sleep a High school Teenager gets per School Night and the Total Average amount of Video Games played in one School Week Math Studies Internal Assessment David Batchelor Due: December 2010 International School Bangkok Teacher: Mr. DeMille Word Count:
- 2. What is the Relationship between the amount of time spent playing video games and your amount of sleep? Introduction In developed countries around the world, many issues arise from playing excessive video games from addiction to an increase in violent behavior commonly among younger children. Studies also show that playing too many video games can affect your sleeping patterns in a negative way. For example, if you play an excessive amount of video games before bed time, it becomes more difficult to fall asleep. However, I decided to undertake a similar yet different study to find out how much video games an average high schooler plays and how this affects how many hours of sleep he/she gets. There were no online articles for this study so I decided to find out for myself using the high school population at school. At the beginning of the experiment I figured that kids who played more video games received less sleep. Statement of Task The main intention of this investigation was to find out whether the amount of time spent playing video games has an effect on the amount of sleep an average high- schooler gets. To do this, I gathered data at lunch during school hours and asked 50 students how many hours of video games they spent playing on average in an entire school week and how many hours of sleep they get in an average school night. I asked a wide range of students from 9th to 12th grade to create an equal dispersion of data. Throughout the project, I asked a range of students who play a lot of video games, students who donât play a lot of video games and students who play a moderate amount of video games. Plan of Investigation I am going to make a scatter plot and make a line of best fit to see if there is a linear correlation between the data. Afterwards, I will use the Standard Deviation Calculations to find out the dispersion of the data. With this data, I will find the least squares regression line to find out the equation of the line. Next, I will find out the Pearsonâs Correlation Coefficient to find the strength of the correlation of my data. Finally, I will run a Chi Squared test to see if the data is independent or dependent of one another.
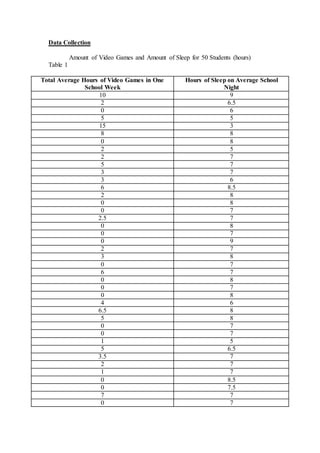
- 3. Data Collection Amount of Video Games and Amount of Sleep for 50 Students (hours) Table 1 Total Average Hours of Video Games in One School Week Hours of Sleep on Average School Night 10 9 2 6.5 0 6 5 5 15 3 8 8 0 8 2 5 2 7 5 7 3 7 3 6 6 8.5 2 8 0 8 0 7 2.5 7 0 8 0 7 0 9 2 7 3 8 0 7 6 7 0 8 0 7 0 8 4 6 6.5 8 5 8 0 7 0 7 1 5 5 6.5 3.5 7 2 7 1 7 0 8.5 0 7.5 7 7 0 7
- 4. 0 6 0 8.5 1 8 0 8.5 3 9 0 7 3 7 0 8 5 5 Table 1: Table 1 displays the number of hours spent playing video games in one week and the corresponding amount of sleep. Although the data looks quite scattered in the table, you can tell that people who played less video games received more sleep. However this was not the case for some students because they claimed to have a lot of homework and that resulted in less sleep.
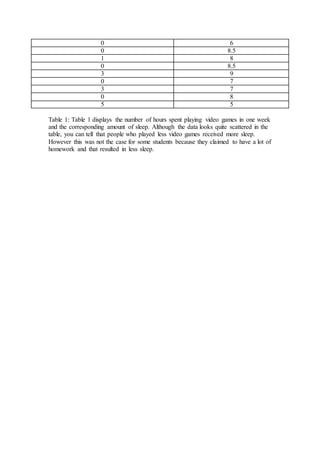
- 5. Figure 1 Figure 1: Figure 1 shows the relationship between the number of hours spent playing video games in total in an average school week and the amount of sleep the average high school teenager received in an average school night. (Graph by Excel) Standard Deviation The standard deviation is a formula which measures the dispersion of the data. In this investigation, I wanted to find the dispersal of the data found between the amount of time spent playing video games and the amount of sleep. Formulae: ððĨ = â â ðĨ2 ð â ðĨĖ 2 and ð ðĶ = â â ðĶ2 ð â ðĶĖ 2 0 1 2 3 4 5 6 7 8 9 10 0 2 4 6 8 10 12 14 16 HoursofSleeponanAverageSchoolNight Total Average Hours of Video Games in One School Week Amount of Time Spent Playing Video Games vs. Sleep
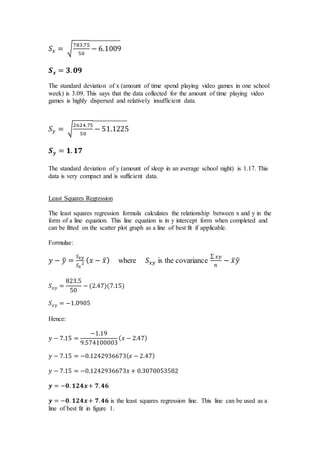
- 6. ððĨ = â 783.75 50 â 6.1009 ðš ð = ð. ðð The standard deviation of x (amount of time spend playing video games in one school week) is 3.09. This says that the data collected for the amount of time playing video games is highly dispersed and relatively insufficient data. ð ðĶ = â 2624.75 50 â 51.1225 ðš ð = ð. ðð The standard deviation of y (amount of sleep in an average school night) is 1.17. This data is very compact and is sufficient data. Least Squares Regression The least squares regression formula calculates the relationship between x and y in the form of a line equation. This line equation is in y intercept form when completed and can be fitted on the scatter plot graph as a line of best fit if applicable. Formulae: ðĶ â ðĶĖ = ð ðĨðĶ ð ðĨ 2 ( ðĨ â ðĨĖ ) where ððĨðĶ is the covariance â ðĨðĶ ð â ðĨĖ ðĶĖ ð ðĨðĶ = 823.5 50 â (2.47)(7.15) ð ðĨðĶ = â1.0905 Hence: ðĶ â 7.15 = â1.19 9.574100003 ( ðĨ â 2.47) ðĶ â 7.15 = â0.1242936673( ðĨ â 2.47) ðĶ â 7.15 = â0.1242936673ðĨ + 0.3070053582 ð = âð. ðððð+ ð. ðð ð = âð. ðððð+ ð. ðð is the least squares regression line. This line can be used as a line of best fit in figure 1.
- 7. Pearsonâs Correlation Coefficient This equation is useful when you want to find out how relative the data of your two variables are. ð = ððĨðĶ ððĨ ð ðĶ ð = â1.19 (3.09)(1.17) ð = â0.329 ð ð = ð. ððð
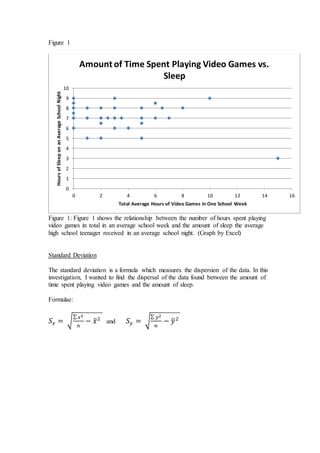
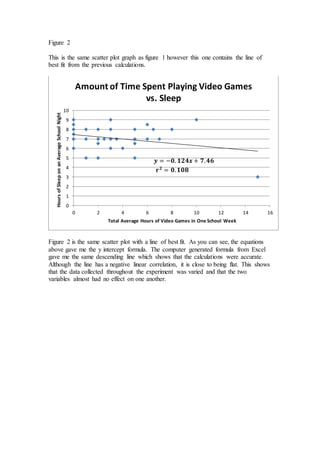
- 8. Figure 2 This is the same scatter plot graph as figure 1 however this one contains the line of best fit from the previous calculations. Figure 2 is the same scatter plot with a line of best fit. As you can see, the equations above gave me the y intercept formula. The computer generated formula from Excel gave me the same descending line which shows that the calculations were accurate. Although the line has a negative linear correlation, it is close to being flat. This shows that the data collected throughout the experiment was varied and that the two variables almost had no effect on one another. 0 1 2 3 4 5 6 7 8 9 10 0 2 4 6 8 10 12 14 16 HoursofSleeponanAverageSchoolNight Total Average Hours of Video Games in One School Week Amount of Time Spent Playing Video Games vs. Sleep ð = âð. ðððð + ð. ðð ðŦ ð = ð. ððð
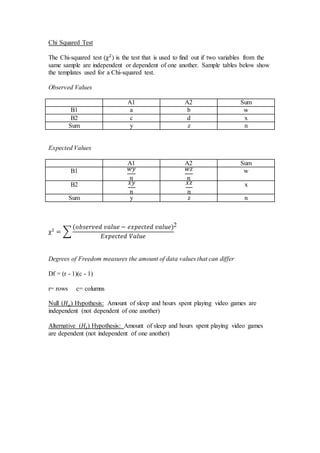
- 9. Chi Squared Test The Chi-squared test (Ï2 ) is the test that is used to find out if two variables from the same sample are independent or dependent of one another. Sample tables below show the templates used for a Chi-squared test. Observed Values A1 A2 Sum B1 a b w B2 c d x Sum y z n Expected Values A1 A2 Sum B1 ðĪðĶ ð ðĪð§ ð w B2 ðĨðĶ ð ðĨð§ ð x Sum y z n Ï2 = â (ððð ðððĢðð ðĢðððĒð â ððĨððððĄðð ðĢðððĒð) ðļðĨððððĄðð ððððĒð Degrees of Freedom measures the amount of data values that can differ Df = (r - 1)(c - 1) r= rows c= columns Null (ðŧ ð) Hypothesis: Amount of sleep and hours spent playing video games are independent (not dependent of one another) Alternative (ðŧðž) Hypothesis: Amount of sleep and hours spent playing video games are dependent (not independent of one another) 2
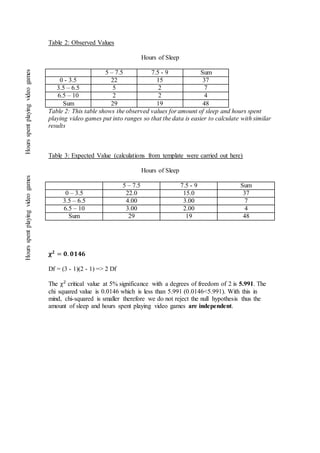
- 10. Table 2: Observed Values Hours of Sleep 5 â 7.5 7.5 - 9 Sum 0 - 3.5 22 15 37 3.5 â 6.5 5 2 7 6.5 â 10 2 2 4 Sum 29 19 48 Table 2: This table shows the observed values for amount of sleep and hours spent playing video games put into ranges so that the data is easier to calculate with similar results Table 3: Expected Value (calculations from template were carried out here) Hours of Sleep 5 â 7.5 7.5 - 9 Sum 0 â 3.5 22.0 15.0 37 3.5 â 6.5 4.00 3.00 7 6.5 â 10 3.00 2.00 4 Sum 29 19 48 ð ð = ð. ðððð Df = (3 - 1)(2 - 1) => 2 Df The Ï2 critical value at 5% significance with a degrees of freedom of 2 is 5.991. The chi squared value is 0.0146 which is less than 5.991 (0.0146<5.991). With this in mind, chi-squared is smaller therefore we do not reject the null hypothesis thus the amount of sleep and hours spent playing video games are independent. HoursspentplayingvideogamesHoursspentplayingvideogames
- 11. Data Understanding To start off, the graph in figure 1 shows a scatter plot graph with all the data from the 50 students. In figure 2, the same graph was displayed but this time with a line of best fit. The line of best fit was found with the least squares regression formula. The equation found within my own calculations was the same as the computer generated formula from Excel. The line demonstrated a negative linear correlation that was almost flat. This demonstrates weak trends and almost neutral data. Furthermore, the standard deviation test showed that the variables were quite dispersed with ð ðĨ = 3.09 and ð ðĶ= 1.17. Limitations There were a few limitations in my investigation. First, I surveyed 50 students from an overall population of about 500. Although I attempted to survey students from every grade level and gender, the data would have been far more accurate if all 500 students were surveyed. I also tried to survey people who I knew played a lot of video games and those who played very little if not at all and see if there were any relations between the amount of sleep that each got. Another limitation is that about half of the students that I surveyed stated that they hadnât played video games in weeks due to the homework load. Although some students didnât play video games at all, they still got little sleep due to homework etcâĶ Some of the students who I interviewed played an average of 6 and a half hours of video games a week and still managed to get 8 hours of sleep a night which is more that many students get without playing video games. Conclusion Although there were many limitations that made my data less accurate than was expected, I believe that I received a concrete answer from my studies. According to my theory, as the x axis increases (amount of video games), the y axis should decrease (amount of sleep). My line of best fit does technically fits this theory however the strength of the line is weak. If I had asked a completely separate group of 50 students, there could be a great chance that my line went level with no relation or even up (although highly doubtful). However I believe that if the entire 500 student population in the high school were surveyed, that the relationship of the data could have strengthened. In other words, the line of best fit would have turned into a more negative slope. In conclusion, the more video games the high school population plays, the less sleep they get on an average school night.