


![? Numa (デフォルト1)
? /proc/[ndbmtdのPID]/numa_maps を見る限り numactl --
interleave=all で起動してくれる
? NUMA環境ならSwap Insanity対策のためにも
? ODirect(デフォルト0)
? innodb_flush_method=O_DIRECTと同様ダイレクトIOを使用](https://image.slidesharecdn.com/mcct2-pub-140704024721-phpapp02/85/MySQL-Cluster-10-12-320.jpg)


![? ndb-cluster-connection-pool(デフォルト1)
? SQLノードがデータノード1つ辺りに接続する数
? 増やすと接続数が増えるので負荷状況次第で性能が向上
? 但し増やすとSQLノードとしてのNodeIdが消費されるため、
config.iniに書く[MYSQLD]の数を増やす必要がある
? query_cache_type, query_cache_size
? MySQL Cluster環境では無効にする](https://image.slidesharecdn.com/mcct2-pub-140704024721-phpapp02/85/MySQL-Cluster-10-18-320.jpg)

![障害1
? SQLノードのエラーログに以下内容が出力
? [ERROR] /usr/local/mysql/bin/mysqld: Got temporary error 245 'Too many
active scans' from NDBCLUSTER
? 対応
? そもそも受けきれないのならフロントのWeb(Apache)のMaxClientsを下
げる(一時しのぎ)。
? TransactionDeadlockDetectionTimeoutをリトライ処理しっかりしてるな
ら小さくする
? クエリの見直し](https://image.slidesharecdn.com/mcct2-pub-140704024721-phpapp02/85/MySQL-Cluster-10-20-320.jpg)


![[C21] MySQL Cluster徹底活用術 by Mikiya Okuno](https://cdn.slidesharecdn.com/ss_thumbnails/c21mysql-cluster-techniques-rev3-131206023325-phpapp02-thumbnail.jpg?width=560&fit=bounds)


More Related Content
What's hot (19)
Viewers also liked (13)


Similar to MySQL Clusterを運用して10ヶ月間 (20)


Recently uploaded (13)


![ElasticsearchでSPLADEする [Search Engineering Tech Talk 2025 Winter]](https://cdn.slidesharecdn.com/ss_thumbnails/searchtech-250228102455-ddc5ce09-thumbnail.jpg?width=560&fit=bounds)


MySQL Clusterを運用して10ヶ月間
- 1. MySQL Clusterを 運用して10ヶ月間 MySQL Cluster Casual Talks #2 2014/06/25
- 2. 誰 ? いとう ひろゆき ? サーバ運用/保守が仕事 ? ネットワークからOS、ミドルウェアまでアプリケーシ ョン以外はなんでも面倒を見ないといけない(程度の差 はあります) ? MySQL好き。酒好き。
- 3. お題 ? サーバ构成 ? パラメータ検讨 ? サービスインから発生した障害と対応 ? 监视について ? その他 ? 终わりに
- 4. サーバ构成
- 6. パラメータ検讨
- 8. とりあえず情报収集
- 10. ? MaxNoOfExecutionThreads (デフォルト2) ? ndbmtdのみのパラメータ ? 主要な動作スレッドの動作スレッド数が決まる ? LDM, TC, Send, Receive Threads ? 設定数によってスレッド数は自動設定される ? 最大で物理CPUコア数と同じにする(目安) ? 7.3系では最大36まで指定可能
- 11. ? ThreadConfig ? MaxNoOfExecutionThreadsより詳細に動作スレッドを指定可能 ? 設定例 ? ThreadConfig=main={cpubind=1},ldm={count=4,cpubind=2,3,8, 9},recv={cpubind=5},rep={cpubind=7},io={cpubind=4} ? 各スレッドがどのCPUコアで動作するか固定される(taskset的な)
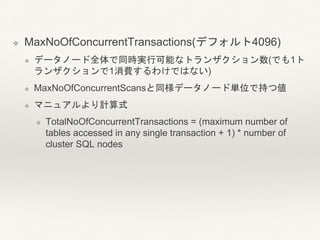
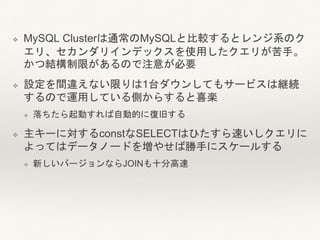
- 12. ? Numa (デフォルト1) ? /proc/[ndbmtdのPID]/numa_maps を見る限り numactl -- interleave=all で起動してくれる ? NUMA環境ならSwap Insanity対策のためにも ? ODirect(デフォルト0) ? innodb_flush_method=O_DIRECTと同様ダイレクトIOを使用
- 13. ? TransactionDeadlockDetectionTimeout(デフォルト1200) ? 設定値の単位はmsなので1.2秒がデフォルト ? tcがクエリ実行を待てる時間。innodb_lock_wait_timeoutに近い 感じ。大きすぎるとデッドロック待ちでクエリが滞留してしまう 事がある。大きすぎる設定値はMaxNoOfConcurrentScansの上限 に引っかかる原因になったりする。
- 14. ? MaxNoOfConcurrentScans(デフォルト256, 最大500) ? スキャンクエリの最大並列実行数(テーブルスキャン、インデッ クススキャンで利用される) ? データノード単位で持つのでデータノードの数が2個なら最大並 列実行数は1000になる ? InnoDBには無い制限なので瞬間的に大量のアクセスが来た場合 にSQLノードのエラーログにToo many active scansと出力され ていることがあります
- 15. ? MaxNoOfConcurrentTransactions(デフォルト4096) ? データノード全体で同時実行可能なトランザクション数(でも1ト ランザクションで1消費するわけではない) ? MaxNoOfConcurrentScansと同様データノード単位で持つ値 ? マニュアルより計算式 ? TotalNoOfConcurrentTransactions = (maximum number of tables accessed in any single transaction + 1) * number of cluster SQL nodes
- 16. ? NoOfFragmentLogFiles(デフォルト16) ? Redoログのファイル数。 ? FragmentLogFileSize(デフォルト16MB) ? Redoログ1つのファイルサイズ ? デフォルトの場合 NoOfFragmentLogFiles * 4 * FragmentLogFileSizeで1024MB ? The default parameter value is 16, which by default means 16 sets of 4 16MB files for a total of 1024MB)
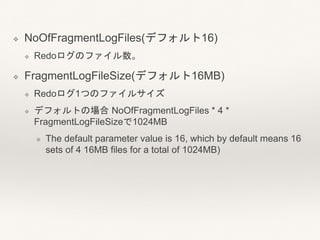
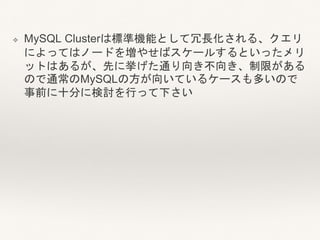
- 18. ? ndb-cluster-connection-pool(デフォルト1) ? SQLノードがデータノード1つ辺りに接続する数 ? 増やすと接続数が増えるので負荷状況次第で性能が向上 ? 但し増やすとSQLノードとしてのNodeIdが消費されるため、 config.iniに書く[MYSQLD]の数を増やす必要がある ? query_cache_type, query_cache_size ? MySQL Cluster環境では無効にする
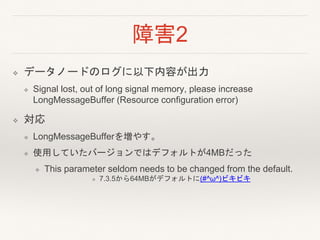
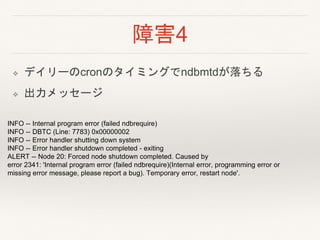
- 20. 障害1 ? SQLノードのエラーログに以下内容が出力 ? [ERROR] /usr/local/mysql/bin/mysqld: Got temporary error 245 'Too many active scans' from NDBCLUSTER ? 対応 ? そもそも受けきれないのならフロントのWeb(Apache)のMaxClientsを下 げる(一時しのぎ)。 ? TransactionDeadlockDetectionTimeoutをリトライ処理しっかりしてるな ら小さくする ? クエリの見直し
- 21. 障害2 ? データノードのログに以下内容が出力 ? Signal lost, out of long signal memory, please increase LongMessageBuffer (Resource configuration error) ? 対応 ? LongMessageBufferを増やす。 ? 使用していたバージョンではデフォルトが4MBだった ? This parameter seldom needs to be changed from the default. ? 7.3.5から64MBがデフォルトに(#^ω^)ビキビキ
- 22. 障害3? ? 仮想環境のndbd 3 x 2ノードグループをndbmtdの3 x 1ノ ードグループへ変更する際に発生。 ? 良くない事に時間がなく、ノードグループ数が変わる場 合にstart backupで取れるバックアップデータを使用出 来るか検証出来なかった。そのためmysqldumpしてリス トアを試みました
- 23. 障害3? ? 結果、見事にリストア時にエラーが発生 ? 出力メッセージ ? Got temporary error 410 'REDO log files overloaded (decrease TimeBetweenLocalCheckpoints or increase NoOfFragmentLogFiles)' from NDBCLUSTER ? マニュアル見る(http://dev.mysql.com/doc/refman/5.6/en/mysql- cluster-ndbd- definition.html#ndbparam-ndbd- timebetweenlocalcheckpoints)
- 24. 障害3? ? マニュアルより ? All the write operations in the cluster are added together. Setting TimeBetweenLocalCheckpoints to 6 or less means that local checkpoints will be executed continuously without pause, independent of the cluster's workload. ? TimeBetweenLocalCheckpointsを6以下にしてリストア して成功 ? しかしndbmtdの再起動が発生したため大きく時間ロス。
- 25. 障害4 ? デイリーのcronのタイミングでndbmtdが落ちる ? 出力メッセージ INFO -- Internal program error (failed ndbrequire) INFO -- DBTC (Line: 7783) 0x00000002 INFO -- Error handler shutting down system INFO -- Error handler shutdown completed - exiting ALERT -- Node 20: Forced node shutdown completed. Caused by error 2341: 'Internal program error (failed ndbrequire)(Internal error, programming error or missing error message, please report a bug). Temporary error, restart node'.
- 26. 障害4 ? 環境依存せず複数環境で発生 ? 最悪のケースで全部のデータノードが停止(1回だけ) ? 気付いたらスワップ使っていた ? I/O負荷の高いであろうcron(updatedb実行)を停止 ? スワップとの兼ね合いでTimeBetweenWatchDogCheckに引っか かって停止したと考えられたため ? ついでにvm.swappiness = 0 に設定
- 27. 监视について
- 28. データノード ? CPUコア毎の使用率を監視 ? ロードアベレージ監視やCPU使用率監視(全体)はあまり役に立た ない ? 負荷の高い状態でもロードアベレージがほとんど上がらない(せ いぜいldmスレッド数+1,2ぐらい)
- 29. データノード ? ネットワークトラフィックを監視 ? データノードの特徴として負荷が無い状態でもネットワークトラ フィックが発生する ? 極端にトラフィックが発生しなくなったら何かしら異常が発生し ているためアラートとする ? 負荷が無い状態でも100Kbps前後は常時トラフィックが発生 ? 現在サービス中のデータノードでは負荷が最も低い時間でも 10Mbps前後で推移
- 30. データノード ? DataMemory, IndexMemoryの使用率監視 ? 管理ノード(ndb_mgmd)で定期的にチェック ndb_mgm> all report memoryusage; Connected to Management Server at: localhost:1186 Node 1: Data usage is 30%(177824 32K pages of total 589824) Node 1: Index usage is 11%(44203 8K pages of total 393344) Node 2: Data usage is 30%(177824 32K pages of total 589824) Node 2: Index usage is 11%(44203 8K pages of total 393344) Node 3: Data usage is 30%(177894 32K pages of total 589824) Node 3: Index usage is 11%(44313 8K pages of total 393344) Node 4: Data usage is 30%(177894 32K pages of total 589824) Node 4: Index usage is 11%(44313 8K pages of total 393344) ndb_mgm>
- 31. SQLノード ? 通常のMySQLと同様、接続監視は必須 ? 但しengine=ndbなテーブルに対する参照や更新処理が行えるか 設定するべき ? DBのデータがデータノードにあるMySQL ClusterだがSQLノードも 割とリソース消費するので一般的な監視は行い、台数を増やすタイ ミングに気を配る
- 32. その他
- 33. OS周り ? パケットドロップやエラーは発生しにくいように設定 ? NICのリングバッファは最大に(RXは必須) ? RSS対応NICを使用する ? データノードでスワップ発生は致命的 ? vm.swappiness=0に設定しつつメモリに余裕があるか安定するま では気を配る
- 34. 使用バージョン ? MySQL Clusterに関してはリリースされている最新バー ジョンを使用する ? 7.2系と7.3系でJOINの性能がクエリによって本当に30倍ぐらい差 が出るため ? 7.2系だと30秒前後かかるが7.3系だと1秒もかからないクエリ に実際に遭遇
- 35. 终わりに
- 36. ? MySQL Clusterは通常のMySQLと比較するとレンジ系のク エリ、セカンダリインデックスを使用したクエリが苦手。 かつ結構制限があるので注意が必要 ? 設定を間違えない限りは1台ダウンしてもサービスは継続 するので運用している側からすると喜楽 ? 落ちたら起動すれば自動的に復旧する ? 主キーに対するconstなSELECTはひたすら速いしクエリに よってはデータノードを増やせば勝手にスケールする ? 新しいバージョンならJOINも十分高速