


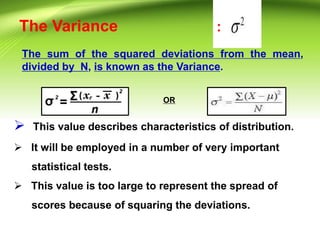
![A Deviation score
? A score expressed as its distance from the
Mean is called a deviation score.
x = ( X ? )
e.g. 6, 5, 4, 3, 2, 1 Mean ( ) = 21/6 = 3.50
[ e.g. 6 ¨C 3.50 = 2.5 is a deviation score of
6 ]
? Sum of deviations of each value from the
mean :
?2.5 + 1.5 + 0.5 + (- 0.5) + (- 1.5 ) + (- 2.5 ) = 0
) = 0 ˇĆ x = 0](https://image.slidesharecdn.com/measureofvariabilitywindri-240223113333-6faace5e/85/measure-of-variability-windri-In-research-include-example-16-320.jpg)

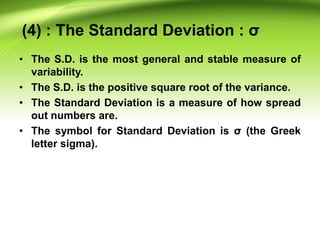
![The Standard Deviation : Formulas
? The Population Standard Deviation:
?
? The Sample Standard Deviation:
? The important change is "N-1" instead of
"N" (which is called "Bessel's correctionˇ±-
Friedrich Bessel ).
? [ The factor n/(n ? 1) is itself called Bessel's correction.]](https://image.slidesharecdn.com/measureofvariabilitywindri-240223113333-6faace5e/85/measure-of-variability-windri-In-research-include-example-24-320.jpg)


More Related Content
Similar to measure of variability (windri). In research include example (20)
Recently uploaded (20)


measure of variability (windri). In research include example
- 1. Measures of Variability Windri Dewi Ayu
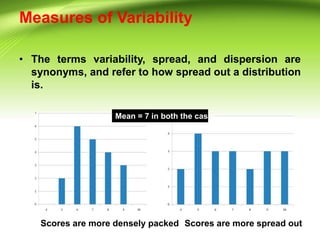
- 2. Measures of Variability ? The terms variability, spread, and dispersion are synonyms, and refer to how spread out a distribution is. Mean = 7 in both the cases Scores are more densely packed Scores are more spread out
- 3. Measures of Variability ? How far the scores have shown spread out from the mean? ? Dispersion within a dataset can be measured or described in several ways by using Measures of Variability. ? It will make the distribution and interpretation more meaningful. ? It shows the specific nature of distribution of data.
- 4. Measures of Variability There are four major ˇ°Measures of Variabilityˇ±: 1) The Range 2) The Quartile Deviation 3) The Mean or Average Deviation 4) The Standard Deviation
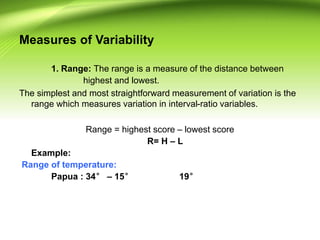
- 5. Measures of Variability 1. Range: The range is a measure of the distance between highest and lowest. The simplest and most straightforward measurement of variation is the range which measures variation in interval-ratio variables. Range = highest score ¨C lowest score R= H ¨C L Example: Range of temperature: Papua : 34ˇă ¨C 15ˇă 19ˇă
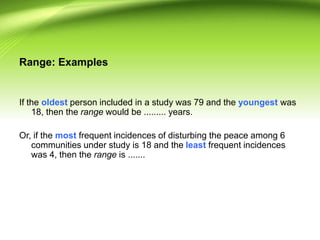
- 6. Range: Examples If the oldest person included in a study was 79 and the youngest was 18, then the range would be ......... years. Or, if the most frequent incidences of disturbing the peace among 6 communities under study is 18 and the least frequent incidences was 4, then the range is .......
- 7. Limitations ? It is very sensitive to the smallest and largest data values. ? It is not a stable statistics as its value can differ from sample to sample drawn from the same population. ? In order to reduce the problems caused by outliers in a dataset, the inter-quartile range is often calculated instead of the range.
- 8. Quartiles The extensions of the Median concept because they are values which divide a set of data into equal parts. ? Median : Divides the distribution into two equal parts. ? Quartile : Divides the distribution into four equal parts. ? Decile : Divides the distribution into ten equal parts. ? Percentile : Divides the distribution into one hundred equal parts.
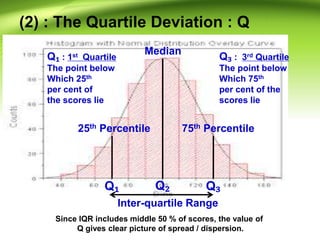
- 9. (2) : The Quartile Deviation : Q Q? Q? Q? Inter-quartile Range Median 25th Percentile 75th Percentile Since IQR includes middle 50 % of scores, the value of Q gives clear picture of spread / dispersion. Q? : 1st Quartile The point below Which 25th per cent of the scores lie Q? : 3rd Quartile The point below Which 75th per cent of the scores lie
- 10. The Quartile Deviation : Q ? When the extreme scores in the given distribution are very high and very low, the range will be very high. ? The inter-quartile range provides a clearer picture of the overall dataset by removing/ignoring the outlying values. ? The Quartile deviation is one-half the scale distance between the 75th and 25th percentiles in a frequency distribution. (i.e. Semi-interquartile Range)
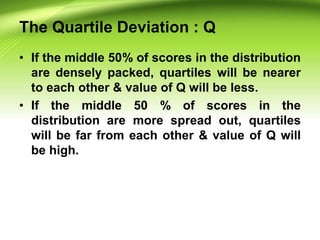
- 11. The Quartile Deviation : Q ? If the middle 50% of scores in the distribution are densely packed, quartiles will be nearer to each other & value of Q will be less. ? If the middle 50 % of scores in the distribution are more spread out, quartiles will be far from each other & value of Q will be high.
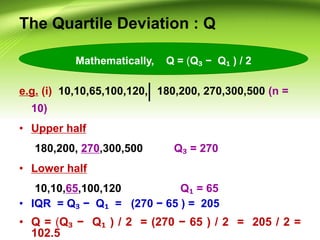
- 12. The Quartile Deviation : Q e.g. (i) 10,10,65,100,120, 180,200, 270,300,500 (n = 10) ? Upper half 180,200, 270,300,500 Q? = 270 ? Lower half 10,10,65,100,120 Q? = 65 ? IQR = Q? ? Q? = (270 ? 65 ) = 205 ? Q = (Q? ? Q? ) / 2 = (270 ? 65 ) / 2 = 205 / 2 = 102.5 Mathematically, Q = (Q? ? Q? ) / 2
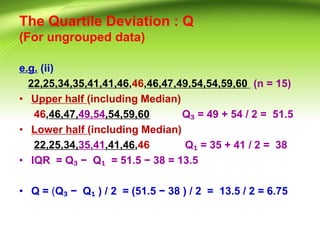
- 13. The Quartile Deviation : Q (For ungrouped data) e.g. (ii) 22,25,34,35,41,41,46,46,46,47,49,54,54,59,60 (n = 15) ? Upper half (including Median) 46,46,47,49,54,54,59,60 Q? = 49 + 54 / 2 = 51.5 ? Lower half (including Median) 22,25,34,35,41,41,46,46 Q? = 35 + 41 / 2 = 38 ? IQR = Q? ? Q? = 51.5 ? 38 = 13.5 ? Q = (Q? ? Q? ) / 2 = (51.5 ? 38 ) / 2 = 13.5 / 2 = 6.75
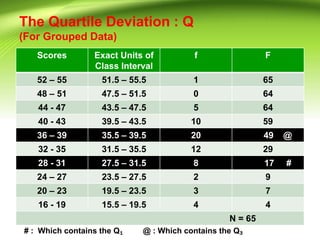
- 14. The Quartile Deviation : Q (For Grouped Data) Scores Exact Units of Class Interval f F 52 ¨C 55 51.5 ¨C 55.5 1 65 48 ¨C 51 47.5 ¨C 51.5 0 64 44 - 47 43.5 ¨C 47.5 5 64 40 - 43 39.5 ¨C 43.5 10 59 36 ¨C 39 35.5 ¨C 39.5 20 49 @ 32 - 35 31.5 ¨C 35.5 12 29 28 - 31 27.5 ¨C 31.5 8 17 # 24 ¨C 27 23.5 ¨C 27.5 2 9 20 ¨C 23 19.5 ¨C 23.5 3 7 16 - 19 15.5 ¨C 19.5 4 4 N = 65 # : Which contains the Q? @ : Which contains the Q?
- 15. Selection and Application of the Q The Quartile Deviation is used when; ? only the median is given as the measure of central tendency; ? there are scattered or extreme scores which would influence the S.D. excessively; ? the concentration around the Median, the middle 50 % scores , is of primary interest.
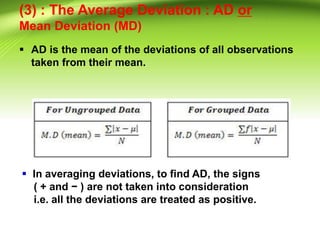
- 16. A Deviation score ? A score expressed as its distance from the Mean is called a deviation score. x = ( X ? ) e.g. 6, 5, 4, 3, 2, 1 Mean ( ) = 21/6 = 3.50 [ e.g. 6 ¨C 3.50 = 2.5 is a deviation score of 6 ] ? Sum of deviations of each value from the mean : ?2.5 + 1.5 + 0.5 + (- 0.5) + (- 1.5 ) + (- 2.5 ) = 0 ) = 0 ˇĆ x = 0
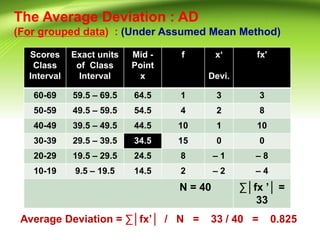
- 17. (3) : The Average Deviation : AD or Mean Deviation (MD) ? AD is the mean of the deviations of all observations taken from their mean. ? In averaging deviations, to find AD, the signs ( + and ? ) are not taken into consideration i.e. all the deviations are treated as positive.
- 18. The Average Deviation : AD (For ungrouped data) X : Marks obtained x Deviatio n ©¦ x ©¦ 18 ? 5 5 19 ? 4 4 21 ? 2 2 19 ? 4 4 27 + 4 4 31 + 8 8 22 ? 1 1 25 + 2 2 28 + 5 5 20 ? 3 3 ˇĆ X = ˇĆ x = 0 ˇĆ ©¦x©¦ = 23 Mean = ˇĆ X / N = 230 / 10 = 23 Average Deviation = ˇĆ ©¦x©¦ / N = 23 / 10 = 2.3
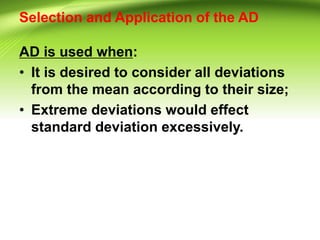
- 19. The Average Deviation : AD (For grouped data) : (Under Assumed Mean Method) Scores Class Interval Exact units of Class Interval Mid - Point x f xˇ® Devi. fx' 60-69 59.5 ¨C 69.5 64.5 1 3 3 50-59 49.5 ¨C 59.5 54.5 4 2 8 40-49 39.5 ¨C 49.5 44.5 10 1 10 30-39 29.5 ¨C 39.5 34.5 15 0 0 20-29 19.5 ¨C 29.5 24.5 8 ¨C 1 ¨C 8 10-19 9.5 ¨C 19.5 14.5 2 ¨C 2 ¨C 4 N = 40 ˇĆ©¦fx ˇŻ©¦ = 33 Average Deviation = ˇĆ©¦fxˇŻ©¦ / N = 33 / 40 = 0.825
- 20. Selection and Application of the AD AD is used when: ? It is desired to consider all deviations from the mean according to their size; ? Extreme deviations would effect standard deviation excessively.
- 21. Limitations : A.D. ? It is based on all deviations, therefore it may be increased because of one or more extreme deviation/s. ? All the deviations are treated as positive. ? Needs long mathematical calculations. Hence, it is rarely used.
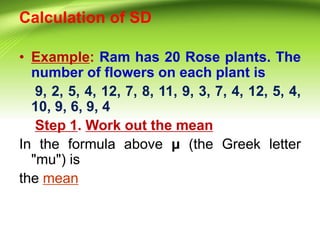
- 22. The Variance The sum of the squared deviations from the mean, divided by N, is known as the Variance. : OR ? This value describes characteristics of distribution. ? It will be employed in a number of very important statistical tests. ? This value is too large to represent the spread of scores because of squaring the deviations.
- 23. (4) : The Standard Deviation : ¦Ň ? The S.D. is the most general and stable measure of variability. ? The S.D. is the positive square root of the variance. ? The Standard Deviation is a measure of how spread out numbers are. ? The symbol for Standard Deviation is ¦Ň (the Greek letter sigma).
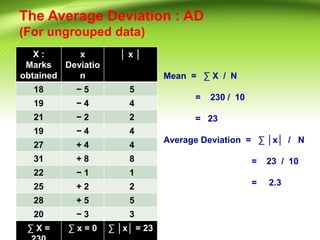
- 24. The Standard Deviation : Formulas ? The Population Standard Deviation: ? ? The Sample Standard Deviation: ? The important change is "N-1" instead of "N" (which is called "Bessel's correctionˇ±- Friedrich Bessel ). ? [ The factor n/(n ? 1) is itself called Bessel's correction.]
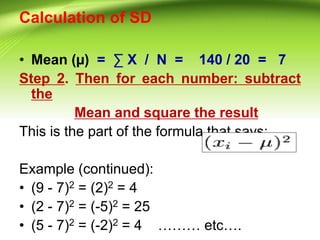
- 25. Calculation of SD ? Example: Ram has 20 Rose plants. The number of flowers on each plant is 9, 2, 5, 4, 12, 7, 8, 11, 9, 3, 7, 4, 12, 5, 4, 10, 9, 6, 9, 4 Step 1. Work out the mean In the formula above ¦Ě (the Greek letter "mu") is the mean
- 26. Calculation of SD ? Mean (?) = ˇĆ X / N = 140 / 20 = 7 Step 2. Then for each number: subtract the Mean and square the result This is the part of the formula that says: Example (continued): ? (9 - 7)2 = (2)2 = 4 ? (2 - 7)2 = (-5)2 = 25 ? (5 - 7)2 = (-2)2 = 4 ˇˇˇ etcˇ.
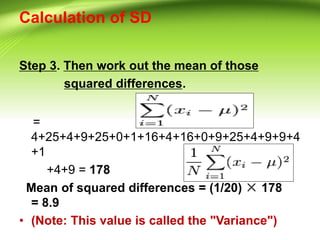
- 27. Calculation of SD Step 3. Then work out the mean of those squared differences. = 4+25+4+9+25+0+1+16+4+16+0+9+25+4+9+9+4 +1 +4+9 = 178 Mean of squared differences = (1/20) ˇÁ 178 = 8.9 ? (Note: This value is called the "Variance")
- 28. Calculation of SD Step 4. Take the square root of the Variance: ? Example (concluded): ¦Ň = ˇĚ(8.9) = 2.983... ? But, ... sometimes our data is only a sample of the whole population.
- 29. Calculation of SD (For the Sample) ? Example: Ram has 20 rose plants, but what if Ram only counted the flowers on 6 of them? ? The "population" is all 20 rose plants, and the "sample" is the 6 he counted. Let us say they are: 9, 2, 5, 4, 12, 7 = 6.5 s = ˇĚ(13.1) = 3.619...
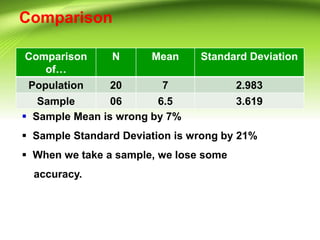
- 30. Comparison Comparison ofˇ N Mean Standard Deviation Population 20 7 2.983 Sample 06 6.5 3.619 ? Sample Mean is wrong by 7% ? Sample Standard Deviation is wrong by 21% ? When we take a sample, we lose some accuracy.
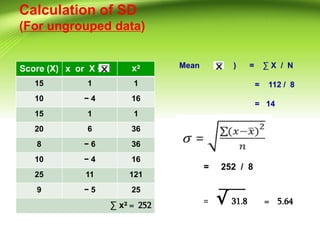
- 31. Calculation of SD (For ungrouped data) Score (X) x or X ? x? 15 1 1 10 ? 4 16 15 1 1 20 6 36 8 ? 6 36 10 ? 4 16 25 11 121 9 ? 5 25 ˇĆ x? = 252 Mean ( ) = ˇĆ X / N = 112 / 8 = 14 = 252 / 8 = ˇĚ 31.8 = 5.64
- 32. Thank You