
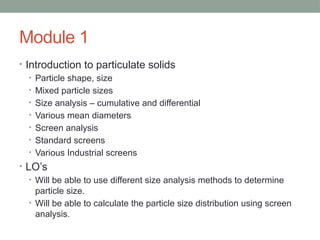

![Spherecity of cube
ŌĆó ╬© = As / Ap Where: As is the surface area of the equivalent
sphere and Ap is the measured surface area.
The sphericity can have a value ranging from 0-1, where ╬© = 1
for an ideal sphere.
ŌĆó The volume of a spherical particle is:
ŌĆó Vp= (1/6) ŽĆ dp
3
Where: dp is the diameter of the particle.
ŌĆó The surface area of a sphere is:
ŌĆó As = ŽĆ dp
2
= ŽĆ [ (6 Vp / ŽĆ)(1/3)
]2
Thus, for a particle, ╬© can be
calculated by measuring its volume and surface area:
ŌĆó ╬© = As / Ap = ŽĆ (6 Vp / ŽĆ)(2/3)
/ Ap An example: A cube measuring
1 ├Ś 1 ├Ś 1 cm has a volume of 1 cm3
, and a surface area of 6 ├Ś
(1 ├Ś 1) = 6 cm2
. Its sphericity is:
ŌĆó ╬© = ŽĆ ├Ś (6 ├Ś 1 / ŽĆ)(2/3)
/ 6 = 0.806](https://image.slidesharecdn.com/momodule1-240812110231-353ce302/85/Mechanical-Operations-slides-for-chemical-engineers-6-320.jpg)


More Related Content
Similar to Mechanical Operations slides for chemical engineers (20)
More from AABIDSHAIK3 (6)


Recently uploaded (20)


Mechanical Operations slides for chemical engineers
- 1. MECHANICAL OPERATIONS (CHE1022) Dr. Aabid Hussain Shaik Associate Professor Chemical Engineering Department, SCHEME Contact information: Room no. SMV 221 Email: aabidhussain.s@vit.ac.in
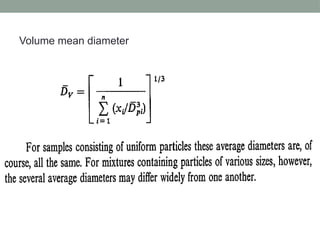
- 2. Module 1 ŌĆó Introduction to particulate solids ŌĆó Particle shape, size ŌĆó Mixed particle sizes ŌĆó Size analysis ŌĆō cumulative and differential ŌĆó Various mean diameters ŌĆó Screen analysis ŌĆó Standard screens ŌĆó Various Industrial screens ŌĆó LOŌĆÖs ŌĆó Will be able to use different size analysis methods to determine particle size. ŌĆó Will be able to calculate the particle size distribution using screen analysis.
- 3. Particulate ŌĆō Assembly of small particles They are characterized by *Size *Shape *Density Regular ŌĆōspecified by size, shape Irregular-arbitrarily defined
- 4. ŌĆó Equivalent diameter (irregular shaped particles)
- 5. ŌĆó Volume: V Sp ŌĆó Sphericity (╬”s) Ø£ÖØæĀ= 6Øæē ØæØ ØÉĘØæØ ØæåØæØ where Vp is the volume of the particle, Ap is its surface area, and Dp is the diameter of a sphere with the same volume Answer: 0.806
- 6. Spherecity of cube ŌĆó ╬© = As / Ap Where: As is the surface area of the equivalent sphere and Ap is the measured surface area. The sphericity can have a value ranging from 0-1, where ╬© = 1 for an ideal sphere. ŌĆó The volume of a spherical particle is: ŌĆó Vp= (1/6) ŽĆ dp 3 Where: dp is the diameter of the particle. ŌĆó The surface area of a sphere is: ŌĆó As = ŽĆ dp 2 = ŽĆ [ (6 Vp / ŽĆ)(1/3) ]2 Thus, for a particle, ╬© can be calculated by measuring its volume and surface area: ŌĆó ╬© = As / Ap = ŽĆ (6 Vp / ŽĆ)(2/3) / Ap An example: A cube measuring 1 ├Ś 1 ├Ś 1 cm has a volume of 1 cm3 , and a surface area of 6 ├Ś (1 ├Ś 1) = 6 cm2 . Its sphericity is: ŌĆó ╬© = ŽĆ ├Ś (6 ├Ś 1 / ŽĆ)(2/3) / 6 = 0.806
- 7. Calculate the sphericity of a cylinder of dia 1 cm and height 3 cm. ŌĆó Spherecity = surface area of the sphere of same volume as the particle/surface area of the particle ŌĆó Volume of particle = ŌłÅrc 2 h = p x 0.52 x 3 = 2.356 cm3 ŌĆó Radius of sphere of volume 2.356 cm3 : ŌĆó 4 ŌłÅ rs 3 / 3 = 2.356 ŌĆó rs = 0.8255 cm ŌĆó Surface area of sphere of same volume as the particle = 4 ŌłÅ rs 2 = 4 x p x 0.82552 = 8.563 cm2 ŌĆó Surface area of particle = 2 ŌłÅ rc (h + rc) = 2 x p x 0.5 x (3 + 0.5) = 10.996 cm2 ŌĆó Sphericity (f s) = 8.563/10.996 = 0.779
- 8. Calculate shperecity of a cylinder having diameter 1 cm and height 5 cm
- 9. Particle size- specified by diameter. Size expressed in different units according to size range *coarse ŌĆō inch (or) mm *Fine - screen size (mesh) *Very fine - ┬Ąm (or) nm *Ultra fine ŌĆō m2 /gm (specific surface area)
- 10. Mixture of particles (same size) No. of particles in the sample Total surface area
- 11. Specific surface of mixture(different size) +ŌĆ”+ xi is the mass fraction
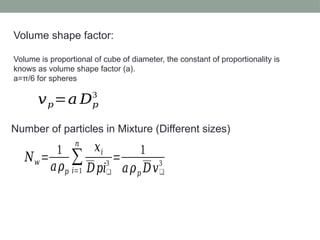
- 12. Number of particles in Mixture (Different sizes) ØæüØæż = 1 ØæÄØ£īØæØ Ōłæ Øæ¢=1 Øæø ØæźØæ¢ ØÉĘØæØØæ¢ŌØæ 3 = 1 ØæÄØ£īØæØ ØÉĘØæŻŌØæ 3 ØæŻØæØ=ØæÄ ØÉĘØæØ 3 Volume shape factor: Volume is proportional of cube of diameter, the constant of proportionality is knows as volume shape factor (a). a=ŽĆ/6 for spheres
- 13. Average particle size Volume ŌĆō Surface mean diameter
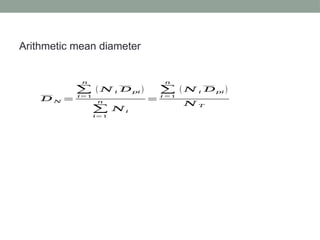
- 14. Arithmetic mean diameter ØÉĘ Øæü = Ōłæ Øæ¢=1 Øæø ( Øæü Øæ¢ ØÉĘØæØØæ¢ ) Ōłæ Øæ¢=1 Øæø ØæüØæ¢ = Ōłæ Øæ¢ =1 Øæø ( Øæü Øæ¢ ØÉĘØæØØæ¢ ) Øæü Øæć
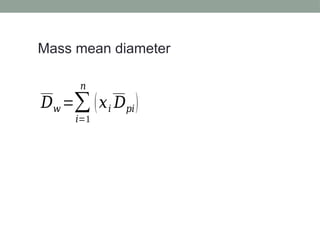
- 15. Mass mean diameter ØÉĘØæż =Ōłæ Øæ¢=1 Øæø (ØæźØæ¢ ØÉĘØæØØæ¢)
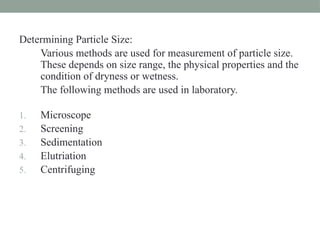
- 17. Determining Particle Size: Various methods are used for measurement of particle size. These depends on size range, the physical properties and the condition of dryness or wetness. The following methods are used in laboratory. 1. Microscope 2. Screening 3. Sedimentation 4. Elutriation 5. Centrifuging
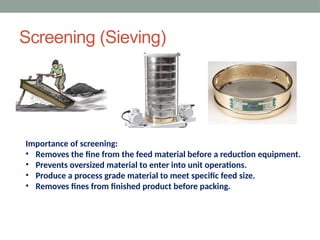
- 18. Screening (Sieving) Importance of screening: ŌĆó Removes the fine from the feed material before a reduction equipment. ŌĆó Prevents oversized material to enter into unit operations. ŌĆó Produce a process grade material to meet specific feed size. ŌĆó Removes fines from finished product before packing.
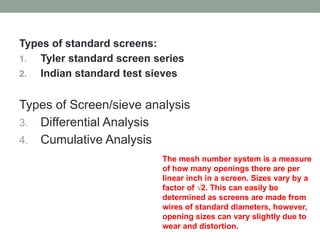
- 19. Types of standard screens: 1. Tyler standard screen series 2. Indian standard test sieves Types of Screen/sieve analysis 3. Differential Analysis 4. Cumulative Analysis The mesh number system is a measure of how many openings there are per linear inch in a screen. Sizes vary by a factor of ŌłÜ2. This can easily be determined as screens are made from wires of standard diameters, however, opening sizes can vary slightly due to wear and distortion.
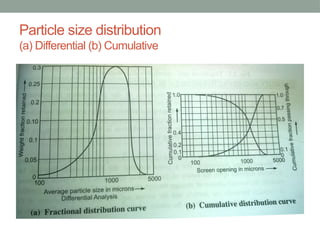
- 20. Particle size distribution (a) Differential (b) Cumulative
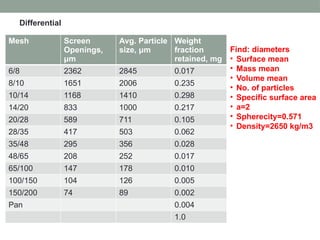
- 21. Mesh Screen Openings, ╬╝m Avg. Particle size, ╬╝m Weight fraction retained, mg 6/8 2362 2845 0.017 8/10 1651 2006 0.235 10/14 1168 1410 0.298 14/20 833 1000 0.217 20/28 589 711 0.105 28/35 417 503 0.062 35/48 295 356 0.028 48/65 208 252 0.017 65/100 147 178 0.010 100/150 104 126 0.005 150/200 74 89 0.002 Pan 0.004 1.0 Differential Find: diameters ŌĆó Surface mean ŌĆó Mass mean ŌĆó Volume mean ŌĆó No. of particles ŌĆó Specific surface area ŌĆó a=2 ŌĆó Spherecity=0.571 ŌĆó Density=2650 kg/m3
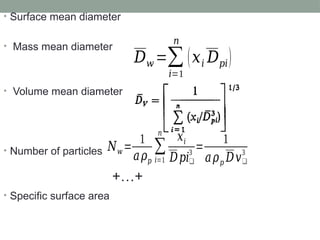
- 22. ŌĆó Surface mean diameter ŌĆó Mass mean diameter ŌĆó Volume mean diameter ŌĆó Number of particles ŌĆó Specific surface area ØÉĘØæż =Ōłæ Øæ¢=1 Øæø (ØæźØæ¢ ØÉĘØæØØæ¢) ØæüØæż = 1 ØæÄØ£īØæØ Ōłæ Øæ¢=1 Øæø ØæźØæ¢ ØÉĘØæØØæ¢ŌØæ 3 = 1 ØæÄØ£īØæØ ØÉĘØæŻŌØæ 3 +ŌĆ”+
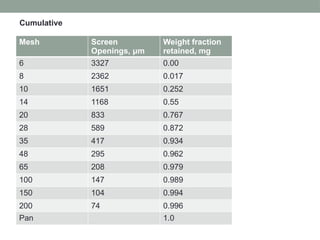
- 23. Mesh Screen Openings, ╬╝m Weight fraction retained, mg 6 3327 0.00 8 2362 0.017 10 1651 0.252 14 1168 0.55 20 833 0.767 28 589 0.872 35 417 0.934 48 295 0.962 65 208 0.979 100 147 0.989 150 104 0.994 200 74 0.996 Pan 1.0 Cumulative
- 24. Storage of solids 1. Bulk storage 2. Bin storage Bin - not so tall but usually wider Silo ŌĆō tall and relatively small in diameter Hopper - vessel with sloping at the bottom
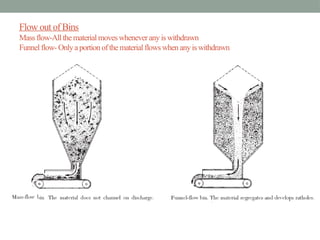
- 25. Flow out of Bins Massflow-All thematerialmoveswheneverany iswithdrawn Funnel flow- Onlyaportionofthematerial flowswhenanyiswithdrawn
- 26. Best flow depends on the following physical characteristics of materials. 1. Particle size 2. Moisture content 3. Temperature 4. Age 5. Oil content.
- 27. Problems ŌĆó A large welded steel silo 4 m in diameter and 20 m high is to be built. The silo has a central discharge on a flat bottom. Estimate the pressure on the wall, at the bottom of of the silo if the silo is filled with (a) coal particles and (b) water. The coal particles have the following characteristics: ŌĆó Density = 560 kg/m3 ŌĆó ├ś = 20 degrees ŌĆó Jannesen coefficient = 0.4
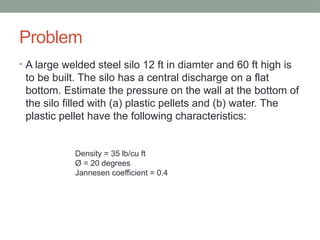
- 28. Problem ŌĆó A large welded steel silo 12 ft in diamter and 60 ft high is to be built. The silo has a central discharge on a flat bottom. Estimate the pressure on the wall at the bottom of the silo filled with (a) plastic pellets and (b) water. The plastic pellet have the following characteristics: Density = 35 lb/cu ft ├ś = 20 degrees Jannesen coefficient = 0.4