狠狠撸

狠狠撸Share a Scribd company logo
Microsoft Project Presentation
By Corey Johnson
10/11/00
What is a Gantt Chart?
? A Gantt Chart is a visual tool to help Plan,
Manage, and Track a project or projects.
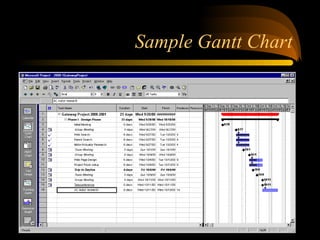
Sample Gantt Chart
Planning a Project
? Define Goals
? Develop Tasks
? Establish Timeframes
? Resource Availability?
? Organize
Managing and Tracking a
Project
? Track Progress
– Are the tasks being completed on time?
– Is one task holding up the whole project?
? Manage Finances
– Is the project going to stay within the budget?
Using MS Project
? Define the Project
? Build the Plan
– Set a start date
– Enter tasks/durations
– Assign resources
– Link tasks
– Fine tune the plan
Using MS Project (cont’d)
? Track and Manage
– Set a baseline
– Enter actuals
– Adjust plan
? Close Project
Defining the Project
? The objective of the project should be
defined by the person/group that is going to
manage the project.
? Tasks, start times, and deadlines should be
clearly established.
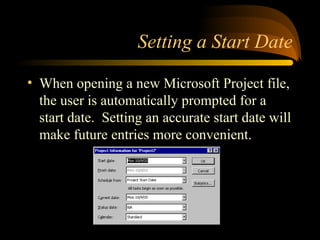
Setting a Start Date
? When opening a new Microsoft Project file,
the user is automatically prompted for a
start date. Setting an accurate start date will
make future entries more convenient.
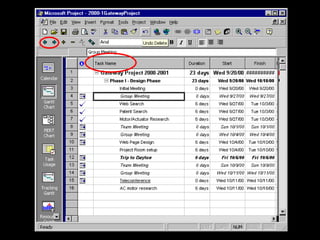
Entering Tasks and Durations
? Tasks are entered in the “Task Name”
column
? Subtasks are created by indenting a task.
? Durations may be entered in number of
working days or start and finish dates may
be used
Microsoft Project Presentation For Beginners
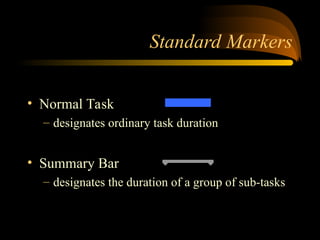
Standard Markers
? Normal Task
– designates ordinary task duration
? Summary Bar
– designates the duration of a group of sub-tasks
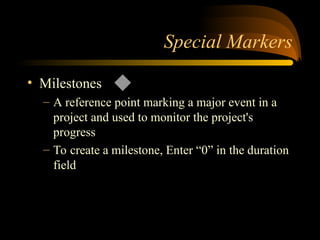
Special Markers
? Milestones
– A reference point marking a major event in a
project and used to monitor the project's
progress
– To create a milestone, Enter “0” in the duration
field
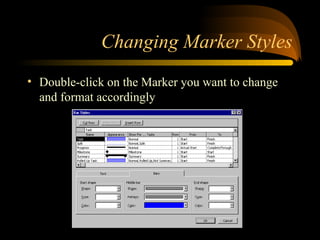
Changing Marker Styles
? Double-click on the Marker you want to change
and format accordingly
Assigning Resources
? A resource can be a single person, a piece
of equipment, or it can represent a group,
such as Plumbers
? Information on resources include
Availability, Costs, and Working Time
? Resources are very important in accurate
scheduling
Assigning Resources
? To Assign a Resource:
– Select the task to which you want to assign the
resource
– Click the Assign Resources button on the
toolbar
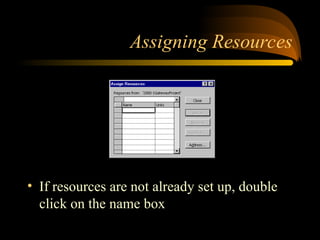
Assigning Resources
? If resources are not already set up, double
click on the name box
Assigning Resources
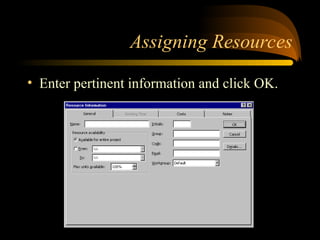
? Enter pertinent information and click OK.
Assigning Resources
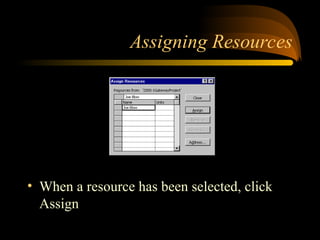
? When a resource has been selected, click
Assign
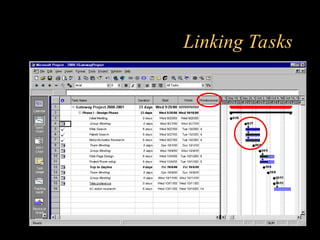
Linking Tasks
? Some tasks require that another task be
completed before it can begin. These tasks
must be linked.
? Tasks and subtasks are linked by assigning
Predecessors.
Linking Tasks
? Predecessor
– A task that must start or finish before another
task can start or finish
? Successor
– A task that cannot start or finish until another
task starts or finishes
– A task becomes a successor when a row
number is entered in the predecessor column
Linking Tasks
Fine Tune the Plan
? When all resources have been assigned and
appropriate tasks are linked, the original
Gantt chart will be complete
? Check to make sure tasks have been linked
correctly and task durations are correct
? The project is now ready to begin
Set a Baseline
? A baseline compares your original plan for
the project with the actual course of the
project.
? You can see which tasks started earlier or
later than planned, exceeded their original
budget, took longer than planned, and so
on.
Set a Baseline
? Create a baseline after you've polished it
and just before you actually start work on
the project
? To track costs, be sure to enter cost
information before you create the baseline
? Updates can easily be made to the baseline
if information is missing
Set a Baseline
? The Baseline plan includes:
– Tasks (start and finish dates, duration, work,
cost, splits, timephased work, and timephased
cost)
– Resources (work, cost, timephased work, and
timephased cost)
– Assignments (start and finish dates, work, cost,
timephased work, and timephased cost)
Set a Baseline
? To set a baseline:
– Point to Tracking on the Tools menu
– Click Save Baseline
Entering Progress
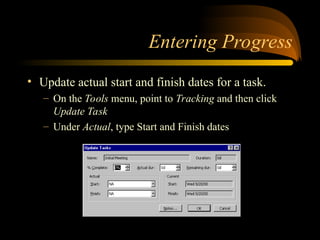
? Update actual start and finish dates for a task.
– On the Tools menu, point to Tracking and then click
Update Task
– Under Actual, type Start and Finish dates
Entering Progress
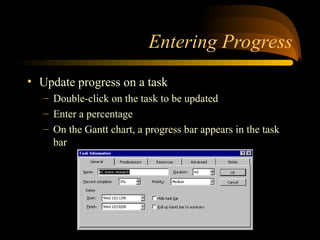
? Update progress on a task
– Double-click on the task to be updated
– Enter a percentage
– On the Gantt chart, a progress bar appears in the task
bar
Tracking Gantt Chart
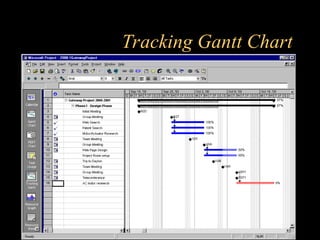
? Tracks the progress of the project
? Shows what tasks are overdue and what has
been completed on time
? Click on the Tracking Gantt icon to view
Tracking Gantt Chart
Tracking Progress
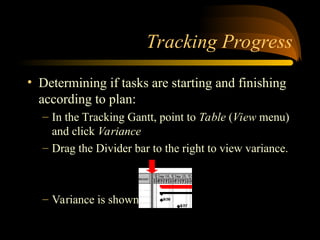
? Determining if tasks are starting and finishing
according to plan:
– In the Tracking Gantt, point to Table (View menu)
and click Variance
– Drag the Divider bar to the right to view variance.
– Variance is shown in Days
Tracking Progress
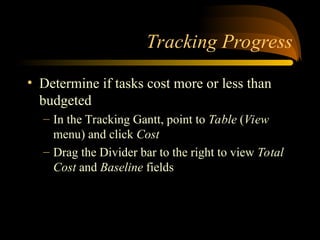
? Determine if tasks cost more or less than
budgeted
– In the Tracking Gantt, point to Table (View
menu) and click Cost
– Drag the Divider bar to the right to view Total
Cost and Baseline fields
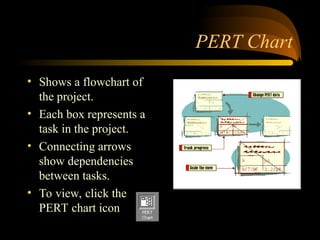
PERT Chart
? Shows a flowchart of
the project.
? Each box represents a
task in the project.
? Connecting arrows
show dependencies
between tasks.
? To view, click the
PERT chart icon
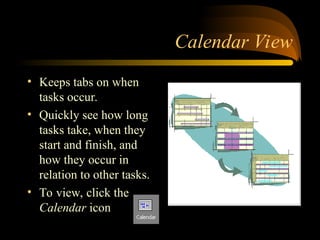
Calendar View
? Keeps tabs on when
tasks occur.
? Quickly see how long
tasks take, when they
start and finish, and
how they occur in
relation to other tasks.
? To view, click the
Calendar icon
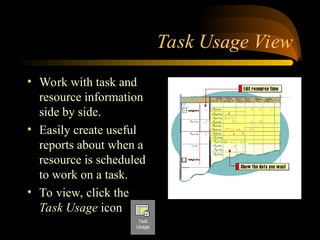
Task Usage View
? Work with task and
resource information
side by side.
? Easily create useful
reports about when a
resource is scheduled
to work on a task.
? To view, click the
Task Usage icon
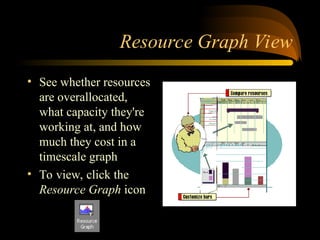
Resource Graph View
? See whether resources
are overallocated,
what capacity they're
working at, and how
much they cost in a
timescale graph
? To view, click the
Resource Graph icon
More Views
? Resource Sheet View
– Easy way to review, add, edit data about
resources
? Resource Usage View
– Work with resource and task information side
by side
The Project is Now Complete !!
? MS Project is a very powerful tool if it is
used correctly
? This program can save a lot of time for
engineers who are interested in time, cost,
etc.
? Automatically keeps your project
organized.
Thank you !!
Please feel free to ask any questions
More Related Content

Similar to Microsoft Project Presentation For Beginners (20)

PDF
MProjectTutorial.pdf
dhansingh21
?
DOCX
Project Management Quick Reference Guide
Ahmad Hammoud,CPM,IBA,MSE,NLP
?
DOCX
Project Management Quick Reference Guide For Microsoft Project 2007
Toney Sisk
?
DOCX
Project Management Quick Reference Guide for Microsoft Project 2007
Toney Sisk
?
PPT
TID Chapter 6 Introduction To Microsoft Project
WanBK Leo
?
PDF
Microsoft project training manual
Khalid Mahmood
?
DOCX
Events Planning - Midterm 2 quiz.docx
MIkeBryanjoaquin
?
PDF
Omni plan 2-manual
Sang Yup Park
?
PPT
project management -04.ppt
MdHelalHossain6
?
PPTX
Microsoft Project Foundations Course.pptx
Keshava Prasad, PMP?, CSM?SAFe? Agilist
?
PDF
WBS Gantt chart and project management for Jira users
Tam Nguyen, PMP, CSM
?
PPTX
GANTT CHART nursing Management for Msc nursing
Thangamjayarani
?
PDF
Ms project lectures
jillmitchell8778
?
PDF
Microsoft project 2003
pparakh
?
PDF
Boost Your Project Efficiency with Gantt Charts
Orangescrum
?
PPT
Project management teaching
CHIRANJAN SAHA
?
PDF
Ms.project brochure
Zabeel Institute
?
PDF
sMs project tutorial_iit
Kushal Patel
?
PDF
Ms project tutorial
Ronald Oroya
?
PDF
Microsoft project advanced
amitksharan
?
MProjectTutorial.pdf
dhansingh21
?
Project Management Quick Reference Guide
Ahmad Hammoud,CPM,IBA,MSE,NLP
?
Project Management Quick Reference Guide For Microsoft Project 2007
Toney Sisk
?
Project Management Quick Reference Guide for Microsoft Project 2007
Toney Sisk
?
TID Chapter 6 Introduction To Microsoft Project
WanBK Leo
?
Microsoft project training manual
Khalid Mahmood
?
Events Planning - Midterm 2 quiz.docx
MIkeBryanjoaquin
?
Omni plan 2-manual
Sang Yup Park
?
project management -04.ppt
MdHelalHossain6
?
Microsoft Project Foundations Course.pptx
Keshava Prasad, PMP?, CSM?SAFe? Agilist
?
WBS Gantt chart and project management for Jira users
Tam Nguyen, PMP, CSM
?
GANTT CHART nursing Management for Msc nursing
Thangamjayarani
?
Ms project lectures
jillmitchell8778
?
Microsoft project 2003
pparakh
?
Boost Your Project Efficiency with Gantt Charts
Orangescrum
?
Project management teaching
CHIRANJAN SAHA
?
Ms.project brochure
Zabeel Institute
?
sMs project tutorial_iit
Kushal Patel
?
Ms project tutorial
Ronald Oroya
?
Microsoft project advanced
amitksharan
?

Recently uploaded (20)

PDF
QuarterlyAccountingRoundupQ12023UpdateonImportantDevelopmentsMarch292023.pdf
nirmalksugumar
?
PPTX
Case Study Kale’s Seamless NetSuite Implementation with Contetra.pptx
jayjani123
?
PDF
Making History Accessible Shivsrushti’s ?50 Entry Initiative Backed by Abhay ...
Harsh Mishra
?
PPTX
Principles of Procurment in Nepal for public sector
AnandAdhikari6
?
PPTX
RECENT DEVELOPMENT IN TAXATION OF CHARITABLE TRUST
imccci
?
PDF
Interim Conditional Indexation report 2025.pdf
Henry Tapper
?
PDF
Gold Price Dynamic | September 2024 | 888
888
?
PPTX
RUSSIA PRESENTATION REHAN.ghhhhhhhhhpptx
jannatfiroz123
?
PPTX
Panel 2 - Panel discussion - Demystifying key critical & practical issues und...
imccci
?
PPTX
climate_change_global_action_and_local_responsibility_xmkvszbw.pptx
hamdeyadd
?
PPTX
原版西班牙维克大学-加泰罗尼亚中央大学毕业证(鲍痴滨颁毕业证书)如何办理
taqyed
?
PDF
shubhamppt1.pdf gghg owwwwwsummmmmmmmmmmm
uchihasasooke6
?
PPTX
DAA Effective Debt Collection Practices.pptx
Double Ace Associates
?
PPTX
Introduction to microeconomics: chapter 8.pptx
kamillamashanlo517
?
PPTX
Prospects & Challenges of Doing Business in Nepal: Investment Opportunities, ...
Kshitiz Parajuli
?
PDF
kjvgjkgkjgjkgkjgjkgjkgkjgkjgkjgjkgkjgkjgjk
MarkPReyes
?
PPTX
PPT Ch 16_analisis dan pelaporan laporan keuanganBank.pptx
roqiganteng
?
PPTX
Recipe_Website_Professional_Themed_Presentation.pptx
AnantMadaan1
?
PPTX
M&A presentation: Finance Master for Dummies
MarioDucreux2
?
QuarterlyAccountingRoundupQ12023UpdateonImportantDevelopmentsMarch292023.pdf
nirmalksugumar
?
Case Study Kale’s Seamless NetSuite Implementation with Contetra.pptx
jayjani123
?
Making History Accessible Shivsrushti’s ?50 Entry Initiative Backed by Abhay ...
Harsh Mishra
?
Principles of Procurment in Nepal for public sector
AnandAdhikari6
?
RECENT DEVELOPMENT IN TAXATION OF CHARITABLE TRUST
imccci
?
Interim Conditional Indexation report 2025.pdf
Henry Tapper
?
Gold Price Dynamic | September 2024 | 888
888
?
RUSSIA PRESENTATION REHAN.ghhhhhhhhhpptx
jannatfiroz123
?
Panel 2 - Panel discussion - Demystifying key critical & practical issues und...
imccci
?
climate_change_global_action_and_local_responsibility_xmkvszbw.pptx
hamdeyadd
?
原版西班牙维克大学-加泰罗尼亚中央大学毕业证(鲍痴滨颁毕业证书)如何办理
taqyed
?
shubhamppt1.pdf gghg owwwwwsummmmmmmmmmmm
uchihasasooke6
?
DAA Effective Debt Collection Practices.pptx
Double Ace Associates
?
Introduction to microeconomics: chapter 8.pptx
kamillamashanlo517
?
Prospects & Challenges of Doing Business in Nepal: Investment Opportunities, ...
Kshitiz Parajuli
?
kjvgjkgkjgjkgkjgjkgjkgkjgkjgkjgjkgkjgkjgjk
MarkPReyes
?
PPT Ch 16_analisis dan pelaporan laporan keuanganBank.pptx
roqiganteng
?
Recipe_Website_Professional_Themed_Presentation.pptx
AnantMadaan1
?
M&A presentation: Finance Master for Dummies
MarioDucreux2
?
Ad

Microsoft Project Presentation For Beginners

  • 1. Microsoft Project Presentation By Corey Johnson 10/11/00
  • 2. What is a Gantt Chart? ? A Gantt Chart is a visual tool to help Plan, Manage, and Track a project or projects.
  • 4. Planning a Project ? Define Goals ? Develop Tasks ? Establish Timeframes ? Resource Availability? ? Organize
  • 5. Managing and Tracking a Project ? Track Progress – Are the tasks being completed on time? – Is one task holding up the whole project? ? Manage Finances – Is the project going to stay within the budget?
  • 6. Using MS Project ? Define the Project ? Build the Plan – Set a start date – Enter tasks/durations – Assign resources – Link tasks – Fine tune the plan
  • 7. Using MS Project (cont’d) ? Track and Manage – Set a baseline – Enter actuals – Adjust plan ? Close Project
  • 8. Defining the Project ? The objective of the project should be defined by the person/group that is going to manage the project. ? Tasks, start times, and deadlines should be clearly established.
  • 9. Setting a Start Date ? When opening a new Microsoft Project file, the user is automatically prompted for a start date. Setting an accurate start date will make future entries more convenient.
  • 10. Entering Tasks and Durations ? Tasks are entered in the “Task Name” column ? Subtasks are created by indenting a task. ? Durations may be entered in number of working days or start and finish dates may be used
  • 12. Standard Markers ? Normal Task – designates ordinary task duration ? Summary Bar – designates the duration of a group of sub-tasks
  • 13. Special Markers ? Milestones – A reference point marking a major event in a project and used to monitor the project's progress – To create a milestone, Enter “0” in the duration field
  • 14. Changing Marker Styles ? Double-click on the Marker you want to change and format accordingly
  • 15. Assigning Resources ? A resource can be a single person, a piece of equipment, or it can represent a group, such as Plumbers ? Information on resources include Availability, Costs, and Working Time ? Resources are very important in accurate scheduling
  • 16. Assigning Resources ? To Assign a Resource: – Select the task to which you want to assign the resource – Click the Assign Resources button on the toolbar
  • 17. Assigning Resources ? If resources are not already set up, double click on the name box
  • 18. Assigning Resources ? Enter pertinent information and click OK.
  • 19. Assigning Resources ? When a resource has been selected, click Assign
  • 20. Linking Tasks ? Some tasks require that another task be completed before it can begin. These tasks must be linked. ? Tasks and subtasks are linked by assigning Predecessors.
  • 21. Linking Tasks ? Predecessor – A task that must start or finish before another task can start or finish ? Successor – A task that cannot start or finish until another task starts or finishes – A task becomes a successor when a row number is entered in the predecessor column
  • 23. Fine Tune the Plan ? When all resources have been assigned and appropriate tasks are linked, the original Gantt chart will be complete ? Check to make sure tasks have been linked correctly and task durations are correct ? The project is now ready to begin
  • 24. Set a Baseline ? A baseline compares your original plan for the project with the actual course of the project. ? You can see which tasks started earlier or later than planned, exceeded their original budget, took longer than planned, and so on.
  • 25. Set a Baseline ? Create a baseline after you've polished it and just before you actually start work on the project ? To track costs, be sure to enter cost information before you create the baseline ? Updates can easily be made to the baseline if information is missing
  • 26. Set a Baseline ? The Baseline plan includes: – Tasks (start and finish dates, duration, work, cost, splits, timephased work, and timephased cost) – Resources (work, cost, timephased work, and timephased cost) – Assignments (start and finish dates, work, cost, timephased work, and timephased cost)
  • 27. Set a Baseline ? To set a baseline: – Point to Tracking on the Tools menu – Click Save Baseline
  • 28. Entering Progress ? Update actual start and finish dates for a task. – On the Tools menu, point to Tracking and then click Update Task – Under Actual, type Start and Finish dates
  • 29. Entering Progress ? Update progress on a task – Double-click on the task to be updated – Enter a percentage – On the Gantt chart, a progress bar appears in the task bar
  • 30. Tracking Gantt Chart ? Tracks the progress of the project ? Shows what tasks are overdue and what has been completed on time ? Click on the Tracking Gantt icon to view
  • 32. Tracking Progress ? Determining if tasks are starting and finishing according to plan: – In the Tracking Gantt, point to Table (View menu) and click Variance – Drag the Divider bar to the right to view variance. – Variance is shown in Days
  • 33. Tracking Progress ? Determine if tasks cost more or less than budgeted – In the Tracking Gantt, point to Table (View menu) and click Cost – Drag the Divider bar to the right to view Total Cost and Baseline fields
  • 34. PERT Chart ? Shows a flowchart of the project. ? Each box represents a task in the project. ? Connecting arrows show dependencies between tasks. ? To view, click the PERT chart icon
  • 35. Calendar View ? Keeps tabs on when tasks occur. ? Quickly see how long tasks take, when they start and finish, and how they occur in relation to other tasks. ? To view, click the Calendar icon
  • 36. Task Usage View ? Work with task and resource information side by side. ? Easily create useful reports about when a resource is scheduled to work on a task. ? To view, click the Task Usage icon
  • 37. Resource Graph View ? See whether resources are overallocated, what capacity they're working at, and how much they cost in a timescale graph ? To view, click the Resource Graph icon
  • 38. More Views ? Resource Sheet View – Easy way to review, add, edit data about resources ? Resource Usage View – Work with resource and task information side by side
  • 39. The Project is Now Complete !! ? MS Project is a very powerful tool if it is used correctly ? This program can save a lot of time for engineers who are interested in time, cost, etc. ? Automatically keeps your project organized.
  • 40. Thank you !! Please feel free to ask any questions