際際滷

際際滷Share a Scribd company logo
Deriving 24/7 Operational OD Matrices
  From AirSage Mobile Phone Data

      Sacramento Pilot Study and Beyond


                  October 2011
              Jingtao Ma, PhD, PE,
                  Mygistics, Inc.
Agenda
   Brief overview of OD derivation methodology and techniques
   AirSage data processing
   MobileOD pilot for Sacramento, CA
     Pre-processing: sample trips
     Projection based on CTPP survey data
     Hourly Vehicular OD (path flow) refinement based on static traffic
      assignment
   Vehicular path flow estimation based on observed path choice
     Path matching
     Path flow aggregation
     OD estimation (TFlowFuzzy) from path flows


                                                                           2
Traditional Methods for Operational OD Derivation
   Travel demand model:
     Calculated, not observed and thus only as good as the model itself
     Only a fixed point snapshot of the mobility pattern


   Active probing: Automated number plate recognition (ANPR) or Bluetooth
    MAC matching
     Potentially more accurate, but usually case by case on a small scale
     Relatively slow turnaround
     Very expensive


   Passive probing: GPS based navigation devices
     Small samples
     Biased towards fleets and are thus not representative of a communitys
      travel patterns
                                                                                3
OD Derivation Methods: Why Mobile OD?
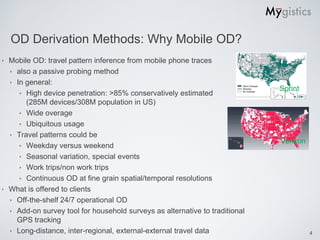
 Mobile OD: travel pattern inference from mobile phone traces
   also a passive probing method
   In general:
                                                                             Sprint
      High device penetration: >85% conservatively estimated
       (285M devices/308M population in US)
      Wide overage
      Ubiquitous usage
   Travel patterns could be
                                                                             Verizon
      Weekday versus weekend
      Seasonal variation, special events
      Work trips/non work trips
      Continuous OD at fine grain spatial/temporal resolutions
 What is offered to clients
   Off-the-shelf 24/7 operational OD
   Add-on survey tool for household surveys as alternative to traditional
    GPS tracking
   Long-distance, inter-regional, external-external travel data                       4
How AirSage Technology Works
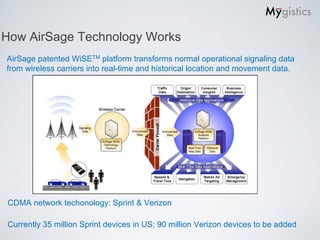
AirSage patented WiSETM platform transforms normal operational signaling data
from wireless carriers into real-time and historical location and movement data.


CDMA network techonology: Sprint & Verizon

Currently 35 million Sprint devices in US; 90 million Verizon devices to be added
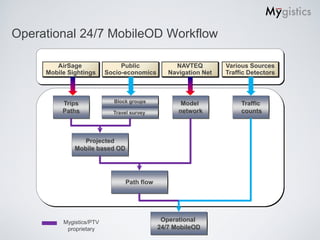
Operational 24/7 MobileOD Workflow

        AirSage                Public            NAVTEQ         Various Sources
     Mobile Sightings     Socio-economics      Navigation Net   Traffic Detectors


          Trips             Block groups           Model             Traffic
          Paths             Travel survey         network            counts


                 Projected
              Mobile based OD


                                Path flow


          Mygistics/PTV                      Operational
           proprietary                      24/7 MobileOD
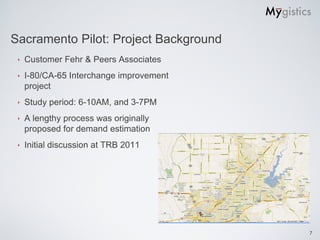
Sacramento Pilot: Project Background
    Customer Fehr & Peers Associates
    I-80/CA-65 Interchange improvement
     project
    Study period: 6-10AM, and 3-7PM
    A lengthy process was originally
     proposed for demand estimation
    Initial discussion at TRB 2011


                                          7
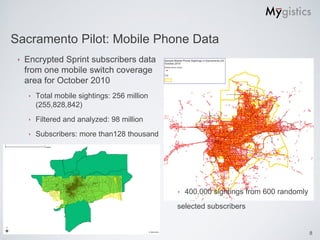
Sacramento Pilot: Mobile Phone Data
    Encrypted Sprint subscribers data
     from one mobile switch coverage
     area for October 2010
        Total mobile sightings: 256 million
         (255,828,842)
        Filtered and analyzed: 98 million
        Subscribers: more than128 thousand


                                                  400,000 sightings from 600 randomly
                                               selected subscribers


                                                                                         8
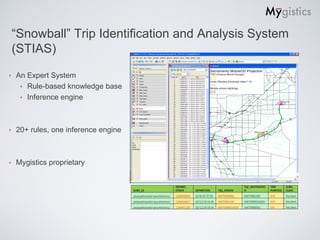
Snowball Trip Identification and Analysis System
    (STIAS)

   An Expert System
      Rule-based knowledge base
      Inference engine


   20+ rules, one inference engine


   Mygistics proprietary
Trip Identification: The Mygistics Difference
   14 randomly selected subscribers from the
    Sacramento dataset                  Regression Analysis: Eyes vs Myg-alg
                                                                                                                0.4.1

   Trips from three methods                                                       80

                                                                                   70

                                                                                   60
         Eyes          Myg-alg0.4.1      AirSage
                  22                18                 7                           50
                  16                 8                15


                                                                            Eyes
                                                                                   40
                  68                54                 6
                                                                                                                                    Predicted Y
                   8                 6                 7                           30
                  22                20                10                           20
                  13                10                 2
                  25
                  41
                                    22
                                    46
                                                      17
                                                      26
                                                                                   10

                                                                                     0
                                                                                                                     R2 = 0.89
                   9                 9                 3                                 0             20            40        60
                  21                25                 5                                                Mygi-Alg 0.4.1
                   6                 4                 2
                  10                13                 1                                     Regression analysis: Eyes vs AirSage
                  28                18                 7                             80
                  38                27                 5
                                                                                     70
                 327               280               113
                100%             85.6%             34.6%                             60

    80                                                     Improvement               50
                                                                              Eyes


    60                                                      factor of 2.5            40

                                                                                     30
                                            Eyes
    40                                                                               20
                                            Alg0.4.1
    20                                                                               10                                        R2 = 0.11
                                            AirSage                                      0
    0                                                                                        0     5          10        15     20      25         30
                                                                                                                     AirSage
         1 3 5 7 9 11 13
                                                                                                                                                       10
STIAS: Benchmark & Validation
    Do these numbers apply to the entire dataset?
    For these samples: 280 versus 113 (MYG alg 0.4.1 vs. AirSage Known Trips)
         Factor of 2.47
    For the entire Sacramento dataset: 2.20 million vs. 1.04 million
         Factor of 2.12
    The sample benchmarking favored Myg-alg 0.4.1 a little, but not too much
    Mygistics currently working on version 0.5, hopefully to get to the point of 90+% of
     trips identifiable by human eyes
         Which will bring to the same level of factor 2.5


                                                                                            11
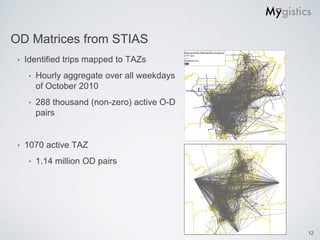
OD Matrices from STIAS
   Identified trips mapped to TAZs
       Hourly aggregate over all weekdays
        of October 2010
       288 thousand (non-zero) active O-D
        pairs


   1070 active TAZ
       1.14 million OD pairs


                                             12
Path Matching (Trajectories)
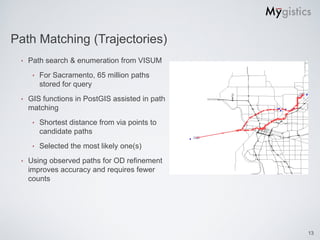
    Path search & enumeration from VISUM
         For Sacramento, 65 million paths
          stored for query
    GIS functions in PostGIS assisted in path
     matching
         Shortest distance from via points to
          candidate paths
         Selected the most likely one(s)
    Using observed paths for OD refinement
     improves accuracy and requires fewer
     counts


                                                 13
Sacramento Pilot: Results
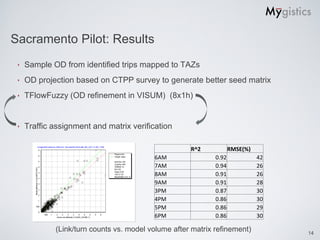
    Sample OD from identified trips mapped to TAZs
    OD projection based on CTPP survey to generate better seed matrix
    TFlowFuzzy (OD refinement in VISUM) (8x1h)


    Traffic assignment and matrix verification

                                                     R^2            RMSE(%)
                                          6AM                0.92             42
                                          7AM                0.94             26
                                          8AM                0.91             26
                                          9AM                0.91             28
                                          3PM                0.87             30
                                          4PM                0.86             30
                                          5PM                0.86             29
                                          6PM                0.86             30

             (Link/turn counts vs. model volume after matrix refinement)           14
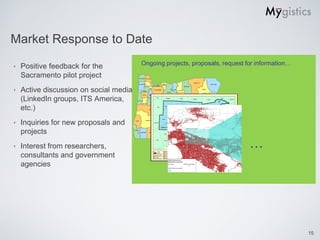
Market Response to Date
                                        Ongoing projects, proposals, request for information
   Positive feedback for the
    Sacramento pilot project
   Active discussion on social media
    (LinkedIn groups, ITS America,
    etc.)
   Inquiries for new proposals and
    projects
   Interest from researchers,                                                
    consultants and government
    agencies


                                                                                                15
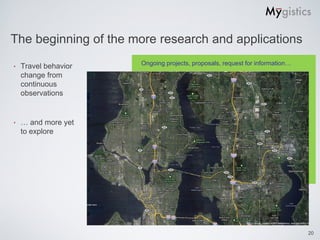
The beginning of the more research and applications
                      Ongoing projects, proposals, request for information
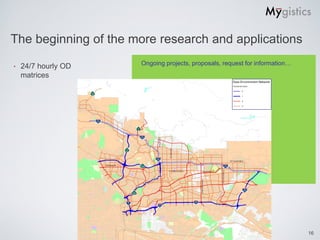
   24/7 hourly OD
    matrices


                                                                              16
The beginning of the more research and applications
                      Ongoing projects, proposals, request for information
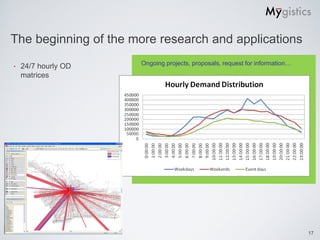
   24/7 hourly OD
    matrices


                                                                              17
OD Matrices Analysis
    Identified trips mapped to TAZs
         Hourly aggregate over all
          weekdays of October 2010
    597,529 for Mobile OD (block group
     level for two months data)
         (non-zero) active O-D pairs
              308,988 for weekdays
              102,571 for weekends
              158,617 for event days
                       Active OD Pairs     Sample Size      Internal +       Paths/Active OD
                                                         External=Num of      Pair (Internal/
                                                              Paths             External)
 Weekdays        289,059+1992      51.7%     41 days     270,661+245,851=5   1.95 (0.93/12.3)
                   9=308,988                                   16,512
 Weekends        82,642+19,929     17.2%     16 days     27,771+84,075=111    1.85 (0.34/4.2)
                    =102,571                                    ,846
Event Days       138,688+19,92     26.5%     4 days      21,222+80,795=102    1.92 (0.15/4.1)
                   9=158,617                                    ,017
                                                                                                18
The beginning of the more research and applications
                      Ongoing projects, proposals, request for information
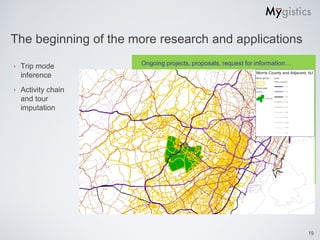
   Trip mode
    inference
   Activity chain
    and tour
    imputation


                                                                              19
The beginning of the more research and applications
                      Ongoing projects, proposals, request for information
   Travel behavior
    change from
    continuous
    observations


    and more yet
    to explore


                                                                              20
Mygistics MobileOD
    Full OD trip tables, not OD samples
    24 hourly matrices for 7 days a week
    Census block group resolution (custom zone structure
     possible)
    Internal, external/internal and external/external trips
    Survey add-on tools (on-board survey, household survey)


                                                               21
Contact
    Jingtao Ma
    jma@mygistics.com
    503-575-2191 ext 2802


                             22
More Related Content

MobileOD: travel patterns from large scale mobile phone data

  • 1. Deriving 24/7 Operational OD Matrices From AirSage Mobile Phone Data Sacramento Pilot Study and Beyond October 2011 Jingtao Ma, PhD, PE, Mygistics, Inc.
  • 2. Agenda Brief overview of OD derivation methodology and techniques AirSage data processing MobileOD pilot for Sacramento, CA Pre-processing: sample trips Projection based on CTPP survey data Hourly Vehicular OD (path flow) refinement based on static traffic assignment Vehicular path flow estimation based on observed path choice Path matching Path flow aggregation OD estimation (TFlowFuzzy) from path flows 2
  • 3. Traditional Methods for Operational OD Derivation Travel demand model: Calculated, not observed and thus only as good as the model itself Only a fixed point snapshot of the mobility pattern Active probing: Automated number plate recognition (ANPR) or Bluetooth MAC matching Potentially more accurate, but usually case by case on a small scale Relatively slow turnaround Very expensive Passive probing: GPS based navigation devices Small samples Biased towards fleets and are thus not representative of a communitys travel patterns 3
  • 4. OD Derivation Methods: Why Mobile OD? Mobile OD: travel pattern inference from mobile phone traces also a passive probing method In general: Sprint High device penetration: >85% conservatively estimated (285M devices/308M population in US) Wide overage Ubiquitous usage Travel patterns could be Verizon Weekday versus weekend Seasonal variation, special events Work trips/non work trips Continuous OD at fine grain spatial/temporal resolutions What is offered to clients Off-the-shelf 24/7 operational OD Add-on survey tool for household surveys as alternative to traditional GPS tracking Long-distance, inter-regional, external-external travel data 4
  • 5. How AirSage Technology Works AirSage patented WiSETM platform transforms normal operational signaling data from wireless carriers into real-time and historical location and movement data. CDMA network techonology: Sprint & Verizon Currently 35 million Sprint devices in US; 90 million Verizon devices to be added
  • 6. Operational 24/7 MobileOD Workflow AirSage Public NAVTEQ Various Sources Mobile Sightings Socio-economics Navigation Net Traffic Detectors Trips Block groups Model Traffic Paths Travel survey network counts Projected Mobile based OD Path flow Mygistics/PTV Operational proprietary 24/7 MobileOD
  • 7. Sacramento Pilot: Project Background Customer Fehr & Peers Associates I-80/CA-65 Interchange improvement project Study period: 6-10AM, and 3-7PM A lengthy process was originally proposed for demand estimation Initial discussion at TRB 2011 7
  • 8. Sacramento Pilot: Mobile Phone Data Encrypted Sprint subscribers data from one mobile switch coverage area for October 2010 Total mobile sightings: 256 million (255,828,842) Filtered and analyzed: 98 million Subscribers: more than128 thousand 400,000 sightings from 600 randomly selected subscribers 8
  • 9. Snowball Trip Identification and Analysis System (STIAS) An Expert System Rule-based knowledge base Inference engine 20+ rules, one inference engine Mygistics proprietary
  • 10. Trip Identification: The Mygistics Difference 14 randomly selected subscribers from the Sacramento dataset Regression Analysis: Eyes vs Myg-alg 0.4.1 Trips from three methods 80 70 60 Eyes Myg-alg0.4.1 AirSage 22 18 7 50 16 8 15 Eyes 40 68 54 6 Predicted Y 8 6 7 30 22 20 10 20 13 10 2 25 41 22 46 17 26 10 0 R2 = 0.89 9 9 3 0 20 40 60 21 25 5 Mygi-Alg 0.4.1 6 4 2 10 13 1 Regression analysis: Eyes vs AirSage 28 18 7 80 38 27 5 70 327 280 113 100% 85.6% 34.6% 60 80 Improvement 50 Eyes 60 factor of 2.5 40 30 Eyes 40 20 Alg0.4.1 20 10 R2 = 0.11 AirSage 0 0 0 5 10 15 20 25 30 AirSage 1 3 5 7 9 11 13 10
  • 11. STIAS: Benchmark & Validation Do these numbers apply to the entire dataset? For these samples: 280 versus 113 (MYG alg 0.4.1 vs. AirSage Known Trips) Factor of 2.47 For the entire Sacramento dataset: 2.20 million vs. 1.04 million Factor of 2.12 The sample benchmarking favored Myg-alg 0.4.1 a little, but not too much Mygistics currently working on version 0.5, hopefully to get to the point of 90+% of trips identifiable by human eyes Which will bring to the same level of factor 2.5 11
  • 12. OD Matrices from STIAS Identified trips mapped to TAZs Hourly aggregate over all weekdays of October 2010 288 thousand (non-zero) active O-D pairs 1070 active TAZ 1.14 million OD pairs 12
  • 13. Path Matching (Trajectories) Path search & enumeration from VISUM For Sacramento, 65 million paths stored for query GIS functions in PostGIS assisted in path matching Shortest distance from via points to candidate paths Selected the most likely one(s) Using observed paths for OD refinement improves accuracy and requires fewer counts 13
  • 14. Sacramento Pilot: Results Sample OD from identified trips mapped to TAZs OD projection based on CTPP survey to generate better seed matrix TFlowFuzzy (OD refinement in VISUM) (8x1h) Traffic assignment and matrix verification R^2 RMSE(%) 6AM 0.92 42 7AM 0.94 26 8AM 0.91 26 9AM 0.91 28 3PM 0.87 30 4PM 0.86 30 5PM 0.86 29 6PM 0.86 30 (Link/turn counts vs. model volume after matrix refinement) 14
  • 15. Market Response to Date Ongoing projects, proposals, request for information Positive feedback for the Sacramento pilot project Active discussion on social media (LinkedIn groups, ITS America, etc.) Inquiries for new proposals and projects Interest from researchers, consultants and government agencies 15
  • 16. The beginning of the more research and applications Ongoing projects, proposals, request for information 24/7 hourly OD matrices 16
  • 17. The beginning of the more research and applications Ongoing projects, proposals, request for information 24/7 hourly OD matrices 17
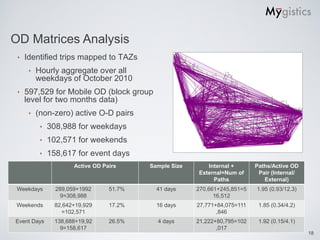
  • 18. OD Matrices Analysis Identified trips mapped to TAZs Hourly aggregate over all weekdays of October 2010 597,529 for Mobile OD (block group level for two months data) (non-zero) active O-D pairs 308,988 for weekdays 102,571 for weekends 158,617 for event days Active OD Pairs Sample Size Internal + Paths/Active OD External=Num of Pair (Internal/ Paths External) Weekdays 289,059+1992 51.7% 41 days 270,661+245,851=5 1.95 (0.93/12.3) 9=308,988 16,512 Weekends 82,642+19,929 17.2% 16 days 27,771+84,075=111 1.85 (0.34/4.2) =102,571 ,846 Event Days 138,688+19,92 26.5% 4 days 21,222+80,795=102 1.92 (0.15/4.1) 9=158,617 ,017 18
  • 19. The beginning of the more research and applications Ongoing projects, proposals, request for information Trip mode inference Activity chain and tour imputation 19
  • 20. The beginning of the more research and applications Ongoing projects, proposals, request for information Travel behavior change from continuous observations and more yet to explore 20
  • 21. Mygistics MobileOD Full OD trip tables, not OD samples 24 hourly matrices for 7 days a week Census block group resolution (custom zone structure possible) Internal, external/internal and external/external trips Survey add-on tools (on-board survey, household survey) 21
  • 22. Contact Jingtao Ma jma@mygistics.com 503-575-2191 ext 2802 22