Mse June 24 2011
0 likes506 views
This document discusses comparing two dairy product testing systems, the Foss and CEM testers, to an independent third party tester to determine which provides more accurate results. The author notes the CEM testers currently agree more closely with the third party but take longer than the Foss testers. They have re-calibrated the Foss testers and plan to test samples from six dairy products on both systems and send to the third party to statistically compare the results and see which agrees more closely with the third party.
1 of 7
Download to read offline

Ad
Recommended
Production Efficiency July 2011
Production Efficiency July 2011ExerciseLeanLLC
╠²
This document outlines the lean deployment status and initiatives at a company in 2010, including tracking cycle time and fluctuations, implementing standardized work, standard operating procedures, production tracking, tool changeover tracking, use of visual management tools like a parts board, implementing pull systems like MIFA/MIFD and kanban, and developing action plans for further improvements.8 D Training ║▌║▌▀Żs
8 D Training ║▌║▌▀ŻsExerciseLeanLLC
╠²
The document outlines the agenda and schedule for a 5S training taking place on December 11, 2006. The training will cover the five pillars of 5S - Sort, Set in Order, Shine, Standardize, and Sustain. For each pillar there will be a presentation followed by team exercises where participants will apply the concepts and present their results. The schedule also allocates time for breaks between sessions.Strategic Planning Overview[1]
Strategic Planning Overview[1]ExerciseLeanLLC
╠²
The document outlines the phases of lean strategic planning including examining the current state, creating a strategy map and plan, and building the plan's elements. It describes analyzing strengths, weaknesses, opportunities and threats (SWOT), setting SMART objectives, and implementing the plan through policy deployment across departments. The overall goal is to create a strategic plan that leads to organizational improvement, lower costs, and financial growth through understanding the current situation and implementing initiatives.June Continuous Improvement Focus
June Continuous Improvement FocusExerciseLeanLLC
╠²
The document discusses a company's continuous improvement focus for the month. It details that 5S initiatives and value stream mapping have been completed. Equipment maintenance has been identified as crucial for success. A consultant will visit next week to check on actions, discuss barriers, and help develop lean strategies and tactical plans for each facility. The facilities will report quick hit goals and any roadblocks for the consultant to review.Warwick Lean Agenda Aug Wk1 July 12 2010
Warwick Lean Agenda Aug Wk1 July 12 2010ExerciseLeanLLC
╠²
The 5-day agenda involves conducting a rapid site assessment and value stream mapping for a company. Day 1 includes an introduction and site assessment. Day 2 covers process mapping and standardizing work. Day 3 focuses on developing a new process introduction plan. Day 4 creates an action plan. Day 5 summarizes the workshop and gets management approval on the plan. The overall goal is to analyze and improve the company's key processes.Failure Mode Effect Analysis (FMEA)
Failure Mode Effect Analysis (FMEA)DEEPAK SAHOO
╠²
The document outlines a training program on Failure Mode and Effects Analysis (FMEA) conducted by Mr. Deepak Sahoo, detailing its history, definitions, types, and systematic processes. It emphasizes the benefits of FMEA for improving product reliability, quality, and safety while reducing costs. The program also covers terminology, team roles, and structured steps to implement FMEA effectively.Fmea Handbook V4.1[1][1]
Fmea Handbook V4.1[1][1]ExerciseLeanLLC
╠²
The document introduces the Ford Motor Company FMEA Handbook which provides guidance on conducting Failure Mode and Effects Analyses (FMEAs) to identify and address potential failures in product design, manufacturing processes, and concepts. The handbook covers Design FMEAs, Process FMEAs, and Concept FMEAs and includes examples, forms, and best practices. It aims to help engineering teams at Ford and its suppliers conduct effective FMEAs to improve product quality and safety.Exercise Lean Llc Revised Brochure July 11 2011
Exercise Lean Llc Revised Brochure July 11 2011ExerciseLeanLLC
╠²
Trifold Brochure of Exercise Lean LLC July 2011 updatedStd Wk Job Breakdown 522 P051 30
Std Wk Job Breakdown 522 P051 30ExerciseLeanLLC
╠²
This document provides the standard work job breakdown procedure for operation 30 which is machining a flange outer part. It involves checking documentation from prior operations to ensure safety and quality requirements are met. The procedure lists the materials, tools, personal protective equipment, and steps needed to complete the machining of the flange outer part according to safety and quality standards.Certificate 20of 20 Participation 20 Silico 20 Petak 20 Fmea[1]
Certificate 20of 20 Participation 20 Silico 20 Petak 20 Fmea[1]ExerciseLeanLLC
╠²
This certificate recognizes John Petak for participating in the webinar "Strategic Error Proofing: Achieving Success Every Time with Smarter FMEAs" hosted by Silico Corporation on February 8, 2011 from 2:00 PM to 3:00 PM EST. The certificate is signed by John M. Cachat, President and CEO of Silico Corporation.System Kaizen Process Feb 6 2011
System Kaizen Process Feb 6 2011ExerciseLeanLLC
╠²
The document provides an overview of lean production principles and the system kaizen process for continuous improvement. It describes the Plan-Do-Check-Act cycle and how to document an improvement project using the A3 report format. The A3 report guides teams through defining the current condition, target condition, implementation plan, key performance indicators, and approval process. The goal is to standardize improvements to sustain gains over time on the path towards an ideal lean system with continuous flow and zero waste.Services Of Exercise Lean Group
Services Of Exercise Lean GroupExerciseLeanLLC
╠²
Operational Excellence Consultants provides a wide range of lean consulting services to help companies improve their operations and business strategies. Their services include quality management, lean deployment, accounting, human resources, marketing/sales, and lean healthcare. They assess clients' current processes and develop customized improvement strategies using techniques like value stream mapping, 5S organization, standard work, and statistical process control. Operational Excellence Consultants works with companies worldwide to generate strategic solutions that enhance development through operational excellence.F119 Team Report Out Dec 16, 2009[1]
F119 Team Report Out Dec 16, 2009[1]ExerciseLeanLLC
╠²
The document summarizes a three-day waste reduction workshop held by Trust Technologies, Inc. for their F119 cell production of part 524P235-01. Day one covered lean manufacturing principles and identifying value-added and non-value added process steps. The team mapped the current state, calculated takt time, and identified opportunities. Day two involved gathering inventory and cycle time data, reviewing metrics, and constructing a future state map. Day three finalized recommendations in an A3 report, including moving to a flow-oriented layout to reduce travel times and balance work content.6 S System[1] In Spanish[1]ExerciseLeanLLC
╠²
El documento describe el sistema 6S, cuyo objetivo es crear un lugar de trabajo visualmente ordenado, limpio y seguro para mejorar la calidad, eficiencia y motivaci├│n. Los 6 pasos son: 1) clasificar, 2) ordenar, 3) limpiar, 4) estandarizar, 5) mantener y 6) asegurar. Siguiendo estos pasos de manera sistem├Ītica, se pueden mejorar la productividad y reducir costos mediante la eliminaci├│n de actividades innecesarias y la creaci├│n de un ambiente de trabajo m├Īs transparente y ordenado.Trust Tech F119 Rapid Assessment & Hoshin Workshop Report Out
Trust Tech F119 Rapid Assessment & Hoshin Workshop Report OutExerciseLeanLLC
╠²
This letter summarizes the results of implementing lean manufacturing techniques recommended by Exercise Lean at the Kilroy Company. Key points:
- The original work cell was unprofitable, losing $50 per part shipped. Exercise Lean implemented techniques like 5S, visual management boards, and a new cell layout.
- The new processes significantly reduced travel times within the cell from 3 football fields to under 100 feet.
- Results include increased production from 30 to 100 units per week, achieving a 20% profit margin goal. Employee absenteeism also dropped 11%.
- The author highly recommends Exercise Lean for their expertise in implementing lean techniques that improved productivity, quality, and employee satisfaction at the Kilroy Company.Rapid Site Assessment July 3 2010
Rapid Site Assessment July 3 2010ExerciseLeanLLC
╠²
This document discusses the eight wastes of lean manufacturing: transportation, inventory, motion, waiting, overprocessing, overproduction, defects, and unused human potential. For each waste, it provides a definition, examples, indicators that the waste exists, and recommended actions to address the waste. The overall goal is to identify and eliminate non-value-added activities in order to improve process flow and productivity.Assurion%20 Value%20 Added%20 Process%20 Steps[1]
Assurion%20 Value%20 Added%20 Process%20 Steps[1]ExerciseLeanLLC
╠²
The document outlines the steps in the Assurion VA vs NVA process. The process involves 8 steps: 1) staging, 2) tech repair, 3) un-boxing quality control #1, 4) un-boxing RF test, 5) un-boxing flash, 6) kitting, 7) un-boxing quality control #2, and 8) holding in inventory. Some specific non-value added steps include 2b) 100% inspect, 3b) re-boxing, 4b) 100% inspect, and 5b) 100% inspect.Rapid Site Assessment June 27 2010
Rapid Site Assessment June 27 2010ExerciseLeanLLC
╠²
This document outlines eight types of waste that can occur in manufacturing processes: transportation, inventory, motion, waiting, overprocessing, overproduction, defects, and unused human potential. For each type of waste, a definition, example, indicators, and suggested actions for improvement are provided. The overall document provides a framework for assessing sources of inefficiency in manufacturing processes and identifying opportunities to reduce waste.Bob (ababs) Youssef FMEA Workshop Training at Hughes rev3
Bob (ababs) Youssef FMEA Workshop Training at Hughes rev3Abbas (Bob) Youssef MBA, PhD
╠²
The document outlines an agenda for an FMEA training workshop. It discusses Failure Mode and Effects Analysis (FMEA), including its history, purpose, and process. FMEA is a methodology used to ensure potential problems are addressed in product and process development. The agenda includes explaining FMEA, its use as a design tool, the development process, management's role, team member responsibilities, and examples. It provides details on FMEA scope, functions, failure modes, effects, occurrence, detection, and criticality analysis. The workshop aims to train participants on effectively developing and applying FMEAs.DESIGN FMEA TRAINING FOR LITENS AUTOMOTIVE
DESIGN FMEA TRAINING FOR LITENS AUTOMOTIVE Julian Kalac P.Eng
╠²
This document outlines a training for Litens Automotive on Design Failure Mode and Effects Analysis (DFMEA). The training covers DFMEA basics, consequences of poorly performed DFMEAs, identifying single points of failure, using design of experiments to optimize designs, and reviewing DFMEA examples. It emphasizes that critical dimensions must be derived from the DFMEA and that DFMEAs are important legal documents that demonstrate due diligence in design and product safety.DFMEA: Reduce Design Errors, Time and Cost
DFMEA: Reduce Design Errors, Time and CostRicardo Gonzalez Luna
╠²
The document discusses the application of Design Failure Mode and Effects Analysis (DFMEA) to enhance prototype development and reduce design errors. It outlines key steps in DFMEA including function evaluation, identifying failure modes, severity assessment, and prioritizing risks to improve product reliability and performance. Additionally, it emphasizes the need for a strategic approach to design changes and testing to mitigate potential failures.How to implement an effective fmea process
How to implement an effective fmea processASQ Reliability Division
╠²
The document discusses implementing a successful Failure Mode and Effects Analysis (FMEA) process, outlining essential characteristics, strategic planning decisions, and the roles of management and facilitators. Key factors for an effective FMEA process include management support, resource planning, integration with business processes, and continuous improvement through quality audits and software support. It also highlights the importance of linking FMEAs with other key processes and leveraging lessons learned from past analyses.ßäēßģĄßå½ßäģßģ¼ßäÆßģĪßå» ßäēßģ« ßäŗßģĄßå╗ßäéßģ│ßå½ A/B ßäÉßģ”ßäēßģ│ßäÉßģ│ļź╝ ņ£äĒĢ┤ ņĢīņĢäņĢ╝ ĒĢĀ Ļ▓āļōż
ßäēßģĄßå½ßäģßģ¼ßäÆßģĪßå» ßäēßģ« ßäŗßģĄßå╗ßäéßģ│ßå½ A/B ßäÉßģ”ßäēßģ│ßäÉßģ│ļź╝ ņ£äĒĢ┤ ņĢīņĢäņĢ╝ ĒĢĀ Ļ▓āļōżMinho Lee
╠²
ņØ┤ ļ¼Ėņä£ļŖö A/B ĒģīņŖżĒŖĖņØś ņżæņÜöņä▒Ļ│╝ ņŗĀļó░ņä▒ņØä ĒÖĢļ│┤ĒĢśĻĖ░ ņ£äĒĢ£ ņÜöņåīļź╝ ņäżļ¬ģĒĢ®ļŗłļŗż. ņŗżĒŚś ņäżĻ│ä, ĻĘĖļŻ╣ ļéśļłäĻĖ░, ļŹ░ņØ┤Ēä░ ņłśņ¦æ ļ░Å Ļ▓░Ļ│╝ ļČäņäØ ļō▒ A/B ĒģīņŖżĒŖĖņØś Ļ░ü ļŗ©Ļ│äņŚÉņä£ Ļ│ĀļĀżĒĢ┤ņĢ╝ ĒĢĀ ņäĖļČĆ ņé¼ĒĢŁņØä ļŗżļŻ╣ļŗłļŗż. ļśÉĒĢ£, ĒåĄĻ│äņĀü ņ£ĀņØśņä▒ ļ░Å p-valueņØś ĒĢ┤ņäØ ļ░®ļ▓ĢņŚÉ ļīĆĒĢ┤ņä£ļÅä ļģ╝ņØśĒĢ®ļŗłļŗż.Lab 4 handout 043012
Lab 4 handout 043012Tim Arroyo
╠²
1) The document describes an experiment to analyze the effect of a single variable on a thin film process using analysis of variance (ANOVA).
2) It provides instructions on how to design a single-factor experiment, including choosing a factor, determining levels of the factor, controlling other variables, replicating experiments, randomizing the order, and analyzing results.
3) As an example, it describes an experiment investigating the effect of DC bias voltage on silicon dioxide etching, with three voltage levels and four replicates at each level. The data is analyzed using ANOVA calculations including sums of squares.Marketing Research.pdf
Marketing Research.pdfAkshat470463
╠²
Experimental research designs are considered the standard for research. They involve assigning one or more dependent variables to different treatments and observing the results to draw conclusions. Experimental research has both advantages and disadvantages. It allows full researcher control but can be resource-intensive. It aims to determine relationships between dependent and independent variables by supporting or rejecting hypotheses. Data must be quantifiable and include measurements of variables like area, weight, temperature etc. Qualitative observations also supplement the research. Overall, experimental research uses a scientific approach to test business matters and understand customer behavior through product testing and experiments.Bad metric, bad! - Joseph Ours
Bad metric, bad! - Joseph OursQA or the Highway
╠²
The document discusses various metrics used in software testing, including test case counts, defect counts, and automation progress, highlighting common pitfalls in measurement practices. It emphasizes the importance of linking metrics to organizational objectives and warns against relying solely on counts without context or actionable insights. Additionally, the document proposes exercises to illustrate challenges in measuring testing efforts and defect discovery.Bad metric, bad!
Bad metric, bad!Centric Consulting
╠²
The document discusses various software testing metrics, highlighting their significance in measuring test case execution, defect management, and overall testing efficiency. It emphasizes common challenges faced in measuring and interpreting these metrics, including inconsistencies and misalignments with organizational objectives. Additional insights are provided through practical exercises aimed at understanding the variability and reliability of testing metrics.Experimental design cartoon part 5 sample size
Experimental design cartoon part 5 sample sizeKevin Hamill
╠²
This document discusses sample size calculations in experimental design focused on hypothesis testing, emphasizing the importance of careful planning before experiments. It outlines steps for identifying variables and selecting appropriate statistical tests based on normality and type of data, such as chi-squared tests, t-tests, ANOVA, and regression analyses. The text also highlights the need for power analysis to ensure adequate sample sizes for robust conclusions, particularly in complex experimental situations.More Related Content
Viewers also liked (16)
Std Wk Job Breakdown 522 P051 30
Std Wk Job Breakdown 522 P051 30ExerciseLeanLLC
╠²
This document provides the standard work job breakdown procedure for operation 30 which is machining a flange outer part. It involves checking documentation from prior operations to ensure safety and quality requirements are met. The procedure lists the materials, tools, personal protective equipment, and steps needed to complete the machining of the flange outer part according to safety and quality standards.Certificate 20of 20 Participation 20 Silico 20 Petak 20 Fmea[1]
Certificate 20of 20 Participation 20 Silico 20 Petak 20 Fmea[1]ExerciseLeanLLC
╠²
This certificate recognizes John Petak for participating in the webinar "Strategic Error Proofing: Achieving Success Every Time with Smarter FMEAs" hosted by Silico Corporation on February 8, 2011 from 2:00 PM to 3:00 PM EST. The certificate is signed by John M. Cachat, President and CEO of Silico Corporation.System Kaizen Process Feb 6 2011
System Kaizen Process Feb 6 2011ExerciseLeanLLC
╠²
The document provides an overview of lean production principles and the system kaizen process for continuous improvement. It describes the Plan-Do-Check-Act cycle and how to document an improvement project using the A3 report format. The A3 report guides teams through defining the current condition, target condition, implementation plan, key performance indicators, and approval process. The goal is to standardize improvements to sustain gains over time on the path towards an ideal lean system with continuous flow and zero waste.Services Of Exercise Lean Group
Services Of Exercise Lean GroupExerciseLeanLLC
╠²
Operational Excellence Consultants provides a wide range of lean consulting services to help companies improve their operations and business strategies. Their services include quality management, lean deployment, accounting, human resources, marketing/sales, and lean healthcare. They assess clients' current processes and develop customized improvement strategies using techniques like value stream mapping, 5S organization, standard work, and statistical process control. Operational Excellence Consultants works with companies worldwide to generate strategic solutions that enhance development through operational excellence.F119 Team Report Out Dec 16, 2009[1]
F119 Team Report Out Dec 16, 2009[1]ExerciseLeanLLC
╠²
The document summarizes a three-day waste reduction workshop held by Trust Technologies, Inc. for their F119 cell production of part 524P235-01. Day one covered lean manufacturing principles and identifying value-added and non-value added process steps. The team mapped the current state, calculated takt time, and identified opportunities. Day two involved gathering inventory and cycle time data, reviewing metrics, and constructing a future state map. Day three finalized recommendations in an A3 report, including moving to a flow-oriented layout to reduce travel times and balance work content.6 S System[1] In Spanish[1]ExerciseLeanLLC
╠²
El documento describe el sistema 6S, cuyo objetivo es crear un lugar de trabajo visualmente ordenado, limpio y seguro para mejorar la calidad, eficiencia y motivaci├│n. Los 6 pasos son: 1) clasificar, 2) ordenar, 3) limpiar, 4) estandarizar, 5) mantener y 6) asegurar. Siguiendo estos pasos de manera sistem├Ītica, se pueden mejorar la productividad y reducir costos mediante la eliminaci├│n de actividades innecesarias y la creaci├│n de un ambiente de trabajo m├Īs transparente y ordenado.Trust Tech F119 Rapid Assessment & Hoshin Workshop Report Out
Trust Tech F119 Rapid Assessment & Hoshin Workshop Report OutExerciseLeanLLC
╠²
This letter summarizes the results of implementing lean manufacturing techniques recommended by Exercise Lean at the Kilroy Company. Key points:
- The original work cell was unprofitable, losing $50 per part shipped. Exercise Lean implemented techniques like 5S, visual management boards, and a new cell layout.
- The new processes significantly reduced travel times within the cell from 3 football fields to under 100 feet.
- Results include increased production from 30 to 100 units per week, achieving a 20% profit margin goal. Employee absenteeism also dropped 11%.
- The author highly recommends Exercise Lean for their expertise in implementing lean techniques that improved productivity, quality, and employee satisfaction at the Kilroy Company.Rapid Site Assessment July 3 2010
Rapid Site Assessment July 3 2010ExerciseLeanLLC
╠²
This document discusses the eight wastes of lean manufacturing: transportation, inventory, motion, waiting, overprocessing, overproduction, defects, and unused human potential. For each waste, it provides a definition, examples, indicators that the waste exists, and recommended actions to address the waste. The overall goal is to identify and eliminate non-value-added activities in order to improve process flow and productivity.Assurion%20 Value%20 Added%20 Process%20 Steps[1]
Assurion%20 Value%20 Added%20 Process%20 Steps[1]ExerciseLeanLLC
╠²
The document outlines the steps in the Assurion VA vs NVA process. The process involves 8 steps: 1) staging, 2) tech repair, 3) un-boxing quality control #1, 4) un-boxing RF test, 5) un-boxing flash, 6) kitting, 7) un-boxing quality control #2, and 8) holding in inventory. Some specific non-value added steps include 2b) 100% inspect, 3b) re-boxing, 4b) 100% inspect, and 5b) 100% inspect.Rapid Site Assessment June 27 2010
Rapid Site Assessment June 27 2010ExerciseLeanLLC
╠²
This document outlines eight types of waste that can occur in manufacturing processes: transportation, inventory, motion, waiting, overprocessing, overproduction, defects, and unused human potential. For each type of waste, a definition, example, indicators, and suggested actions for improvement are provided. The overall document provides a framework for assessing sources of inefficiency in manufacturing processes and identifying opportunities to reduce waste.Bob (ababs) Youssef FMEA Workshop Training at Hughes rev3
Bob (ababs) Youssef FMEA Workshop Training at Hughes rev3Abbas (Bob) Youssef MBA, PhD
╠²
The document outlines an agenda for an FMEA training workshop. It discusses Failure Mode and Effects Analysis (FMEA), including its history, purpose, and process. FMEA is a methodology used to ensure potential problems are addressed in product and process development. The agenda includes explaining FMEA, its use as a design tool, the development process, management's role, team member responsibilities, and examples. It provides details on FMEA scope, functions, failure modes, effects, occurrence, detection, and criticality analysis. The workshop aims to train participants on effectively developing and applying FMEAs.DESIGN FMEA TRAINING FOR LITENS AUTOMOTIVE
DESIGN FMEA TRAINING FOR LITENS AUTOMOTIVE Julian Kalac P.Eng
╠²
This document outlines a training for Litens Automotive on Design Failure Mode and Effects Analysis (DFMEA). The training covers DFMEA basics, consequences of poorly performed DFMEAs, identifying single points of failure, using design of experiments to optimize designs, and reviewing DFMEA examples. It emphasizes that critical dimensions must be derived from the DFMEA and that DFMEAs are important legal documents that demonstrate due diligence in design and product safety.DFMEA: Reduce Design Errors, Time and Cost
DFMEA: Reduce Design Errors, Time and CostRicardo Gonzalez Luna
╠²
The document discusses the application of Design Failure Mode and Effects Analysis (DFMEA) to enhance prototype development and reduce design errors. It outlines key steps in DFMEA including function evaluation, identifying failure modes, severity assessment, and prioritizing risks to improve product reliability and performance. Additionally, it emphasizes the need for a strategic approach to design changes and testing to mitigate potential failures.How to implement an effective fmea process
How to implement an effective fmea processASQ Reliability Division
╠²
The document discusses implementing a successful Failure Mode and Effects Analysis (FMEA) process, outlining essential characteristics, strategic planning decisions, and the roles of management and facilitators. Key factors for an effective FMEA process include management support, resource planning, integration with business processes, and continuous improvement through quality audits and software support. It also highlights the importance of linking FMEAs with other key processes and leveraging lessons learned from past analyses.Similar to Mse June 24 2011 (20)
ßäēßģĄßå½ßäģßģ¼ßäÆßģĪßå» ßäēßģ« ßäŗßģĄßå╗ßäéßģ│ßå½ A/B ßäÉßģ”ßäēßģ│ßäÉßģ│ļź╝ ņ£äĒĢ┤ ņĢīņĢäņĢ╝ ĒĢĀ Ļ▓āļōż
ßäēßģĄßå½ßäģßģ¼ßäÆßģĪßå» ßäēßģ« ßäŗßģĄßå╗ßäéßģ│ßå½ A/B ßäÉßģ”ßäēßģ│ßäÉßģ│ļź╝ ņ£äĒĢ┤ ņĢīņĢäņĢ╝ ĒĢĀ Ļ▓āļōżMinho Lee
╠²
ņØ┤ ļ¼Ėņä£ļŖö A/B ĒģīņŖżĒŖĖņØś ņżæņÜöņä▒Ļ│╝ ņŗĀļó░ņä▒ņØä ĒÖĢļ│┤ĒĢśĻĖ░ ņ£äĒĢ£ ņÜöņåīļź╝ ņäżļ¬ģĒĢ®ļŗłļŗż. ņŗżĒŚś ņäżĻ│ä, ĻĘĖļŻ╣ ļéśļłäĻĖ░, ļŹ░ņØ┤Ēä░ ņłśņ¦æ ļ░Å Ļ▓░Ļ│╝ ļČäņäØ ļō▒ A/B ĒģīņŖżĒŖĖņØś Ļ░ü ļŗ©Ļ│äņŚÉņä£ Ļ│ĀļĀżĒĢ┤ņĢ╝ ĒĢĀ ņäĖļČĆ ņé¼ĒĢŁņØä ļŗżļŻ╣ļŗłļŗż. ļśÉĒĢ£, ĒåĄĻ│äņĀü ņ£ĀņØśņä▒ ļ░Å p-valueņØś ĒĢ┤ņäØ ļ░®ļ▓ĢņŚÉ ļīĆĒĢ┤ņä£ļÅä ļģ╝ņØśĒĢ®ļŗłļŗż.Lab 4 handout 043012
Lab 4 handout 043012Tim Arroyo
╠²
1) The document describes an experiment to analyze the effect of a single variable on a thin film process using analysis of variance (ANOVA).
2) It provides instructions on how to design a single-factor experiment, including choosing a factor, determining levels of the factor, controlling other variables, replicating experiments, randomizing the order, and analyzing results.
3) As an example, it describes an experiment investigating the effect of DC bias voltage on silicon dioxide etching, with three voltage levels and four replicates at each level. The data is analyzed using ANOVA calculations including sums of squares.Marketing Research.pdf
Marketing Research.pdfAkshat470463
╠²
Experimental research designs are considered the standard for research. They involve assigning one or more dependent variables to different treatments and observing the results to draw conclusions. Experimental research has both advantages and disadvantages. It allows full researcher control but can be resource-intensive. It aims to determine relationships between dependent and independent variables by supporting or rejecting hypotheses. Data must be quantifiable and include measurements of variables like area, weight, temperature etc. Qualitative observations also supplement the research. Overall, experimental research uses a scientific approach to test business matters and understand customer behavior through product testing and experiments.Bad metric, bad! - Joseph Ours
Bad metric, bad! - Joseph OursQA or the Highway
╠²
The document discusses various metrics used in software testing, including test case counts, defect counts, and automation progress, highlighting common pitfalls in measurement practices. It emphasizes the importance of linking metrics to organizational objectives and warns against relying solely on counts without context or actionable insights. Additionally, the document proposes exercises to illustrate challenges in measuring testing efforts and defect discovery.Bad metric, bad!
Bad metric, bad!Centric Consulting
╠²
The document discusses various software testing metrics, highlighting their significance in measuring test case execution, defect management, and overall testing efficiency. It emphasizes common challenges faced in measuring and interpreting these metrics, including inconsistencies and misalignments with organizational objectives. Additional insights are provided through practical exercises aimed at understanding the variability and reliability of testing metrics.Experimental design cartoon part 5 sample size
Experimental design cartoon part 5 sample sizeKevin Hamill
╠²
This document discusses sample size calculations in experimental design focused on hypothesis testing, emphasizing the importance of careful planning before experiments. It outlines steps for identifying variables and selecting appropriate statistical tests based on normality and type of data, such as chi-squared tests, t-tests, ANOVA, and regression analyses. The text also highlights the need for power analysis to ensure adequate sample sizes for robust conclusions, particularly in complex experimental situations.Lecture5 Applied Econometrics and Economic Modeling
Lecture5 Applied Econometrics and Economic Modelingstone55
╠²
The document discusses various statistical techniques for constructing confidence intervals from sample data. It provides examples of calculating 95% confidence intervals for a mean, proportion, difference between means, and difference between proportions. It also discusses how to determine the necessary sample size needed to achieve a given confidence interval length.Experimental designs and data analysis in the field of Agronomy science by ma...
Experimental designs and data analysis in the field of Agronomy science by ma...Manoj Sharma
╠²
This document discusses experimental design principles and methods for analyzing agricultural data using free online software. It describes the basic principles of randomization, replication, and local control in experimental design. It also outlines different trial types used in extension work like completely randomized design, randomized block design, repeated trials, and surveys. It provides an example of each trial type and describes how to analyze data from one-factor experiments using the OPSTAT online tool, including entering data, running analyses, and interpreting results like critical differences and regression. It recommends other online resources for learning basic statistics and analyzing survey data.Sample Size Determination
Sample Size DeterminationCentre for Social Initiative and Management
╠²
The document discusses the critical importance of sample size determination in both quantitative and qualitative research within the context of organizational behavior and human resources effectiveness. It highlights the process, challenges, and statistical principles involved in selecting an appropriate sample size to minimize sampling error, alongside considerations of alpha and beta errors. Additionally, it presents methodologies for calculating sample size based on various variables, illustrating the need for careful planning and analysis in research design.Predictive Analytics with UX Research Data: Yes We Can!
Predictive Analytics with UX Research Data: Yes We Can!UXPA Boston
╠²
This document discusses how predictive analytics techniques can be applied to user experience research data. It will provide examples using data from usability tests and surveys to demonstrate confidence intervals, correlation, simple linear regression, and stepwise regression. These predictive analytics methods can be applied not just to usability and survey data but also to data from other UX research methods like interviews and physiological testing. The presentation will focus on how confidence intervals are particularly important for understanding UX research findings given the small sample sizes typical of most usability studies.5. testing differences
5. testing differencesSteve Saffhill
╠²
This document introduces difference testing and parametric and non-parametric tests. It discusses the assumptions of parametric tests including random sampling, normally distributed interval/ratio data, and equal variances. Non-parametric tests like Wilcoxon and Mann-Whitney U are introduced as alternatives. Key principles of difference testing like independent vs dependent variables are explained. Steps for t-tests, paired t-tests, and non-parametric equivalents are outlined along with interpreting SPSS outputs and dealing with issues of significance. Factors like meaningful vs statistical significance and one-tailed vs two-tailed tests are also briefly covered.Analytical Essay - 6+ Examples, For. Online assignment writing service.
Analytical Essay - 6+ Examples, For. Online assignment writing service.Ginger Schiffli
╠²
The document provides instructions for requesting writing assistance from HelpWriting.net. It outlines a 5-step process: 1) Create an account with a password and email. 2) Complete a 10-minute order form providing instructions, sources, and deadline. 3) Review bids from writers and select one based on qualifications. 4) Review the completed paper and authorize payment if satisfied. 5) Request revisions to ensure satisfaction, and the company offers refunds for plagiarized work. The purpose is to outline the simple process for students to receive high-quality original writing assistance from the service.Two sample Test of hypothesis(1).pptx
Two sample Test of hypothesis(1).pptxMdMehediHasan803536
╠²
The document discusses hypothesis testing to compare two population means using samples from the populations. It provides assumptions and steps for the test, including stating hypotheses, selecting a significance level, determining a test statistic such as a z-score or t-statistic, formulating a decision rule, making a decision about the null hypothesis, and calculating a p-value. Several examples are provided to illustrate the process.The t Test for Related.docx
The t Test for Related.docxchristalgrieg
╠²
The document discusses the paired sample t-test, explaining its application in analyzing statistical anxiety among students before and after a class. It details the process of conducting the test using SPSS, interpreting descriptive statistics, and the significance of results indicating a reduction in anxiety levels post-test. The example illustrates the practical implications of the t-test in understanding students' comfort with statistics over time.Bad Metric, Bad!
Bad Metric, Bad!Joseph Ours, MBA, PMP
╠²
The document discusses challenges with typical metrics used in software testing. It notes that counts, percentages and trends used are often inaccurate and lack context. Metrics need to be tied to objectives and drive organizational change to be effective. Sampling approaches in testing need to approximate the actual quality, but randomness may not find as many defects as methodical testing. The presentation provides examples of nominal, ordinal, interval and ratio measures and recommends using the appropriate levels of measurement. It also addresses issues with deriving ratios from lower levels of data and challenges in measuring trends over time.Optimizely Workshop: Take Action on Results with Statistics
Optimizely Workshop: Take Action on Results with StatisticsOptimizely
╠²
The document covers an online workshop on A/B testing facilitated by Leonid Pekelis from Optimizely, focusing on using their stats engine to avoid pitfalls associated with classical statistics, such as peeking and misunderstanding false positive rates. Participants will learn how to effectively tune their experiments by understanding the tradeoffs between error rates, runtime, and effect size, as well as how to utilize Optimizely's results page. Key takeaways include the importance of adjusting timelines, accepting varying error rates, and refining experimentation goals.A/B Testing myths and quagmires
A/B Testing myths and quagmiresMarried2Growth
╠²
The document discusses common misconceptions about A/B testing in the context of SaaS companies, highlighting eight pitfalls to avoid for efficient testing. Key points include the importance of adequate sample sizes, the varying degrees of statistical confidence, and the need to ensure that tests are meaningful and contextually valid. Overall, the document emphasizes that testing should be strategic, focusing on significant changes that can lead to substantial gains.Education Management Corp PSY2060__05 Week 5 Lecture 1We
Education Management Corp PSY2060__05 Week 5 Lecture 1WeEvonCanales257
╠²
The document discusses correlational research, highlighting its ability to analyze relationships between multiple variables and determine their correlation coefficients, which range from -1 to 1. It uses the example of caffeine consumption and alertness to illustrate how such studies can predict outcomes but do not establish causation. The document also describes how to report findings from a correlational analysis and create visual representations using Microsoft Excel.Writing A Critical Analysis Of An Article. How To Write A
Writing A Critical Analysis Of An Article. How To Write AKimberly Jones
╠²
The document outlines a 5-step process for requesting and receiving writing assistance from HelpWriting.net, including registering for an account, completing an order form with instructions and deadline, reviewing bids from writers and selecting one, authorizing payment after reviewing the completed paper, and having the option to request revisions. The process aims to match clients with qualified writers based on bids and feedback to ensure high quality, original content that meets the client's needs and instructions.SPSS GuideAssessing Normality, Handling Missing Data, and Calculating Total S...
SPSS GuideAssessing Normality, Handling Missing Data, and Calculating Total S...ahmedragab433449
╠²
The document discusses the issue of missing data in research, explaining its types: missing completely at random (MCAR), missing at random (MAR), and missing not at random (MNAR), along with their implications for data analysis. It also outlines strategies for handling missing data, including listwise deletion, pairwise deletion, imputation methods, and assesses the importance of checking for normality in datasets, including graphical and statistical techniques for evaluation. Understanding these concepts aids in making informed decisions about statistical methods and the reliability of research findings.ßäēßģĄßå½ßäģßģ¼ßäÆßģĪßå» ßäēßģ« ßäŗßģĄßå╗ßäéßģ│ßå½ A/B ßäÉßģ”ßäēßģ│ßäÉßģ│ļź╝ ņ£äĒĢ┤ ņĢīņĢäņĢ╝ ĒĢĀ Ļ▓āļōż
ßäēßģĄßå½ßäģßģ¼ßäÆßģĪßå» ßäēßģ« ßäŗßģĄßå╗ßäéßģ│ßå½ A/B ßäÉßģ”ßäēßģ│ßäÉßģ│ļź╝ ņ£äĒĢ┤ ņĢīņĢäņĢ╝ ĒĢĀ Ļ▓āļōżMinho Lee
╠²
Ad
More from ExerciseLeanLLC (13)
El Llc Six Sigma June 2011
El Llc Six Sigma June 2011ExerciseLeanLLC
╠²
This document provides an overview of Six Sigma, including:
1) Six Sigma is a data-driven, customer-focused methodology for achieving breakthrough performance gains and validated bottom line results through reducing variation and defects in processes.
2) The Six Sigma methodology follows the DMAIC process of Define, Measure, Analyze, Improve, and Control.
3) An example roadmap is provided that outlines how to apply the Six Sigma DMAIC process to a project to achieve strategic business objectives.Lean Manufacturing Exam Questions Mar 2011
Lean Manufacturing Exam Questions Mar 2011ExerciseLeanLLC
╠²
The document appears to be a Lean Manufacturing exam that tests knowledge of key Lean concepts and tools through multiple choice and short answer questions. It covers topics like value stream mapping, takt time, 5S, mistake proofing, 8D problem solving, statistical process control, total productive maintenance, Kanban systems, and waste elimination. The exam is designed to evaluate understanding of Lean principles and their application across various manufacturing processes and environments.John F Petak Resume July 2011
John F Petak Resume July 2011ExerciseLeanLLC
╠²
This resume summarizes John Petak's experience in lean manufacturing and continuous improvement over 30 years. He has extensive experience deploying lean practices like value stream mapping, 5S, standard work, and kaizen events. As a consultant, he helped clients reduce lead times, improve quality and delivery, and increase productivity. His background includes positions managing operations and training employees in lean tools and principles.F119 Analysis Recommendations.Pptx [Autosaved]
F119 Analysis Recommendations.Pptx [Autosaved]ExerciseLeanLLC
╠²
This document summarizes an analysis of cell F119. It identifies four part numbers processed in the cell with travel times. It also lists some manufacturing processes occurring in the cell like lathe and mill. The document recommends reorganizing the cell layout to reduce travel times and balance work content. A rapid assessment was conducted on the cell over three days reviewing processes, defining value-added vs. non-value added work, and developing a future state map and new layout with an U-shape to reduce waste. An action plan was created to implement the changes.Lean Manufacturing Cost Cutting Methods
Lean Manufacturing Cost Cutting MethodsExerciseLeanLLC
╠²
This document is a training module on lean manufacturing cost cutting methods developed by the National Council of Small and Medium Sized Private Enterprises of Romania. The module contains three chapters that discuss methods for gathering and analyzing data to cut costs, methods of cutting costs by reorganizing production processes, and implementing improvements. It provides examples and case studies throughout. The overall aim is to introduce lean concepts and tools to help manufacturers identify waste, increase productivity, and reduce production costs.Mse
MseExerciseLeanLLC
╠²
The document summarizes the results of a study comparing the means and variations of measurements from techniques T1, T2, and a master technique M. It finds that while T2's mean is not significantly different from M, its variation is; and while T1's variation is not significantly different from M, its mean is. It questions whether the study used 10 samples each measured 3 times by 3 technicians, whether it was randomized and crossed or nested, and whether results would be similar if rerun with the master technique.Kan Ban & Standardize Work Overview Feb 2011
Kan Ban & Standardize Work Overview Feb 2011ExerciseLeanLLC
╠²
Operator:
Workstation:
Cycle time:
Number of parts:
Standardized work sequence:
1. Take the panel from the conveyor
2. Check the panel for defects
3. Place the panel on the work table
4. Apply sealant on the panel
5. Place the reinforcement on the panel
6. Apply sealant on the reinforcement
7. Place the cover on the reinforcement
8. Check the assembly
9. Place the assembled panel on the conveyor
10. Clean the work area
11. Self inspection
Standardized work chart FAU-F-PS-5006 /1Gas Nozzle Team Report Out January 31 2008
Gas Nozzle Team Report Out January 31 2008ExerciseLeanLLC
╠²
The document outlines the agenda for a four-day value stream mapping workshop held by GTE to improve their process for manufacturing outer gas nozzles. The workshop covered lean manufacturing principles and tools including value stream mapping, identifying waste, standardizing work, and pull production systems. Participants mapped the current and future states of the process, identified value-added vs. non-value added steps, and updated cycle time diagrams to reflect planned improvements.5 Why Training ║▌║▌▀Żs Oct 14, 2009
5 Why Training ║▌║▌▀Żs Oct 14, 2009ExerciseLeanLLC
╠²
The document provides an agenda and overview for a training on systematic problem solving using tools like 5 Whys. The agenda covers introductions, an exercise on defining problems, an introduction to 5 Whys technique, team exercises applying the techniques, and a wrap up. The training will teach participants how to use 5 Whys to peel back the layers of a problem to identify the root cause by repeatedly asking "Why?". Identifying the root cause allows for preventing future recurrence of the problem.Tpm Presentation
Tpm PresentationExerciseLeanLLC
╠²
The document discusses Total Productive Maintenance (TPM). TPM aims to increase efficiency and productivity through more employee involvement and responsibility for equipment. It outlines 8 basics of TPM, including continuous improvement, planning, autonomous maintenance, and eliminating losses. TPM is implemented in 7 steps starting with initial cleaning and establishing standards for machines. Visual management is also discussed as an important part of TPM.Exercise Lean Feb 27 2010
Exercise Lean Feb 27 2010ExerciseLeanLLC
╠²
This document discusses how an organization ensures their exercise lean professionals operate hands-on at the "gemba" or place where work is done. They rely on value stream maps developed by teams to identify the eight forms of waste and set priorities. They empower leaders to solve problems using standardized tools and ensure team ownership and sustainable results.Work Content Feb 18 2010
Work Content Feb 18 2010ExerciseLeanLLC
╠²
The document discusses work content and cycle time diagrams. Work content is the sum of basic tasks performed at each workstation to complete a product. It uses an example where the minimum cycle times for three jobs total 120 seconds. A cycle time diagram graphs the cycle times for each operation, bringing out variations in cycle times and imbalance among operators. It can compare the cycle times to the takt time.Hoshin Presentation Example June 7 2010
Hoshin Presentation Example June 7 2010ExerciseLeanLLC
╠²
1. The document provides an overview of lean principles and tools for analyzing and improving manufacturing processes, including value stream mapping, identification of waste, and standardizing work.
2. Key lean concepts discussed include takt time, kaizen, gemba, muda, poka yoke, and one-piece flow. Standard lean tools like the 5 whys, A3 problem solving, and PDCA cycles are also referenced.
3. The document contains an agenda for presenting lean concepts and tools to a group, including sections on hoshin planning, work content analysis, operator balancing, and layout optimization.Ad
Mse June 24 2011
- 1. Six Sigma Six Sigma: DMAIC; Y=f(x) Is it a Goal, a Measure, a Process, a Tool or an expletive deleted? ’ĆĖ D efine M easure A nalyze I mprove C ontrol
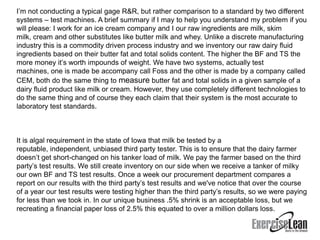
- 2. IŌĆÖm not conducting a typical gage R&R, but rather comparison to a standard by two different systems ŌĆō test machines. A brief summary if I may to help you understand my problem if you will please: I work for an ice cream company and I our raw ingredients are milk, skim milk, cream and other substitutes like butter milk and whey. Unlike a discrete manufacturing industry this is a commodity driven process industry and we inventory our raw dairy fluid ingredients based on their butter fat and total solids content. The higher the BF and TS the more money itŌĆÖs worth impounds of weight. We have two systems, actually test machines, one is made be accompany call Foss and the other is made by a company called CEM, both do the same thing to measure butter fat and total solids in a given sample of a dairy fluid product like milk or cream. However, they use completely different technologies to do the same thing and of course they each claim that their system is the most accurate to laboratory test standards. It is algal requirement in the state of Iowa that milk be tested by a reputable, independent, unbiased third party tester. This is to ensure that the dairy farmer doesnŌĆÖt get short-changed on his tanker load of milk. We pay the farmer based on the third partyŌĆÖs test results. We still create inventory on our side when we receive a tanker of milky our own BF and TS test results. Once a week our procurement department compares a report on our results with the third partyŌĆÖs test results and we've notice that over the course of a year our test results were testing higher than the third partyŌĆÖs results, so we were paying for less than we took in. In our unique business .5% shrink is an acceptable loss, but we recreating a financial paper loss of 2.5% this equated to over a million dollars loss.
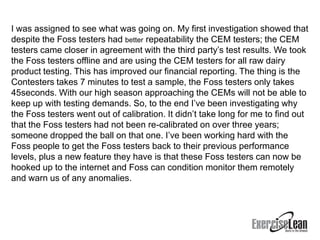
- 3. I was assigned to see what was going on. My first investigation showed that despite the Foss testers had better repeatability the CEM testers; the CEM testers came closer in agreement with the third partyŌĆÖs test results. We took the Foss testers offline and are using the CEM testers for all raw dairy product testing. This has improved our financial reporting. The thing is the Contesters takes 7 minutes to test a sample, the Foss testers only takes 45seconds. With our high season approaching the CEMs will not be able to keep up with testing demands. So, to the end IŌĆÖve been investigating why the Foss testers went out of calibration. It didnŌĆÖt take long for me to find out that the Foss testers had not been re-calibrated on over three years; someone dropped the ball on that one. IŌĆÖve been working hard with the Foss people to get the Foss testers back to their previous performance levels, plus a new feature they have is that these Foss testers can now be hooked up to the internet and Foss can condition monitor them remotely and warn us of any anomalies.
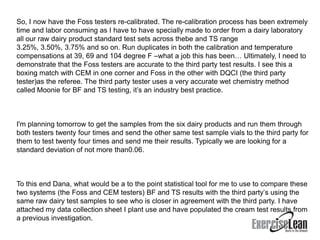
- 4. So, I now have the Foss testers re-calibrated. The re-calibration process has been extremely time and labor consuming as I have to have specially made to order from a dairy laboratory all our raw dairy product standard test sets across thebe and TS range 3.25%, 3.50%, 3.75% and so on. Run duplicates in both the calibration and temperature compensations at 39, 69 and 104 degree F ŌĆōwhat a job this has beenŌĆ” Ultimately, I need to demonstrate that the Foss testers are accurate to the third party test results. I see this a boxing match with CEM in one corner and Foss in the other with DQCI (the third party tester)as the referee. The third party tester uses a very accurate wet chemistry method called Moonie for BF and TS testing, itŌĆÖs an industry best practice. I'm planning tomorrow to get the samples from the six dairy products and run them through both testers twenty four times and send the other same test sample vials to the third party for them to test twenty four times and send me their results. Typically we are looking for a standard deviation of not more than0.06. To this end Dana, what would be a to the point statistical tool for me to use to compare these two systems (the Foss and CEM testers) BF and TS results with the third partyŌĆÖs using the same raw dairy test samples to see who is closer in agreement with the third party. I have attached my data collection sheet I plant use and have populated the cream test results from a previous investigation.
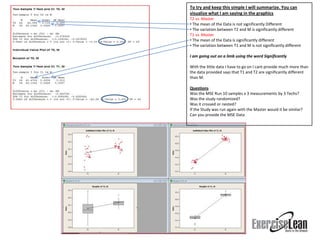
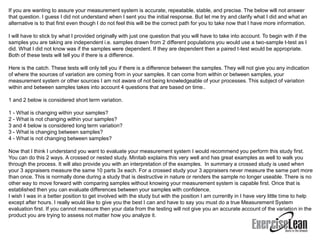
- 5. To try and keep this simple I will summarize. You can visualize what I am saying in the graphics T2 vs. Master ŌĆó The mean of the Data is not significantly Different ŌĆó The variation between T2 and M is significantly different T1 vs. Master ŌĆó The mean of the Data is significantly different ŌĆó The variation between T1 and M is not significantly different I am going out on a limb using the word Significantly With the little data I have to go on I cant provide much more than the data provided says that T1 and T2 are significantly different than M. Questions Was the MSE Run 10 samples x 3 measurements by 3 Techs? Was the study randomized? Was it crossed or nested? If the Study was run again with the Master would it be similar? Can you provide the MSE Data
- 6. If you are wanting to assure your measurement system is accurate, repeatable, stable, and precise. The below will not answer that question. I guess I did not understand when I sent you the initial response. But let me try and clarify what I did and what an alternative is to that first even though I do not feel this will be the correct path for you to take now that I have more information. I will have to stick by what I provided originally with just one question that you will have to take into account. To begin with if the samples you are taking are independent i.e. samples drawn from 2 different populations you would use a two-sample t-test as I did. What I did not know was if the samples were dependent. If they are dependent then a paired t-test would be appropriate. Both of these tests will tell you if there is a difference. Here is the catch. These tests will only tell you if there is a difference between the samples. They will not give you any indication of where the sources of variation are coming from in your samples. It can come from within or between samples, your measurement system or other sources I am not aware of not being knowledgeable of your processes. This subject of variation within and between samples takes into account 4 questions that are based on time.. 1 and 2 below is considered short term variation. 1 - What is changing within your samples? 2 - What is not changing within your samples? 3 and 4 below is considered long term variation? 3 - What is changing between samples? 4 - What is not changing between samples? Now that I think I understand you want to evaluate your measurement system I would recommend you perform this study first. You can do this 2 ways. A crossed or nested study. Minitab explains this very well and has great examples as well to walk you through the process. It will also provide you with an interpretation of the examples. In summary a crossed study is used when your 3 appraisers measure the same 10 parts 3x each. For a crossed study your 3 appraisers never measure the same part more than once. This is normally done during a study that is destructive in nature or renders the sample no longer useable. There is no other way to move forward with comparing samples without knowing your measurement system is capable first. Once that is established then you can evaluate differences between your samples with confidence. I wish I was in a better position to get involved with the study but with the position I am currently in I have very little time to help except after hours. I really would like to give you the best I can and have to say you must do a true Measurement System evaluation first. If you cannot measure then your data from the testing will not give you an accurate account of the variation in the product you are trying to assess not matter how you analyze it.