![[??????????????????]openstack_monitoring_session](https://image.slidesharecdn.com/openmon-180315100420/85/openstack_monitoring_session-1-320.jpg)


[??????????????????]openstack_monitoring_session
- 3. Contents 1. Openstack monitoring ?? 2. Openstack Monitoring Architecture 3. ELASTIC stack 4. Zabbix 5. Grafana 6. DEMO
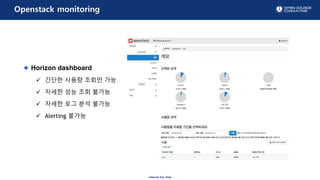
- 4. - Internal Use Only - Openstack monitoring Horizon dashboard ? ??? ??? ??? ?? ? ??? ?? ?? ??? ? ??? ?? ?? ??? ? Alerting ???
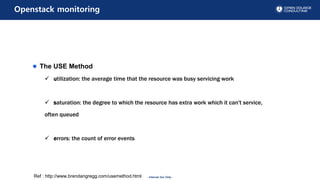
- 5. - Internal Use Only - Openstack monitoring The USE Method ? utilization: the average time that the resource was busy servicing work ? saturation: the degree to which the resource has extra work which it can't service, often queued ? errors: the count of error events Ref : http://www.brendangregg.com/usemethod.html
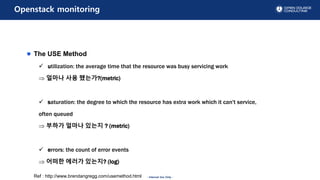
- 6. - Internal Use Only - Openstack monitoring The USE Method ? utilization: the average time that the resource was busy servicing work ? ??? ?? ????(metric) ? saturation: the degree to which the resource has extra work which it can't service, often queued ? ??? ??? ??? ? (metric) ? errors: the count of error events ? ??? ??? ???? (log) Ref : http://www.brendangregg.com/usemethod.html
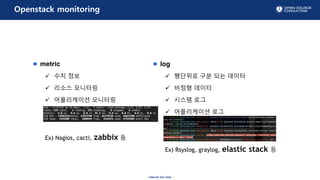
- 7. - Internal Use Only - Openstack monitoring metric ? ?? ?? ? ??? ???? ? ?????? ???? Ex) Nagios, cacti, zabbix ? log ? ???? ?? ?? ??? ? ??? ??? ? ??? ?? ? ?????? ?? Ex) Rsyslog, graylog, elastic stack ?
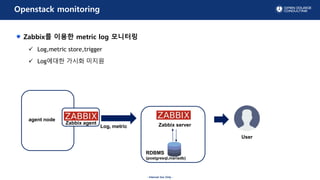
- 8. - Internal Use Only - Openstack monitoring RDBMS (postgresql,mariadb) Zabbix serverZabbix agent Log, metric User agent node Zabbix? ??? metric log ???? ? Log,metric store,trigger ? Log??? ??? ???
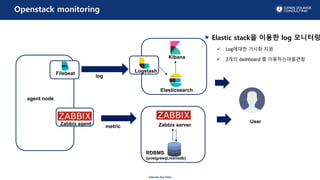
- 9. - Internal Use Only - Openstack monitoring RDBMS (postgresql,mariadb) Zabbix serverZabbix agent metric User agent node Elastic stack? ??? log ???? ? Log??? ??? ?? ? 2?? dashboard ? ???????? Elasticsearch Filebeat Logstash log Kibana
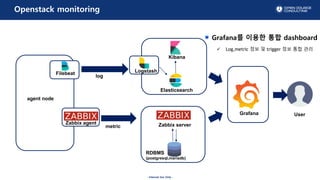
- 10. - Internal Use Only - Openstack monitoring RDBMS (postgresql,mariadb) Zabbix serverZabbix agent metric User agent node Grafana? ??? ?? dashboard ? Log,metric ?? ? trigger ?? ?? ?? Elasticsearch Filebeat Logstash log Kibana Grafana
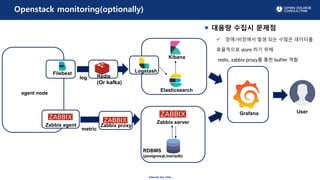
- 11. - Internal Use Only - Openstack monitoring(optionally) Kibana Elasticsearch Grafana Zabbix server Zabbix agent Filebeat Logstash log metric User agent node Zabbix proxy Redis (Or kafka) RDBMS (postgresql,mariadb) ??? ??? ??? ? ??/???? ?? ?? ??? ???? ????? store ?? ?? redis, zabbix proxy? ?? buffer ??
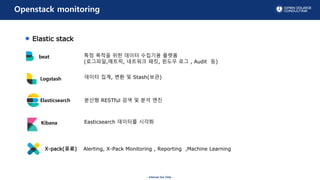
- 12. - Internal Use Only - Openstack monitoring Kibana Elasticsearch beat Logstash ??? RESTful ?? ? ?? ?? Easticsearch ???? ??? ??? ??, ?? ? Stash(??) ?? ??? ?? ??? ???? ??? (????,???, ???? ??, ??? ?? , Audit ?) Alerting, X-Pack Monitoring , Reporting ,Machine LearningX-pack(??) Elastic stack
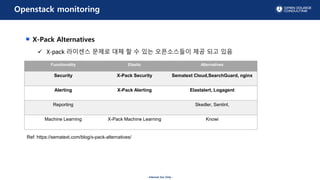
- 13. - Internal Use Only - Openstack monitoring Functionality Elastic Alternatives Security X-Pack Security Sematext Cloud,SearchGuard, nginx Alerting X-Pack Alerting Elastalert, Logagent Reporting Skedler, Sentinl, Machine Learning X-Pack Machine Learning Knowi Ref: https://sematext.com/blog/x-pack-alternatives/ X-Pack Alternatives ? X-pack ???? ??? ?? ? ? ?? ?????? ?? ?? ??
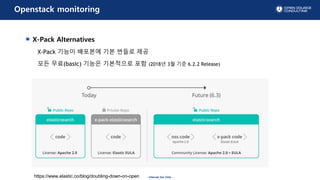
- 14. - Internal Use Only - Openstack monitoring X-Pack Alternatives X-Pack ??? ???? ?? ??? ?? ?? ??(basic) ??? ????? ?? (2018? 3? ?? 6.2.2 Release) https://www.elastic.co/blog/doubling-down-on-open
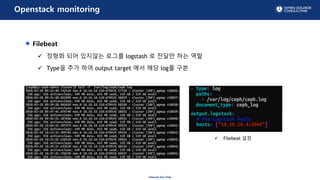
- 15. - Internal Use Only - Openstack monitoring Filebeat ? ??? ?? ???? ??? logstash ? ??? ?? ?? ? Type? ?? ?? output target ?? ?? log? ?? ? Filebeat ??
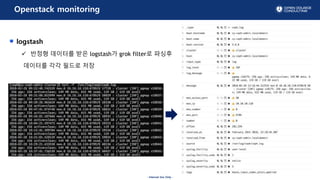
- 16. - Internal Use Only - Openstack monitoring logstash ? ??? ???? ?? logstash? grok filter? ??? ???? ?? ??? ??
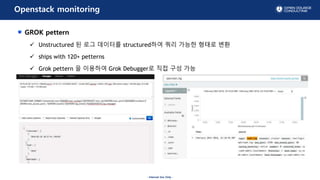
- 17. - Internal Use Only - Openstack monitoring GROK pettern ? Unstructured ? ?? ???? structured?? ?? ??? ??? ?? ? ships with 120+ petterns ? Grok pettern ? ???? Grok Debugger? ?? ?? ??
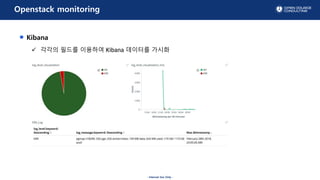
- 18. - Internal Use Only - Openstack monitoring Kibana ? ??? ??? ???? Kibana ???? ???
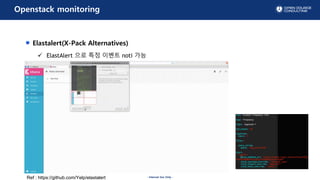
- 19. - Internal Use Only - Openstack monitoring Elastalert(X-Pack Alternatives) ? ElastAlert ?? ?? ??? noti ?? Ref : https://github.com/Yelp/elastalert
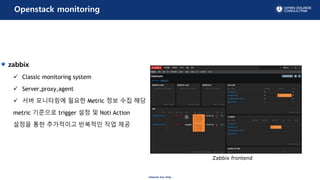
- 20. - Internal Use Only - Openstack monitoring zabbix ? Classic monitoring system ? Server,proxy,agent ? ?? ????? ??? Metric ?? ?? ?? metric ???? trigger ?? ? Noti Action ??? ?? ????? ???? ?? ?? Zabbix frontend
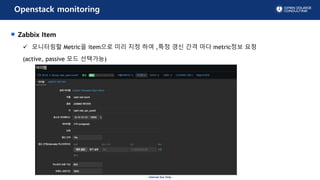
- 21. - Internal Use Only - Openstack monitoring Zabbix Item ? ????? Metric? item?? ?? ?? ?? ,?? ?? ?? ?? metric?? ?? (active, passive ?? ????)
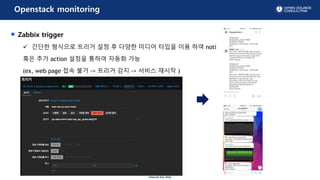
- 22. - Internal Use Only - Openstack monitoring Zabbix trigger ? ??? ???? ??? ?? ? ??? ??? ??? ?? ?? noti ?? ?? action ??? ??? ??? ?? (ex, web page ?? ?? -> ??? ?? -> ??? ??? )
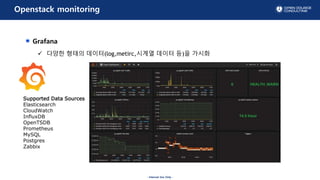
- 23. - Internal Use Only - Openstack monitoring Supported Data Sources Elasticsearch CloudWatch InfluxDB OpenTSDB Prometheus MySQL Postgres Zabbix Grafana ? ??? ??? ???(log,metirc,??? ??? ?)? ???
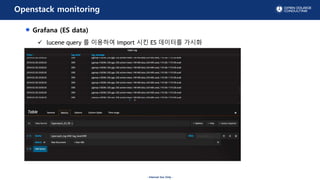
- 24. - Internal Use Only - Openstack monitoring Grafana Grafana (ES data) ? lucene query ? ???? import ?? ES ???? ???
- 25. - Internal Use Only - Openstack monitoring Grafana (zabbix data) ? Zabbix metric ??? query ??? ???
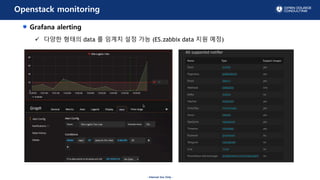
- 26. - Internal Use Only - Openstack monitoring Grafana alerting ? ??? ??? data ? ??? ?? ?? (ES.zabbix data ?? ??)
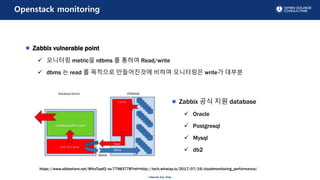
- 27. - Internal Use Only - Openstack monitoring Zabbix vulnerable point ? ???? metric? rdbms ? ??? Read/write ? dbms ? read ? ???? ?????? ??? ????? write? ??? /WhaTapIO/ss-77983778?ref=http://tech.whatap.io/2017/07/19/cloudmonitoring_performance/ Zabbix ?? ?? database ? Oracle ? Postgresql ? Mysql ? db2
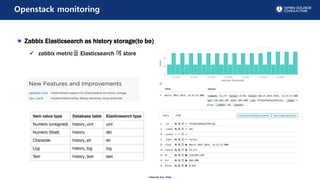
- 28. - Internal Use Only - Openstack monitoring Zabbix Elasticsearch as history storage(to be) ? zabbix metric? Elasticsearch ? store
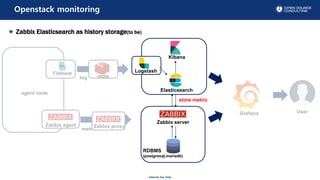
- 29. - Internal Use Only - Openstack monitoring Kibana Elasticsearch Grafana Zabbix server Zabbix agent Filebeat Logstash log metric User agent node Zabbix proxy redis RDBMS (postgresql,mariadb) store metric Zabbix Elasticsearch as history storage(to be)
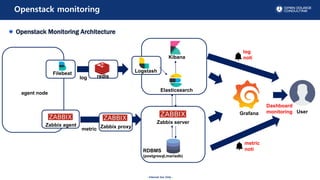
- 30. - Internal Use Only - Openstack monitoring Kibana Elasticsearch Grafana Zabbix server Zabbix agent Filebeat Logstash log metric User agent node Zabbix proxy redis RDBMS (postgresql,mariadb) Openstack Monitoring Architecture Dashboard monitoring metric noti log noti
- 31. - Internal Use Only - DEMO Ceph osd down ??? grafana , trigger??
- 32. - Internal Use Only - DEMO Error log ??? ?? grafana ? elastalert
- 33. Thank you.
Editor's Notes
- #5: ?? ???? ??? ????? ???? ?? ???? ????? ?? ?? ???? ???? ???? ????? ??? ??? ?? ???. ? ????? ??? ?? ??? ?? ???? ????, ?? ??? ?? ?? ???? ??? ?? ????. ??? ??? ??? ?? ??? ??? ??? ?? ?? ??? ??? ?? ???? cli ???? ?? ??? ?? ?? ???. ?? ??? ??? ???? ????? ??? ????? ??? ?? ? ? ?? ??? , ?? ??? ?? ?? ????????? ??? ?? ???. ??? ??? ????? ?????? ??? ??? ?? ????? ?? ???. ??? ??? ???? ??? ???? ?? ?? ?? ??? ????.
- #6: ????? ???? ?? ??? ?? use method ? ????. Utilization ?? ?? ?? ? saturation ??? ?? ?? ???, ??? ??? ??? ???
- #7: ?? ??? ??? ?? utilization ? ??? ??? ?? ??? ??, saturation ??? ??? ??? ??? ?? ??? ??? ???
- #12: Redis ???? ??? ???? ?? ?? ? ??? ???? ??? ? ? ??
- #22: ???:?? -> ???? -> ?? ???: ???? -> ?? ???? zabbix_agentd.conf? Server? ?? ??? ???? ?? ??? ???? ?? ??? ??? ?? 1???? 1???? ???? ????? ??? ?? ?? ???? ??? ????? ??? ??? ??