Performance Measurement & Reporting System
Download as pptx, pdf1 like734 views
The Performance Measurement and Reporting System (PMRS) is a tool to help healthcare organizations achieve strategic goals through standardized performance measurement and reporting. It provides customizable dashboards and charts with drill-down capabilities. PMRS has a centralized data repository, allows single-click production of reports, and supports organizational governance through role-based access and attribution of metrics. Future releases will add enhanced analytics and attribution models to help organizations scale the system over time.
1 of 11
Download to read offline
Ad
Recommended
CARA for GxP Quality documents
CARA for GxP Quality documentsGeneris
╠²
The document outlines the features and functionalities of the Cara quality management system, designed for managing SOP and GXP documentation, including document creation, review, approval, and publishing. It emphasizes user configurability, integration with LMS systems, and offers tools for document tracking, dynamic security, and reporting. Additionally, it provides a timeline for deployment and optional extras for customization.Business Intelligence
Business IntelligenceSharePoint Saturday New Jersey
╠²
The document discusses various business intelligence tools in Microsoft including scorecards, KPIs, dashboards, and reports. It provides descriptions and examples of each tool as well as how they can be used to measure performance, visualize data, and make informed business decisions. Links are also included for additional resources on Microsoft BI architectures, capabilities of Excel Services, SharePoint, and SQL Server for building BI solutions.AX 2012 Functional Track - Steven Hermans
AX 2012 Functional Track - Steven Hermansdynamicscom
╠²
Microsoft Dynamics AX2012 provides a powerful yet simple user experience. It introduces many powerful new innovations while maintaining a focus on simplicity. The application is powerful when it enables users to realize their full potential efficiently. Simplicity is achieved through reducing unnecessary attributes. The new release features a role-tailored navigation, more powerful list pages, simplified detail forms, improved setup forms, and richer interactive reports.Measurement and Reporting for Performance (building a culture that counts)
Measurement and Reporting for Performance (building a culture that counts)Lipman Hearne Inc.
╠²
The document discusses the importance of measurement and reporting in nonprofit marketing, emphasizing the need to track personal and organizational performance using data. It covers practical scenarios for mobile application development in healthcare and higher education, along with strategies for optimizing user engagement and campaign effectiveness. The document outlines key performance indicators, measurement processes, and dashboarding considerations to enhance overall marketing effectiveness.B2B Marketing Communications Plan (template) v2
B2B Marketing Communications Plan (template) v2Scott Armstrong
╠²
This B2B marketing communications plan outlines objectives, target customer profiles and segments, a customer decision stages model, content engagement planning, communications strategy, marketing program budget, and performance measurement sections. The plan provides guidance on developing targeted content for different customer segments at various decision stages, as well as strategies and budgets for marketing communications across multiple channels.Performance measurement
Performance measurementaisha khan
╠²
This document discusses performance measurement and compensation. It defines performance measurement as collecting, analyzing, and reporting information on an individual's, group's, organization's, or system's performance. There are three approaches to performance measurement: trait, behavior, and results. Executive evaluation is defined as planning and reviewing senior management performance to maintain goal alignment and determine future training needs. The document also discusses different types of compensation like direct/indirect pay, skill-based pay, broad-banding, team-based pay, variable compensation, and executive compensation.Project performance tracking analysis and reporting
Project performance tracking analysis and reportingCharles Cotter, PhD
╠²
This document outlines a training program on project performance tracking, analysis, and reporting presented by Supreme Management Consultants. The two-day program will cover key topics such as performance indicators, developing and analyzing project objectives, benchmarking, measuring and monitoring performance, reporting, research methods, baselines, and information management systems. Fundamental concepts like defining projects, performance management, the project management triple constraint, life cycle, and performance cycle will also be discussed. Techniques like earned value management, control charts, and post-project evaluation will be examined.Visual guidance for power bi toronto pbi tour (1)
Visual guidance for power bi toronto pbi tour (1)Berkovich Consulting
╠²
This document provides guidance on designing effective visualizations in Power BI reports. It discusses choosing visualizations based on the business question being answered and audience. UI/UX best practices like minimizing clutter, using consistent formatting and intuitive navigation are covered. Different visual types like maps, timelines and slicers are explained. Custom visuals that add new functionality are also summarized. The document stresses the importance of clear, simple designs that provide insights at a glance to support business decisions.Qualtrics Introduction Presentation
Qualtrics Introduction Presentationzevoman
╠²
This document provides an overview of Qualtrics and its research suite capabilities. It summarizes that Qualtrics offers a full suite of tools for survey creation, distribution, analysis, and reporting. It allows users to generate professional reports and analysis from survey data, customize surveys and reports, manage panels, and more through an integrated online platform.Business analytics and data visualisation
Business analytics and data visualisationShwetabh Jaiswal
╠²
Business analytics uses data, statistical analysis, and other quantitative techniques to help understand and optimize business performance. It is becoming a major tool used by many large corporations. There are various tools and techniques for business analytics, including online analytical processing (OLAP), data visualization, data mining, predictive analysis, and geographic information systems (GIS). Real-time business intelligence and automated decision support are also increasingly important for analytics.Analytics plus overview.pptx
Analytics plus overview.pptxFanky Christian
╠²
ManageEngine Analytics Plus is a self-service business intelligence software designed for advanced analytics and real-time IT management, supporting data analysis with powerful visualizations. It integrates seamlessly with ServiceDesk Plus, allowing users to create custom reports, dashboards, and utilize auto-analysis features without complex SQL queries. Additionally, it offers an intuitive interface for data synchronization from various sources, easy export options, and supports collaboration within organizations.IPSA Mapping Software CoolMaps®
IPSA Mapping Software CoolMaps®Robert_Cone
╠²
Coolmaps is a proprietary visual process and mapping software designed to manage change and document control specifically for financial institutions. It integrates multiple tools for process mapping, risk identification, document management, and project communication to enhance operational control and navigate complex processes effectively. The software offers hierarchical organization, customizable templates, and various licensing options, allowing users to tailor solutions to their unique needs.The Rise of Self -service Business Intelligence
The Rise of Self -service Business Intelligenceskewdlogix
╠²
The document discusses the evolution and objectives of self-service business intelligence (BI), highlighting its impact on analytics technology and organizational agility. It emphasizes the need for a balance between governance and user empowerment, outlining various tools and success factors for implementing self-service BI. Challenges such as data silos and governance issues are also noted, alongside a reference architecture for managing information supply chains.MicroStrategy - Effective Business Dashboards
MicroStrategy - Effective Business DashboardsMicroStrategy Nederland
╠²
There are four categories of business dashboards that provide different benefits:
1. Traditional performance summary dashboards present summary information and alerts in tables and graphs.
2. Traditional metrics dashboards display metrics and compare actual to goals to track progress toward goals.
3. Dynamic content dashboards allow interactive analysis and embed workflows to assist decision making.
4. Dynamic visualization dashboards display more data using advanced visualizations to improve decision making.
Effective dashboards mirror the user's workflow, allow drilling into data, and can be shared and used offline.Interactive Dashboards
Interactive DashboardsDr Rupert Booth
╠²
Interactive dashboards allow for more user interaction than simple dashboards through features like navigation, drill-down capabilities, filtering, and different display formats. They are useful for handling large volumes of data and providing insights not obvious before. Effective dashboards are designed based on use cases, group data logically, avoid overload, and consider reporting and decision-making cycles. A case study demonstrated a national project monitoring dashboard that standardized data feeds and had an intuitive interface for different user groups. Choosing the right platform depends on desired features like mobile access, social integration, and traditional or free-form analysis. Dashboards have applications in real estate, transportation, facilities management, and smart cities.Leverage BI to Manage Operational Risk
Leverage BI to Manage Operational Riskwww.panorama.com
╠²
The document discusses leveraging business intelligence (BI) to enhance enterprise visibility into various types of risk, including market, credit, and operational risks. It highlights key lessons from the financial crisis, emphasizing the importance of effective risk communication and management strategies, and outlines how BI applications can support data analysis, risk reporting, and decision-making. Additionally, it showcases the capabilities of Panorama's BI solutions, which offer intuitive reporting, visualization, and real-time insights to help organizations manage risks proactively.Analysis vs reporting
Analysis vs reportingRajashree Thirupathi
╠²
Reporting involves users selecting predefined reports to view results in standardized formats like tables and graphs. Reports are inflexible and generated without human involvement beyond the initial request. Analysis provides answers to specific questions through a customized and flexible process that involves a person guiding the analysis. Both reporting and analysis are needed to succeed with big data.Analysis vs reporting
Analysis vs reportingRajashree Thirupathi
╠²
Reporting involves users selecting predefined reports to view results in standardized formats like tables and graphs. No person is involved beyond the user requesting the report. Reports have limited flexibility.
Analysis provides answers to specific questions by taking any necessary steps through a guided process. It is customized and flexible to the questions being addressed.
Modern data analytics tools use statistical modeling approaches like probability, sampling, inference, and machine learning algorithms like neural networks and support vector machines to gain insights from data.Dynamic DSM Tracking Software Features
Dynamic DSM Tracking Software FeaturesDynamic DSM
╠²
Accent Gold Solutions, founded in 2002, offers Dynamic DSM, an energy efficiency program management tool built on Microsoft Dynamics CRM, enabling comprehensive tracking and multi-client program management. The platform supports various features including email tracking, customizable dashboards, and robust security measures for managing complex data access across multiple programs and utilities. With easy deployment, built-in reporting capabilities, and role-based forms, Dynamic DSM is designed to streamline operations and enhance user experience for its over 800 clients.Building Rich Dashboards with IBM Business Insight
Building Rich Dashboards with IBM Business InsightDataClarity Corporation
╠²
The document details a web seminar on IBM Cognos Business Insight, covering its features such as interactive dashboards, a new user interface, and collaborative capabilities. It also highlights the integration with advanced reporting tools and recent improvements in version 10.1.1. Additionally, information about upcoming related seminars and training opportunities is provided.Business Analytics Implementation
Business Analytics ImplementationFrank Luong PMP,MBA
╠²
This document provides an overview of business analytics and the Power BI suite of tools for business intelligence. It defines business analytics as developing insights and understanding of business performance based on data analysis. Power BI is introduced as a free tool for data analytics that allows users to connect to various data sources, transform raw data, create visualizations and reports, and build dashboards. Key aspects of the Power BI service, desktop, and mobile apps are described, including sign-up processes, advantages, and filtering capabilities.MC01 - Maintenance Connection 101
MC01 - Maintenance Connection 101 Maintenance Connection
╠²
The document outlines the content and logistics of a webinar titled 'Maintenance Connection 101,' focused on training users on the Maintenance Connection platform. It includes information about logging in, navigating the interface, accessing applications, and available help resources. The session also features a summary of features and tools essential for users, preparing them for future training opportunities.01 part 1_case_study
01 part 1_case_studyAnurag Rajandekar
╠²
This document outlines questions that should be asked to understand a client's business needs and reporting requirements, such as who the report is for, what data models and formats should be used, and how users will be trained. It also provides details on selected high-level features for an interactive reporting system, including interactive graphs, filters, previous data comparison, KPI details, and export options. Next steps are defined like release planning, task creation, testing, and user demos.Building-Interactive-Dashboards-in-Tableau
Building-Interactive-Dashboards-in-TableauAugmented Systems
╠²
Learn to create dynamic, interactive dashboards in Tableau with this easy step-by-step guideŌĆöperfect for beginners and data enthusiasts alike.EX_AM PSP
EX_AM PSPGiuseppe Verde
╠²
EX-AM Portal is a single application designed to help awarding bodies manage the entire examination process, from question creation to results, in one central location. It allows users to store questions, create question papers, carry out marking allocation, standardization, and moderation. The portal provides key features like user profile management, assessor capacity management, paper allocation management, and integrated reporting. It aims to increase efficiency by decreasing duplication of work across spreadsheets and emails.MDM & BI Strategy For Large Enterprises
MDM & BI Strategy For Large EnterprisesMark Schoeppel
╠²
The document outlines a comprehensive strategy for Master Data Management (MDM) and Business Intelligence (BI), emphasizing the importance of governance, data management practices, and the roles of various stakeholders. It presents a structured approach to improving data accuracy, facilitating innovation, and establishing clear accountability within data governance processes. Additionally, it details a 180-day plan for implementing effective data governance, technology integration, and the alignment of business processes to enhance data utility across the enterprise.ke-6.pptxjhgjhg jgjgjgug bububuiyybibiu
ke-6.pptxjhgjhg jgjgjgug bububuiyybibiuAhmadNaswin
╠²
The document outlines a comprehensive framework for designing and executing data dashboards tailored to various stakeholder needs, emphasizing the importance of meaningful data and analytics. It details a four-step methodology for creating effective dashboards, which include understanding user requirements, identifying key performance indicators (KPIs), and ensuring data integration from multiple sources. Additionally, it discusses different types of dashboards (strategic, tactical, analytical) and platform selection criteria to ensure optimal functionality and user engagement.Datagrinch product experience
Datagrinch product experienceSandeep Supal
╠²
The document discusses ideas for improving the DataGrinch product. It outlines current and future modules including project manager, data manager, report manager, and survey manager. Ideas are provided for additional features in each module like importing/exporting data, customized dashboards, and enhanced data filtering and analysis capabilities. The document also provides user experience and interface recommendations to improve navigation, notifications, inline editing and personalization. Open questions are raised about additional functionality and potential platform extensions.Impact Of a Clinical Decision Support Tool on Asthma Patients with Current As...
Impact Of a Clinical Decision Support Tool on Asthma Patients with Current As...Yiscah Bracha
╠²
The document summarizes research on the effect of computerized decision support (CDS) on the percentage of asthma patients with asthma action plans. The research found:
1) Implementation of a CDS tool at clinics led to increases in the percentage of pediatric patients with current asthma action plans, especially at clinics that previously lacked paper templates.
2) For adults, clinics that emphasized asthma action plans and had physicians start using the CDS tool saw increases, while clinics without paper templates saw physicians begin using the tool.
3) Statistical analysis showed the CDS tool had an initial positive effect at one pediatric clinic that oscillated over time, while having no significant effect at other clinics, possibly due to pre-existing tendencies of physicians toEpic As Platform For Clinical Decision Support. Implications For Qi And Resea...
Epic As Platform For Clinical Decision Support. Implications For Qi And Resea...Yiscah Bracha
╠²
1. The document discusses alternatives to current models of integrating electronic decision support tools with electronic health records like Epic.
2. It proposes a model where decision support applications are provided through external applets launched via hyperlinks from the EHR, with the applets saving data to their own databases.
3. This approach aims to avoid the challenges of building and maintaining complex decision support directly within the EHR interface while still using EHR data and integrating population data.More Related Content
Similar to Performance Measurement & Reporting System (20)
Qualtrics Introduction Presentation
Qualtrics Introduction Presentationzevoman
╠²
This document provides an overview of Qualtrics and its research suite capabilities. It summarizes that Qualtrics offers a full suite of tools for survey creation, distribution, analysis, and reporting. It allows users to generate professional reports and analysis from survey data, customize surveys and reports, manage panels, and more through an integrated online platform.Business analytics and data visualisation
Business analytics and data visualisationShwetabh Jaiswal
╠²
Business analytics uses data, statistical analysis, and other quantitative techniques to help understand and optimize business performance. It is becoming a major tool used by many large corporations. There are various tools and techniques for business analytics, including online analytical processing (OLAP), data visualization, data mining, predictive analysis, and geographic information systems (GIS). Real-time business intelligence and automated decision support are also increasingly important for analytics.Analytics plus overview.pptx
Analytics plus overview.pptxFanky Christian
╠²
ManageEngine Analytics Plus is a self-service business intelligence software designed for advanced analytics and real-time IT management, supporting data analysis with powerful visualizations. It integrates seamlessly with ServiceDesk Plus, allowing users to create custom reports, dashboards, and utilize auto-analysis features without complex SQL queries. Additionally, it offers an intuitive interface for data synchronization from various sources, easy export options, and supports collaboration within organizations.IPSA Mapping Software CoolMaps®
IPSA Mapping Software CoolMaps®Robert_Cone
╠²
Coolmaps is a proprietary visual process and mapping software designed to manage change and document control specifically for financial institutions. It integrates multiple tools for process mapping, risk identification, document management, and project communication to enhance operational control and navigate complex processes effectively. The software offers hierarchical organization, customizable templates, and various licensing options, allowing users to tailor solutions to their unique needs.The Rise of Self -service Business Intelligence
The Rise of Self -service Business Intelligenceskewdlogix
╠²
The document discusses the evolution and objectives of self-service business intelligence (BI), highlighting its impact on analytics technology and organizational agility. It emphasizes the need for a balance between governance and user empowerment, outlining various tools and success factors for implementing self-service BI. Challenges such as data silos and governance issues are also noted, alongside a reference architecture for managing information supply chains.MicroStrategy - Effective Business Dashboards
MicroStrategy - Effective Business DashboardsMicroStrategy Nederland
╠²
There are four categories of business dashboards that provide different benefits:
1. Traditional performance summary dashboards present summary information and alerts in tables and graphs.
2. Traditional metrics dashboards display metrics and compare actual to goals to track progress toward goals.
3. Dynamic content dashboards allow interactive analysis and embed workflows to assist decision making.
4. Dynamic visualization dashboards display more data using advanced visualizations to improve decision making.
Effective dashboards mirror the user's workflow, allow drilling into data, and can be shared and used offline.Interactive Dashboards
Interactive DashboardsDr Rupert Booth
╠²
Interactive dashboards allow for more user interaction than simple dashboards through features like navigation, drill-down capabilities, filtering, and different display formats. They are useful for handling large volumes of data and providing insights not obvious before. Effective dashboards are designed based on use cases, group data logically, avoid overload, and consider reporting and decision-making cycles. A case study demonstrated a national project monitoring dashboard that standardized data feeds and had an intuitive interface for different user groups. Choosing the right platform depends on desired features like mobile access, social integration, and traditional or free-form analysis. Dashboards have applications in real estate, transportation, facilities management, and smart cities.Leverage BI to Manage Operational Risk
Leverage BI to Manage Operational Riskwww.panorama.com
╠²
The document discusses leveraging business intelligence (BI) to enhance enterprise visibility into various types of risk, including market, credit, and operational risks. It highlights key lessons from the financial crisis, emphasizing the importance of effective risk communication and management strategies, and outlines how BI applications can support data analysis, risk reporting, and decision-making. Additionally, it showcases the capabilities of Panorama's BI solutions, which offer intuitive reporting, visualization, and real-time insights to help organizations manage risks proactively.Analysis vs reporting
Analysis vs reportingRajashree Thirupathi
╠²
Reporting involves users selecting predefined reports to view results in standardized formats like tables and graphs. Reports are inflexible and generated without human involvement beyond the initial request. Analysis provides answers to specific questions through a customized and flexible process that involves a person guiding the analysis. Both reporting and analysis are needed to succeed with big data.Analysis vs reporting
Analysis vs reportingRajashree Thirupathi
╠²
Reporting involves users selecting predefined reports to view results in standardized formats like tables and graphs. No person is involved beyond the user requesting the report. Reports have limited flexibility.
Analysis provides answers to specific questions by taking any necessary steps through a guided process. It is customized and flexible to the questions being addressed.
Modern data analytics tools use statistical modeling approaches like probability, sampling, inference, and machine learning algorithms like neural networks and support vector machines to gain insights from data.Dynamic DSM Tracking Software Features
Dynamic DSM Tracking Software FeaturesDynamic DSM
╠²
Accent Gold Solutions, founded in 2002, offers Dynamic DSM, an energy efficiency program management tool built on Microsoft Dynamics CRM, enabling comprehensive tracking and multi-client program management. The platform supports various features including email tracking, customizable dashboards, and robust security measures for managing complex data access across multiple programs and utilities. With easy deployment, built-in reporting capabilities, and role-based forms, Dynamic DSM is designed to streamline operations and enhance user experience for its over 800 clients.Building Rich Dashboards with IBM Business Insight
Building Rich Dashboards with IBM Business InsightDataClarity Corporation
╠²
The document details a web seminar on IBM Cognos Business Insight, covering its features such as interactive dashboards, a new user interface, and collaborative capabilities. It also highlights the integration with advanced reporting tools and recent improvements in version 10.1.1. Additionally, information about upcoming related seminars and training opportunities is provided.Business Analytics Implementation
Business Analytics ImplementationFrank Luong PMP,MBA
╠²
This document provides an overview of business analytics and the Power BI suite of tools for business intelligence. It defines business analytics as developing insights and understanding of business performance based on data analysis. Power BI is introduced as a free tool for data analytics that allows users to connect to various data sources, transform raw data, create visualizations and reports, and build dashboards. Key aspects of the Power BI service, desktop, and mobile apps are described, including sign-up processes, advantages, and filtering capabilities.MC01 - Maintenance Connection 101
MC01 - Maintenance Connection 101 Maintenance Connection
╠²
The document outlines the content and logistics of a webinar titled 'Maintenance Connection 101,' focused on training users on the Maintenance Connection platform. It includes information about logging in, navigating the interface, accessing applications, and available help resources. The session also features a summary of features and tools essential for users, preparing them for future training opportunities.01 part 1_case_study
01 part 1_case_studyAnurag Rajandekar
╠²
This document outlines questions that should be asked to understand a client's business needs and reporting requirements, such as who the report is for, what data models and formats should be used, and how users will be trained. It also provides details on selected high-level features for an interactive reporting system, including interactive graphs, filters, previous data comparison, KPI details, and export options. Next steps are defined like release planning, task creation, testing, and user demos.Building-Interactive-Dashboards-in-Tableau
Building-Interactive-Dashboards-in-TableauAugmented Systems
╠²
Learn to create dynamic, interactive dashboards in Tableau with this easy step-by-step guideŌĆöperfect for beginners and data enthusiasts alike.EX_AM PSP
EX_AM PSPGiuseppe Verde
╠²
EX-AM Portal is a single application designed to help awarding bodies manage the entire examination process, from question creation to results, in one central location. It allows users to store questions, create question papers, carry out marking allocation, standardization, and moderation. The portal provides key features like user profile management, assessor capacity management, paper allocation management, and integrated reporting. It aims to increase efficiency by decreasing duplication of work across spreadsheets and emails.MDM & BI Strategy For Large Enterprises
MDM & BI Strategy For Large EnterprisesMark Schoeppel
╠²
The document outlines a comprehensive strategy for Master Data Management (MDM) and Business Intelligence (BI), emphasizing the importance of governance, data management practices, and the roles of various stakeholders. It presents a structured approach to improving data accuracy, facilitating innovation, and establishing clear accountability within data governance processes. Additionally, it details a 180-day plan for implementing effective data governance, technology integration, and the alignment of business processes to enhance data utility across the enterprise.ke-6.pptxjhgjhg jgjgjgug bububuiyybibiu
ke-6.pptxjhgjhg jgjgjgug bububuiyybibiuAhmadNaswin
╠²
The document outlines a comprehensive framework for designing and executing data dashboards tailored to various stakeholder needs, emphasizing the importance of meaningful data and analytics. It details a four-step methodology for creating effective dashboards, which include understanding user requirements, identifying key performance indicators (KPIs), and ensuring data integration from multiple sources. Additionally, it discusses different types of dashboards (strategic, tactical, analytical) and platform selection criteria to ensure optimal functionality and user engagement.Datagrinch product experience
Datagrinch product experienceSandeep Supal
╠²
The document discusses ideas for improving the DataGrinch product. It outlines current and future modules including project manager, data manager, report manager, and survey manager. Ideas are provided for additional features in each module like importing/exporting data, customized dashboards, and enhanced data filtering and analysis capabilities. The document also provides user experience and interface recommendations to improve navigation, notifications, inline editing and personalization. Open questions are raised about additional functionality and potential platform extensions.More from Yiscah Bracha (11)
Impact Of a Clinical Decision Support Tool on Asthma Patients with Current As...
Impact Of a Clinical Decision Support Tool on Asthma Patients with Current As...Yiscah Bracha
╠²
The document summarizes research on the effect of computerized decision support (CDS) on the percentage of asthma patients with asthma action plans. The research found:
1) Implementation of a CDS tool at clinics led to increases in the percentage of pediatric patients with current asthma action plans, especially at clinics that previously lacked paper templates.
2) For adults, clinics that emphasized asthma action plans and had physicians start using the CDS tool saw increases, while clinics without paper templates saw physicians begin using the tool.
3) Statistical analysis showed the CDS tool had an initial positive effect at one pediatric clinic that oscillated over time, while having no significant effect at other clinics, possibly due to pre-existing tendencies of physicians toEpic As Platform For Clinical Decision Support. Implications For Qi And Resea...
Epic As Platform For Clinical Decision Support. Implications For Qi And Resea...Yiscah Bracha
╠²
1. The document discusses alternatives to current models of integrating electronic decision support tools with electronic health records like Epic.
2. It proposes a model where decision support applications are provided through external applets launched via hyperlinks from the EHR, with the applets saving data to their own databases.
3. This approach aims to avoid the challenges of building and maintaining complex decision support directly within the EHR interface while still using EHR data and integrating population data.Bringing Clinical Guidelines to the Point of Care with HIT
Bringing Clinical Guidelines to the Point of Care with HITYiscah Bracha
╠²
The document discusses the challenges of integrating evidence-based clinical guidelines into medical practice, highlighting issues such as information overload and limited resources for implementation. It proposes the use of health information technology (HIT) solutions, including electronic decision support tools and intelligent design, to enhance adherence to guidelines. The conclusions emphasize that while HIT can facilitate guideline-based care, it does not fully address the underlying resource constraints and contested assumptions surrounding the use of guidelines.HIT Asthma: A Tale of Woe and Enlightenment
HIT Asthma: A Tale of Woe and EnlightenmentYiscah Bracha
╠²
The project aimed to enhance ambulatory asthma care by integrating an interactive asthma action plan (IAAP) with an electronic health record (EHR) system. Challenges included updating the IAAP to align with new guidelines and communicating clinical needs to software developers, compounded by inconsistencies in those guidelines. Despite efforts, significant issues arose related to clarity, usability, and software comprehension, leading to ongoing struggles in effective implementation.Do Ask, Do Tell.
Do Ask, Do Tell.Yiscah Bracha
╠²
The document discusses different methods for querying patients about their race and ethnicity in a respectful and effective way. It tested various question orderings and response options at a hospital. Asking about Hispanic ethnicity first and then race with OMB categories worked best for US-born patients and Hispanic patients. An open-ended question about ethnicity worked better for foreign-born non-Hispanic patients. The document proposes a two-question method asking first how others perceive the patient's race and second how they self-identify.Reasons for Disparities in Health and HealthCare
Reasons for Disparities in Health and HealthCareYiscah Bracha
╠²
This document discusses population health disparities in the United States. It defines disparity and discusses how populations are differentiated by factors like race, ethnicity, income level, and geographic area. It provides examples of population health measures and measures of access to care. Research shows that low-income and minority populations in the US have lower measures of health, access to care, and quality of medical care. The document discusses various social, cultural, environmental, healthcare, and individual reasons for these disparities and outlines upstream, midstream, and downstream interventions to address them.Race and Ethnicity Data During Different Workflows
Race and Ethnicity Data During Different WorkflowsYiscah Bracha
╠²
This document discusses obtaining patient social identity data during clinical workflows in a respectful and efficient manner. It considers who should ask patients for this information, when it should be requested during a clinical encounter, and what system constraints like electronic records affect these decisions. Issues addressed include training staff to collect this data, reviewing data quality, and ensuring data obtained can be extracted and transformed to meet reporting requirements while respecting patients.Querying Patients About Race and Ethnicity
Querying Patients About Race and EthnicityYiscah Bracha
╠²
The presentation discusses the necessity of collecting patient race and ethnicity data at Hennepin County Medical Center to address disparities in medical care. Various methods for querying patients about race were tested, emphasizing the importance of making patients comfortable while also ensuring accurate responses. Outcomes indicated that asking about race first is often more effective, though discomfort among staff and patients remains a challenge to consistent data collection.03. Quality Measurement and Report: Implications for Disparities
03. Quality Measurement and Report: Implications for DisparitiesYiscah Bracha
╠²
The presentation discusses the use of quality measurement and reporting (QM&R) to address health disparities in Minnesota, emphasizing the state's demographic changes and the need to improve care for marginalized populations. It explores various strategies to implement QM&R, including developing relevant measures, stratifying reports, and structuring evaluations to favor high-performing providers serving disadvantaged patients. Key conclusions highlight that while Minnesota has a quality problem, the existing QM&R framework can be leveraged to target and reduce health disparities effectively.Querying Patients About Race and Ethnicity
Querying Patients About Race and EthnicityYiscah Bracha
╠²
The Minnesota Cancer Summit discusses methods for querying patients about race and ethnicity at Hennepin County Medical Center, aiming to improve demographic data collection while ensuring respectful and efficient methods. The document highlights challenges in balancing detailed data requirements with patient comfort and response rates, providing insights from various experimental methods tested at the facility. Ultimately, it emphasizes the need for a standardized approach that accommodates both researcher and patient needs, proposing the implementation of a method that captures essential demographic information while minimizing patient confusion.Medicare's Reimbursement System for Devices
Medicare's Reimbursement System for DevicesYiscah Bracha
╠²
The document discusses Medicare's complex reimbursement system and how it impacts medical device manufacturers, hospitals, physicians, and patients. It analyzes how the system encourages manufacturers to lobby for special coding and payments that increase costs rather than competing on price and effectiveness. Simplifying the coding system and basing payments on diagnosis rather than procedure could help reduce costs and encourage competition that benefits patients.Ad
Performance Measurement & Reporting System
- 1. Performance Measurement and Reporting System (PMRS) Helping Healthcare Delivery Systems Achieve Strategic Goals May, 2012
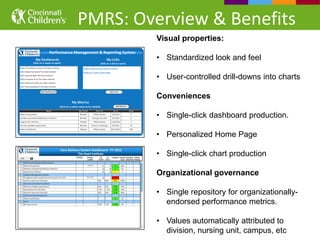
- 2. PMRS: Overview & Benefits Visual properties: ŌĆó Standardized look and feel ŌĆó User-controlled drill-downs into charts Conveniences ŌĆó Single-click dashboard production. ŌĆó Personalized Home Page ŌĆó Single-click chart production Organizational governance ŌĆó Single repository for organizationally- endorsed performance metrics. ŌĆó Values automatically attributed to division, nursing unit, campus, etc
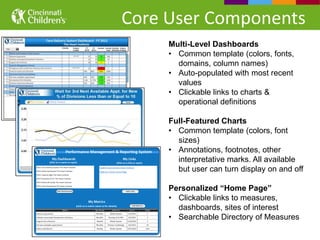
- 3. Core User Components Multi-Level Dashboards ŌĆó Common template (colors, fonts, domains, column names) ŌĆó Auto-populated with most recent values ŌĆó Clickable links to charts & operational definitions Full-Featured Charts ŌĆó Common template (colors, font sizes) ŌĆó Annotations, footnotes, other interpretative marks. All available but user can turn display on and off Personalized ŌĆ£Home PageŌĆØ ŌĆó Clickable links to measures, dashboards, sites of interest ŌĆó Searchable Directory of Measures
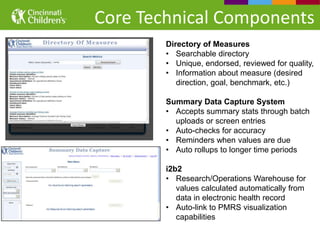
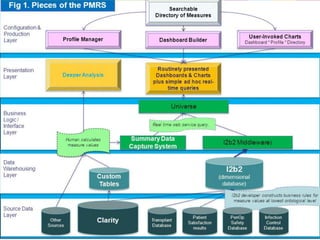
- 4. Core Technical Components Directory of Measures ŌĆó Searchable directory ŌĆó Unique, endorsed, reviewed for quality, ŌĆó Information about measure (desired direction, goal, benchmark, etc.) Summary Data Capture System ŌĆó Accepts summary stats through batch uploads or screen entries ŌĆó Auto-checks for accuracy ŌĆó Reminders when values are due ŌĆó Auto rollups to longer time periods i2b2 ŌĆó Research/Operations Warehouse for values calculated automatically from data in electronic health record ŌĆó Auto-link to PMRS visualization capabilities
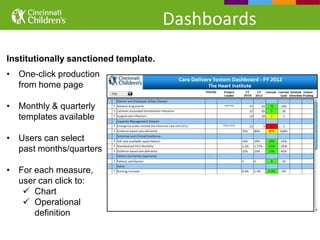
- 5. Dashboards Institutionally sanctioned template. ŌĆó One-click production from home page ŌĆó Monthly & quarterly templates available ŌĆó Users can select past months/quarters ŌĆó For each measure, user can click to: ’ā╝ Chart ’ā╝ Operational definition
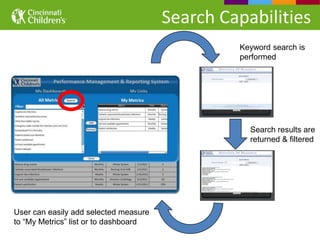
- 6. Search Capabilities Keyword search is performed Search results are returned & filtered User can easily add selected measure to ŌĆ£My MetricsŌĆØ list or to dashboard
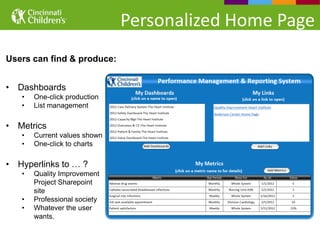
- 7. Personalized Home Page Users can find & produce: ŌĆó Dashboards ŌĆó One-click production ŌĆó List management ŌĆó Metrics ŌĆó Current values shown ŌĆó One-click to charts ŌĆó Hyperlinks to ŌĆ” ? ŌĆó Quality Improvement Project Sharepoint site ŌĆó Professional society ŌĆó Whatever the user wants.
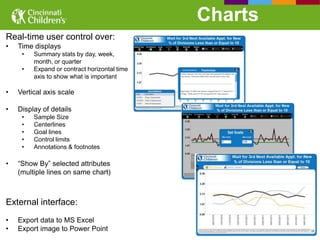
- 8. Charts Real-time user control over: ŌĆó Time displays ŌĆó Summary stats by day, week, month, or quarter ŌĆó Expand or contract horizontal time axis to show what is important ŌĆó Vertical axis scale ŌĆó Display of details ŌĆó Sample Size ŌĆó Centerlines ŌĆó Goal lines ŌĆó Control limits ŌĆó Annotations & footnotes ŌĆó ŌĆ£Show ByŌĆØ selected attributes (multiple lines on same chart) External interface: ŌĆó Export data to MS Excel ŌĆó Export image to Power Point
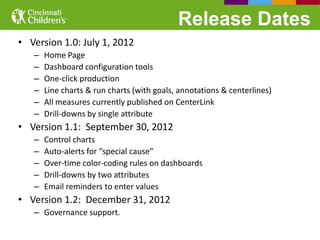
- 9. Release Dates ŌĆó Version 1.0: July 1, 2012 ŌĆō Home Page ŌĆō Dashboard configuration tools ŌĆō One-click production ŌĆō Line charts & run charts (with goals, annotations & centerlines) ŌĆō All measures currently published on CenterLink ŌĆō Drill-downs by single attribute ŌĆó Version 1.1: September 30, 2012 ŌĆō Control charts ŌĆō Auto-alerts for ŌĆ£special causeŌĆØ ŌĆō Over-time color-coding rules on dashboards ŌĆō Drill-downs by two attributes ŌĆō Email reminders to enter values ŌĆó Version 1.2: December 31, 2012 ŌĆō Governance support.
- 10. Open Issues ŌĆó Attribution models ŌĆó Managing growth ŌĆō Requests for new measures in Directory ŌĆō standards ŌĆō Reconciling multiple measures across organization ŌĆó Managing expectations ŌĆó Institutionalization ŌĆō Annual operating budgets for management & upgrades ŌĆō New staff roles
- 11. A JOINT PROJECT BY: Anderson Center for Health Systems Excellence Information Services Biomedical Informatics Cardinal Consulting For Additional Information, Contact: Yiscah Bracha, PhD Assistant Vice President Data & Analytics Yiscah.Bracha@cchmc.org