際際滷

際際滷Share a Scribd company logo
ARRAY
2    7    8    11   15

16   18   19   19   19

23   23   24   26   27

29   33   40   44   47

49   51   54   63   68
SIMPLE TABLE
   DISTRIBUTION OF AGES OF DCDMBS
              STUDENTS
Age of student   Frequency   Relative frequency
     19             14            0.0350
     20             23            0.0575
     21            134            0.3350
     22            149            0.3725
     23             71            0.1775
     24             9             0.0225
   TOTAL           400            1.0000
COMPOUND TABLE
                COURSE


           BA   B Com    B Sc

R   Pass   37     25     33
E
S   Supp   5      10      4
U
L
    Fail   11     8      27
T
SINGLE LINE GRAPH
                                Line graph for ages of students

                     160
Number of students


                     140
                     120
                     100
                     80
                     60
                     40
                     20
                      0
                           19       20       21         22        23   24

                                                  Age
MULTIPLE LINE GRAPH
                            Multiple line graph for age distribution at academic
                                                 institutions

                     160

                     140
Number of students


                     120

                     100                                                           UoM
                     80                                                            DCDMBS
                     60                                                            UTM

                     40

                     20

                      0
                           19      20       21         22     23       24

                                                 Age
SIMPLE PIE CHART
Distribution of students enrolled for BA, B Com and B Sc


                                                BA
                                 33%
                                                B Com
        40%
                                                B Sc


                         27%
ENHANCED PIE CHART
 Distribution of students enrolled for BA, B Com and B Sc


                                                 BA
                                   33%
      40%                                        B Com

                                                 B Sc


                          27%
SIMPLE BAR CHART
                           Simple bar chart for age distribution of students

                     160
                     140
Number of students


                     120
                     100
                     80
                     60
                     40
                     20
                      0
                               19       20        21         22     23         24

                                                       Age
MULTIPLE BAR CHART
               Multiple bar chart showing the results for BA, B Com and B Sc

          40
          35
          30

          25
Results


                                                                               Pass
          20                                                                   Supp
          15                                                                   Fail

          10
          5
          0
                     BA                   B Com                   B Sc

                                        Courses
COMPONENT BAR CHART
               Component bar chart showing the results for each course

          70
          60
          50
                                                                         Fail
Results


          40
                                                                         Supp
          30
                                                                         Pass
          20
          10
          0
                    BA                 B Com                B Sc

                                      Courses
PERCENTAGE BAR CHART
            Percentage bar chart showing the results for each course

          100%
           90%
           80%
           70%
                                                                       Fail
Results


           60%
           50%                                                         Supp
           40%
           30%                                                         Pass
           20%
           10%
            0%
                      BA               B Com             B Sc

                                     Courses
HISTOGRAM
                                     (EQUAL CELL WIDTH)
                                                       Histogram for grouped data
                                45

                                40
Number of workers (frequency)


                                35

                                30

                                25

                                20

                                15

                                10

                                5

                                0
                                     [20.5,   [25.5,     [30.5,      [35.5,    [40.5,     [45.5,   [50.5,   [55.5,
                                     25.5)    30.5)      35.5)       40.5)     45.5)      50.5)    55.5)    60.5)
                                                                  Age group of w orkers
HISTOGRAM
                    (UNEQUAL CELL WIDTHS)
                              Histogram (unequal class intervals) using frequency density

                    1.6
                    1.4

                    1.2
Frequency density


                     1
                    0.8
                    0.6
                    0.4
                    0.2
                     0
                          0                 20               40               60            80
                                             Temparature (degrees Fahrenheit)
FREQUENCY POLYGON
              (USING HISTOGRAM)
                   Histogram and frequency polygon for grouped data
                  18

                  16

                  14

                  12
Frequency


                  10

                  8

                  6

                  4

                  2

                  0
            -10        0   10       20     30     40     50        60   70   80

                                Temperature (degrees Fahrenheit)
FREQUENCY POLYGON
                                          Frequency polygon for grouped data


                                 45
Number of students (frequency)


                                 40
                                 35
                                 30
                                 25
                                 20
                                 15
                                 10
                                 5
                                 0
                                      20.5    25.5    30.5     35.5    40.5    45.5    50.5    55.5 
                                       25.5     30.5     35.5      40.5     45.5     50.5     55.5     60.5
                                                                 Age of students
CUMULATIVE FREQUENCY
  (LESS THAN OGIVE)
                       'Less than' cumulative frequency curve for age

                 160

                 140

                 120
'Less than' CF


                 100

                 80

                 60

                 40

                 20

                  0
                       20.5   25.5   30.5     35.5   40.5   45.5      50.5   55.5   60.5

                                            Age (upper real limits)
CUMULATIVE FREQUENCY
      (MORE THAN OGIVE)
                       'More than' cumulative frequency ogive for age

                 160
                 140
                 120
'More than' CF


                 100
                 80
                 60
                 40
                 20
                  0
                       20.5   25.5   30.5      35.5   40.5   45.5     50.5   55.5   60.5

                                            Age (lower real limits)
STEM-AND-LEAF PLOT
Stem    Leaf                            Stem   Leaf


   1    7   9                              1   7   9
   2    2                                  2   2
   3    8   9                              3   8   9
   4    5   7 4                            4   4   5 7
   5    3   4 5 4 1 4                      5   1   3 4 4 4 5
   6    6   5                              6   5   6
   7    6   5 2                            7   2   5 6
   8    4                                  8   4


                   Key   1|7 means 17
STEM-AND-LEAF PLOT
             (BACK-TO-BACK)
 Key (French)        French         English           Key (English)
8|5 means 58                                          6|3 means 63
                        2   1   3   8
                  7 6 5 4   4   4   3   4   4
                8 8 7 3 3   0   5   2   8   6
                    9 6 1   1   6   3   5   5 8 9
                        8   5   7   1   2   2 7 9 9
                            1   8   4   5
BOX-AND-WHISKERS PLOT


O
    10   20   30   40   50   60   70   80   90   100

                                            Number of marks
BOX-AND-WHISKERS PLOT
         (COMPARISON)


                                                 French


                                                 English


O
    10   20   30   40   50   60   70   80   90   100
                                            Number of marks
SCATTER PLOT
               Scatterplot of length of metal rod at various temperatures

         6.1
          6
         5.9
         5.8
         5.7
Length


         5.6
         5.5
         5.4
         5.3
         5.2
         5.1
          5
               0     10     20     30     40     50     60     70      80   90

                                        Temperature
TIME-SERIES HISTORIGRAM
                          Time series for annual sales of petrol

              1000
              900
              800
              700
 Sales ($m)


              600
              500
              400
              300
              200
              100
                0
                     85   86   87   88   89   90   91   92   93    94   95   96

                                               Year
LORENZ CURVE
                                   Lorenz curve for the distribution of taxpayers


                          1

                         0.9
                                              Line of uniform
                         0.8                    distribution
Proportion of tax paid


                         0.7

                         0.6

                         0.5

                         0.4

                         0.3

                         0.2

                         0.1

                          0
                               0        0.2            0.4        0.6          0.8   1

                                                 Proportion of taxpayers
Z-CHART

More Related Content

Recently uploaded (20)

TLE 7 - 2nd Topic - Codes and Standards in Industrial Arts Services.pptx
TLE 7 - 2nd Topic - Codes and Standards in Industrial Arts Services.pptxTLE 7 - 2nd Topic - Codes and Standards in Industrial Arts Services.pptx
TLE 7 - 2nd Topic - Codes and Standards in Industrial Arts Services.pptx
RizaBedayo
How to Configure Flexible Working Schedule in Odoo 18 Employee
How to Configure Flexible Working Schedule in Odoo 18 EmployeeHow to Configure Flexible Working Schedule in Odoo 18 Employee
How to Configure Flexible Working Schedule in Odoo 18 Employee
Celine George
Useful environment methods in Odoo 18 - Odoo 際際滷s
Useful environment methods in Odoo 18 - Odoo 際際滷sUseful environment methods in Odoo 18 - Odoo 際際滷s
Useful environment methods in Odoo 18 - Odoo 際際滷s
Celine George
The Broccoli Dog's inner voice (look A)
The Broccoli Dog's inner voice  (look A)The Broccoli Dog's inner voice  (look A)
The Broccoli Dog's inner voice (look A)
merasan
EDL 290F Week 3 - Mountaintop Views (2025).pdf
EDL 290F Week 3  - Mountaintop Views (2025).pdfEDL 290F Week 3  - Mountaintop Views (2025).pdf
EDL 290F Week 3 - Mountaintop Views (2025).pdf
Liz Walsh-Trevino
Modeling-Simple-Equation-Using-Bar-Models.pptx
Modeling-Simple-Equation-Using-Bar-Models.pptxModeling-Simple-Equation-Using-Bar-Models.pptx
Modeling-Simple-Equation-Using-Bar-Models.pptx
maribethlacno2
Rass MELAI : an Internet MELA Quiz Prelims - El Dorado 2025
Rass MELAI : an Internet MELA Quiz Prelims - El Dorado 2025Rass MELAI : an Internet MELA Quiz Prelims - El Dorado 2025
Rass MELAI : an Internet MELA Quiz Prelims - El Dorado 2025
Conquiztadors- the Quiz Society of Sri Venkateswara College
A PPT on the First Three chapters of Wings of Fire
A PPT on the First Three chapters of Wings of FireA PPT on the First Three chapters of Wings of Fire
A PPT on the First Three chapters of Wings of Fire
Beena E S
Computer Application in Business (commerce)
Computer Application in Business (commerce)Computer Application in Business (commerce)
Computer Application in Business (commerce)
Sudar Sudar
POWERPOINT-PRESENTATION_DM-NO.017-S.2025.pptx
POWERPOINT-PRESENTATION_DM-NO.017-S.2025.pptxPOWERPOINT-PRESENTATION_DM-NO.017-S.2025.pptx
POWERPOINT-PRESENTATION_DM-NO.017-S.2025.pptx
MarilenQuintoSimbula
Database population in Odoo 18 - Odoo slides
Database population in Odoo 18 - Odoo slidesDatabase population in Odoo 18 - Odoo slides
Database population in Odoo 18 - Odoo slides
Celine George
Essentials of a Good PMO, presented by Aalok Sonawala
Essentials of a Good PMO, presented by Aalok SonawalaEssentials of a Good PMO, presented by Aalok Sonawala
Essentials of a Good PMO, presented by Aalok Sonawala
Association for Project Management
DUBLIN PROGRAM DUBLIN PROGRAM DUBLIN PROGRAM
DUBLIN PROGRAM DUBLIN PROGRAM DUBLIN PROGRAMDUBLIN PROGRAM DUBLIN PROGRAM DUBLIN PROGRAM
DUBLIN PROGRAM DUBLIN PROGRAM DUBLIN PROGRAM
vlckovar
TRANSFER OF PATIENTS IN HOSPITAL SETTING.pptx
TRANSFER OF PATIENTS IN HOSPITAL SETTING.pptxTRANSFER OF PATIENTS IN HOSPITAL SETTING.pptx
TRANSFER OF PATIENTS IN HOSPITAL SETTING.pptx
PoojaSen20
Kaun TALHA quiz Finals -- El Dorado 2025
Kaun TALHA quiz Finals -- El Dorado 2025Kaun TALHA quiz Finals -- El Dorado 2025
Kaun TALHA quiz Finals -- El Dorado 2025
Conquiztadors- the Quiz Society of Sri Venkateswara College
Blind Spots in AI and Formulation Science Knowledge Pyramid (Updated Perspect...
Blind Spots in AI and Formulation Science Knowledge Pyramid (Updated Perspect...Blind Spots in AI and Formulation Science Knowledge Pyramid (Updated Perspect...
Blind Spots in AI and Formulation Science Knowledge Pyramid (Updated Perspect...
Ajaz Hussain
How to attach file using upload button Odoo 18
How to attach file using upload button Odoo 18How to attach file using upload button Odoo 18
How to attach file using upload button Odoo 18
Celine George
How to Setup WhatsApp in Odoo 17 - Odoo 際際滷s
How to Setup WhatsApp in Odoo 17 - Odoo 際際滷sHow to Setup WhatsApp in Odoo 17 - Odoo 際際滷s
How to Setup WhatsApp in Odoo 17 - Odoo 際際滷s
Celine George
APM People Interest Network Conference - Tim Lyons - The neurological levels ...
APM People Interest Network Conference - Tim Lyons - The neurological levels ...APM People Interest Network Conference - Tim Lyons - The neurological levels ...
APM People Interest Network Conference - Tim Lyons - The neurological levels ...
Association for Project Management
Eng7-Q4-Lesson 1 Part 1 Understanding Discipline-Specific Words, Voice, and T...
Eng7-Q4-Lesson 1 Part 1 Understanding Discipline-Specific Words, Voice, and T...Eng7-Q4-Lesson 1 Part 1 Understanding Discipline-Specific Words, Voice, and T...
Eng7-Q4-Lesson 1 Part 1 Understanding Discipline-Specific Words, Voice, and T...
sandynavergas1
TLE 7 - 2nd Topic - Codes and Standards in Industrial Arts Services.pptx
TLE 7 - 2nd Topic - Codes and Standards in Industrial Arts Services.pptxTLE 7 - 2nd Topic - Codes and Standards in Industrial Arts Services.pptx
TLE 7 - 2nd Topic - Codes and Standards in Industrial Arts Services.pptx
RizaBedayo
How to Configure Flexible Working Schedule in Odoo 18 Employee
How to Configure Flexible Working Schedule in Odoo 18 EmployeeHow to Configure Flexible Working Schedule in Odoo 18 Employee
How to Configure Flexible Working Schedule in Odoo 18 Employee
Celine George
Useful environment methods in Odoo 18 - Odoo 際際滷s
Useful environment methods in Odoo 18 - Odoo 際際滷sUseful environment methods in Odoo 18 - Odoo 際際滷s
Useful environment methods in Odoo 18 - Odoo 際際滷s
Celine George
The Broccoli Dog's inner voice (look A)
The Broccoli Dog's inner voice  (look A)The Broccoli Dog's inner voice  (look A)
The Broccoli Dog's inner voice (look A)
merasan
EDL 290F Week 3 - Mountaintop Views (2025).pdf
EDL 290F Week 3  - Mountaintop Views (2025).pdfEDL 290F Week 3  - Mountaintop Views (2025).pdf
EDL 290F Week 3 - Mountaintop Views (2025).pdf
Liz Walsh-Trevino
Modeling-Simple-Equation-Using-Bar-Models.pptx
Modeling-Simple-Equation-Using-Bar-Models.pptxModeling-Simple-Equation-Using-Bar-Models.pptx
Modeling-Simple-Equation-Using-Bar-Models.pptx
maribethlacno2
A PPT on the First Three chapters of Wings of Fire
A PPT on the First Three chapters of Wings of FireA PPT on the First Three chapters of Wings of Fire
A PPT on the First Three chapters of Wings of Fire
Beena E S
Computer Application in Business (commerce)
Computer Application in Business (commerce)Computer Application in Business (commerce)
Computer Application in Business (commerce)
Sudar Sudar
POWERPOINT-PRESENTATION_DM-NO.017-S.2025.pptx
POWERPOINT-PRESENTATION_DM-NO.017-S.2025.pptxPOWERPOINT-PRESENTATION_DM-NO.017-S.2025.pptx
POWERPOINT-PRESENTATION_DM-NO.017-S.2025.pptx
MarilenQuintoSimbula
Database population in Odoo 18 - Odoo slides
Database population in Odoo 18 - Odoo slidesDatabase population in Odoo 18 - Odoo slides
Database population in Odoo 18 - Odoo slides
Celine George
DUBLIN PROGRAM DUBLIN PROGRAM DUBLIN PROGRAM
DUBLIN PROGRAM DUBLIN PROGRAM DUBLIN PROGRAMDUBLIN PROGRAM DUBLIN PROGRAM DUBLIN PROGRAM
DUBLIN PROGRAM DUBLIN PROGRAM DUBLIN PROGRAM
vlckovar
TRANSFER OF PATIENTS IN HOSPITAL SETTING.pptx
TRANSFER OF PATIENTS IN HOSPITAL SETTING.pptxTRANSFER OF PATIENTS IN HOSPITAL SETTING.pptx
TRANSFER OF PATIENTS IN HOSPITAL SETTING.pptx
PoojaSen20
Blind Spots in AI and Formulation Science Knowledge Pyramid (Updated Perspect...
Blind Spots in AI and Formulation Science Knowledge Pyramid (Updated Perspect...Blind Spots in AI and Formulation Science Knowledge Pyramid (Updated Perspect...
Blind Spots in AI and Formulation Science Knowledge Pyramid (Updated Perspect...
Ajaz Hussain
How to attach file using upload button Odoo 18
How to attach file using upload button Odoo 18How to attach file using upload button Odoo 18
How to attach file using upload button Odoo 18
Celine George
How to Setup WhatsApp in Odoo 17 - Odoo 際際滷s
How to Setup WhatsApp in Odoo 17 - Odoo 際際滷sHow to Setup WhatsApp in Odoo 17 - Odoo 際際滷s
How to Setup WhatsApp in Odoo 17 - Odoo 際際滷s
Celine George
APM People Interest Network Conference - Tim Lyons - The neurological levels ...
APM People Interest Network Conference - Tim Lyons - The neurological levels ...APM People Interest Network Conference - Tim Lyons - The neurological levels ...
APM People Interest Network Conference - Tim Lyons - The neurological levels ...
Association for Project Management
Eng7-Q4-Lesson 1 Part 1 Understanding Discipline-Specific Words, Voice, and T...
Eng7-Q4-Lesson 1 Part 1 Understanding Discipline-Specific Words, Voice, and T...Eng7-Q4-Lesson 1 Part 1 Understanding Discipline-Specific Words, Voice, and T...
Eng7-Q4-Lesson 1 Part 1 Understanding Discipline-Specific Words, Voice, and T...
sandynavergas1

Featured (20)

2024 State of Marketing Report by Hubspot
2024 State of Marketing Report  by Hubspot2024 State of Marketing Report  by Hubspot
2024 State of Marketing Report by Hubspot
Marius Sescu
Everything You Need To Know About ChatGPT
Everything You Need To Know About ChatGPTEverything You Need To Know About ChatGPT
Everything You Need To Know About ChatGPT
Expeed Software
Product Design Trends in 2024 | Teenage Engineerings
Product Design Trends in 2024 | Teenage EngineeringsProduct Design Trends in 2024 | Teenage Engineerings
Product Design Trends in 2024 | Teenage Engineerings
Pixeldarts
How Race, Age and Gender Shape Attitudes Towards Mental Health
How Race, Age and Gender Shape Attitudes Towards Mental HealthHow Race, Age and Gender Shape Attitudes Towards Mental Health
How Race, Age and Gender Shape Attitudes Towards Mental Health
ThinkNow
AI Trends in Creative Operations 2024 by Artwork Flow.pdf
AI Trends in Creative Operations 2024 by Artwork Flow.pdfAI Trends in Creative Operations 2024 by Artwork Flow.pdf
AI Trends in Creative Operations 2024 by Artwork Flow.pdf
marketingartwork
Skeleton Culture Code
Skeleton Culture CodeSkeleton Culture Code
Skeleton Culture Code
Skeleton Technologies
PEPSICO Presentation to CAGNY Conference Feb 2024
PEPSICO Presentation to CAGNY Conference Feb 2024PEPSICO Presentation to CAGNY Conference Feb 2024
PEPSICO Presentation to CAGNY Conference Feb 2024
Neil Kimberley
Content Methodology: A Best Practices Report (Webinar)
Content Methodology: A Best Practices Report (Webinar)Content Methodology: A Best Practices Report (Webinar)
Content Methodology: A Best Practices Report (Webinar)
contently
How to Prepare For a Successful Job Search for 2024
How to Prepare For a Successful Job Search for 2024How to Prepare For a Successful Job Search for 2024
How to Prepare For a Successful Job Search for 2024
Albert Qian
Social Media Marketing Trends 2024 // The Global Indie Insights
Social Media Marketing Trends 2024 // The Global Indie InsightsSocial Media Marketing Trends 2024 // The Global Indie Insights
Social Media Marketing Trends 2024 // The Global Indie Insights
Kurio // The Social Media Age(ncy)
Trends In Paid Search: Navigating The Digital Landscape In 2024
Trends In Paid Search: Navigating The Digital Landscape In 2024Trends In Paid Search: Navigating The Digital Landscape In 2024
Trends In Paid Search: Navigating The Digital Landscape In 2024
Search Engine Journal
5 Public speaking tips from TED - Visualized summary
5 Public speaking tips from TED - Visualized summary5 Public speaking tips from TED - Visualized summary
5 Public speaking tips from TED - Visualized summary
SpeakerHub
ChatGPT and the Future of Work - Clark Boyd
ChatGPT and the Future of Work - Clark Boyd ChatGPT and the Future of Work - Clark Boyd
ChatGPT and the Future of Work - Clark Boyd
Clark Boyd
Getting into the tech field. what next
Getting into the tech field. what next Getting into the tech field. what next
Getting into the tech field. what next
Tessa Mero
Google's Just Not That Into You: Understanding Core Updates & Search Intent
Google's Just Not That Into You: Understanding Core Updates & Search IntentGoogle's Just Not That Into You: Understanding Core Updates & Search Intent
Google's Just Not That Into You: Understanding Core Updates & Search Intent
Lily Ray
How to have difficult conversations
How to have difficult conversations How to have difficult conversations
How to have difficult conversations
Rajiv Jayarajah, MAppComm, ACC
Introduction to Data Science
Introduction to Data ScienceIntroduction to Data Science
Introduction to Data Science
Christy Abraham Joy
Time Management & Productivity - Best Practices
Time Management & Productivity -  Best PracticesTime Management & Productivity -  Best Practices
Time Management & Productivity - Best Practices
Vit Horky
The six step guide to practical project management
The six step guide to practical project managementThe six step guide to practical project management
The six step guide to practical project management
MindGenius
Beginners Guide to TikTok for Search - Rachel Pearson - We are Tilt __ Bright...
Beginners Guide to TikTok for Search - Rachel Pearson - We are Tilt __ Bright...Beginners Guide to TikTok for Search - Rachel Pearson - We are Tilt __ Bright...
Beginners Guide to TikTok for Search - Rachel Pearson - We are Tilt __ Bright...
RachelPearson36
2024 State of Marketing Report by Hubspot
2024 State of Marketing Report  by Hubspot2024 State of Marketing Report  by Hubspot
2024 State of Marketing Report by Hubspot
Marius Sescu
Everything You Need To Know About ChatGPT
Everything You Need To Know About ChatGPTEverything You Need To Know About ChatGPT
Everything You Need To Know About ChatGPT
Expeed Software
Product Design Trends in 2024 | Teenage Engineerings
Product Design Trends in 2024 | Teenage EngineeringsProduct Design Trends in 2024 | Teenage Engineerings
Product Design Trends in 2024 | Teenage Engineerings
Pixeldarts
How Race, Age and Gender Shape Attitudes Towards Mental Health
How Race, Age and Gender Shape Attitudes Towards Mental HealthHow Race, Age and Gender Shape Attitudes Towards Mental Health
How Race, Age and Gender Shape Attitudes Towards Mental Health
ThinkNow
AI Trends in Creative Operations 2024 by Artwork Flow.pdf
AI Trends in Creative Operations 2024 by Artwork Flow.pdfAI Trends in Creative Operations 2024 by Artwork Flow.pdf
AI Trends in Creative Operations 2024 by Artwork Flow.pdf
marketingartwork
PEPSICO Presentation to CAGNY Conference Feb 2024
PEPSICO Presentation to CAGNY Conference Feb 2024PEPSICO Presentation to CAGNY Conference Feb 2024
PEPSICO Presentation to CAGNY Conference Feb 2024
Neil Kimberley
Content Methodology: A Best Practices Report (Webinar)
Content Methodology: A Best Practices Report (Webinar)Content Methodology: A Best Practices Report (Webinar)
Content Methodology: A Best Practices Report (Webinar)
contently
How to Prepare For a Successful Job Search for 2024
How to Prepare For a Successful Job Search for 2024How to Prepare For a Successful Job Search for 2024
How to Prepare For a Successful Job Search for 2024
Albert Qian
Social Media Marketing Trends 2024 // The Global Indie Insights
Social Media Marketing Trends 2024 // The Global Indie InsightsSocial Media Marketing Trends 2024 // The Global Indie Insights
Social Media Marketing Trends 2024 // The Global Indie Insights
Kurio // The Social Media Age(ncy)
Trends In Paid Search: Navigating The Digital Landscape In 2024
Trends In Paid Search: Navigating The Digital Landscape In 2024Trends In Paid Search: Navigating The Digital Landscape In 2024
Trends In Paid Search: Navigating The Digital Landscape In 2024
Search Engine Journal
5 Public speaking tips from TED - Visualized summary
5 Public speaking tips from TED - Visualized summary5 Public speaking tips from TED - Visualized summary
5 Public speaking tips from TED - Visualized summary
SpeakerHub
ChatGPT and the Future of Work - Clark Boyd
ChatGPT and the Future of Work - Clark Boyd ChatGPT and the Future of Work - Clark Boyd
ChatGPT and the Future of Work - Clark Boyd
Clark Boyd
Getting into the tech field. what next
Getting into the tech field. what next Getting into the tech field. what next
Getting into the tech field. what next
Tessa Mero
Google's Just Not That Into You: Understanding Core Updates & Search Intent
Google's Just Not That Into You: Understanding Core Updates & Search IntentGoogle's Just Not That Into You: Understanding Core Updates & Search Intent
Google's Just Not That Into You: Understanding Core Updates & Search Intent
Lily Ray
Time Management & Productivity - Best Practices
Time Management & Productivity -  Best PracticesTime Management & Productivity -  Best Practices
Time Management & Productivity - Best Practices
Vit Horky
The six step guide to practical project management
The six step guide to practical project managementThe six step guide to practical project management
The six step guide to practical project management
MindGenius
Beginners Guide to TikTok for Search - Rachel Pearson - We are Tilt __ Bright...
Beginners Guide to TikTok for Search - Rachel Pearson - We are Tilt __ Bright...Beginners Guide to TikTok for Search - Rachel Pearson - We are Tilt __ Bright...
Beginners Guide to TikTok for Search - Rachel Pearson - We are Tilt __ Bright...
RachelPearson36

Presentation of data

  • 1. ARRAY 2 7 8 11 15 16 18 19 19 19 23 23 24 26 27 29 33 40 44 47 49 51 54 63 68
  • 2. SIMPLE TABLE DISTRIBUTION OF AGES OF DCDMBS STUDENTS Age of student Frequency Relative frequency 19 14 0.0350 20 23 0.0575 21 134 0.3350 22 149 0.3725 23 71 0.1775 24 9 0.0225 TOTAL 400 1.0000
  • 3. COMPOUND TABLE COURSE BA B Com B Sc R Pass 37 25 33 E S Supp 5 10 4 U L Fail 11 8 27 T
  • 4. SINGLE LINE GRAPH Line graph for ages of students 160 Number of students 140 120 100 80 60 40 20 0 19 20 21 22 23 24 Age
  • 5. MULTIPLE LINE GRAPH Multiple line graph for age distribution at academic institutions 160 140 Number of students 120 100 UoM 80 DCDMBS 60 UTM 40 20 0 19 20 21 22 23 24 Age
  • 6. SIMPLE PIE CHART Distribution of students enrolled for BA, B Com and B Sc BA 33% B Com 40% B Sc 27%
  • 7. ENHANCED PIE CHART Distribution of students enrolled for BA, B Com and B Sc BA 33% 40% B Com B Sc 27%
  • 8. SIMPLE BAR CHART Simple bar chart for age distribution of students 160 140 Number of students 120 100 80 60 40 20 0 19 20 21 22 23 24 Age
  • 9. MULTIPLE BAR CHART Multiple bar chart showing the results for BA, B Com and B Sc 40 35 30 25 Results Pass 20 Supp 15 Fail 10 5 0 BA B Com B Sc Courses
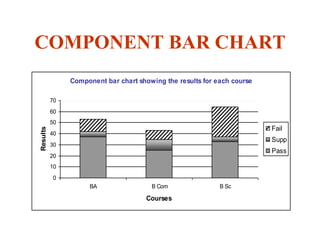
  • 10. COMPONENT BAR CHART Component bar chart showing the results for each course 70 60 50 Fail Results 40 Supp 30 Pass 20 10 0 BA B Com B Sc Courses
  • 11. PERCENTAGE BAR CHART Percentage bar chart showing the results for each course 100% 90% 80% 70% Fail Results 60% 50% Supp 40% 30% Pass 20% 10% 0% BA B Com B Sc Courses
  • 12. HISTOGRAM (EQUAL CELL WIDTH) Histogram for grouped data 45 40 Number of workers (frequency) 35 30 25 20 15 10 5 0 [20.5, [25.5, [30.5, [35.5, [40.5, [45.5, [50.5, [55.5, 25.5) 30.5) 35.5) 40.5) 45.5) 50.5) 55.5) 60.5) Age group of w orkers
  • 13. HISTOGRAM (UNEQUAL CELL WIDTHS) Histogram (unequal class intervals) using frequency density 1.6 1.4 1.2 Frequency density 1 0.8 0.6 0.4 0.2 0 0 20 40 60 80 Temparature (degrees Fahrenheit)
  • 14. FREQUENCY POLYGON (USING HISTOGRAM) Histogram and frequency polygon for grouped data 18 16 14 12 Frequency 10 8 6 4 2 0 -10 0 10 20 30 40 50 60 70 80 Temperature (degrees Fahrenheit)
  • 15. FREQUENCY POLYGON Frequency polygon for grouped data 45 Number of students (frequency) 40 35 30 25 20 15 10 5 0 20.5 25.5 30.5 35.5 40.5 45.5 50.5 55.5 25.5 30.5 35.5 40.5 45.5 50.5 55.5 60.5 Age of students
  • 16. CUMULATIVE FREQUENCY (LESS THAN OGIVE) 'Less than' cumulative frequency curve for age 160 140 120 'Less than' CF 100 80 60 40 20 0 20.5 25.5 30.5 35.5 40.5 45.5 50.5 55.5 60.5 Age (upper real limits)
  • 17. CUMULATIVE FREQUENCY (MORE THAN OGIVE) 'More than' cumulative frequency ogive for age 160 140 120 'More than' CF 100 80 60 40 20 0 20.5 25.5 30.5 35.5 40.5 45.5 50.5 55.5 60.5 Age (lower real limits)
  • 18. STEM-AND-LEAF PLOT Stem Leaf Stem Leaf 1 7 9 1 7 9 2 2 2 2 3 8 9 3 8 9 4 5 7 4 4 4 5 7 5 3 4 5 4 1 4 5 1 3 4 4 4 5 6 6 5 6 5 6 7 6 5 2 7 2 5 6 8 4 8 4 Key 1|7 means 17
  • 19. STEM-AND-LEAF PLOT (BACK-TO-BACK) Key (French) French English Key (English) 8|5 means 58 6|3 means 63 2 1 3 8 7 6 5 4 4 4 3 4 4 8 8 7 3 3 0 5 2 8 6 9 6 1 1 6 3 5 5 8 9 8 5 7 1 2 2 7 9 9 1 8 4 5
  • 20. BOX-AND-WHISKERS PLOT O 10 20 30 40 50 60 70 80 90 100 Number of marks
  • 21. BOX-AND-WHISKERS PLOT (COMPARISON) French English O 10 20 30 40 50 60 70 80 90 100 Number of marks
  • 22. SCATTER PLOT Scatterplot of length of metal rod at various temperatures 6.1 6 5.9 5.8 5.7 Length 5.6 5.5 5.4 5.3 5.2 5.1 5 0 10 20 30 40 50 60 70 80 90 Temperature
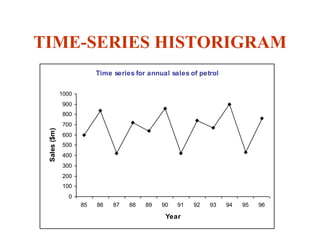
  • 23. TIME-SERIES HISTORIGRAM Time series for annual sales of petrol 1000 900 800 700 Sales ($m) 600 500 400 300 200 100 0 85 86 87 88 89 90 91 92 93 94 95 96 Year
  • 24. LORENZ CURVE Lorenz curve for the distribution of taxpayers 1 0.9 Line of uniform 0.8 distribution Proportion of tax paid 0.7 0.6 0.5 0.4 0.3 0.2 0.1 0 0 0.2 0.4 0.6 0.8 1 Proportion of taxpayers