


More Related Content
Viewers also liked (18)


Similar to Presentation1 (20)


Recently uploaded (20)

![[Webinar] Scaling Made Simple: Getting Started with No-Code Web Apps](https://cdn.slidesharecdn.com/ss_thumbnails/webinarscalingmadesimplegettingstartedwithno-codewebapps-mar52025-250305183437-f03c78a3-thumbnail.jpg?width=560&fit=bounds)


Presentation1
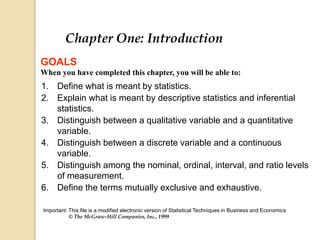
- 1. 1. Define what is meant by statistics. 2. Explain what is meant by descriptive statistics and inferential statistics. 3. Distinguish between a qualitative variable and a quantitative variable. 4. Distinguish between a discrete variable and a continuous variable. 5. Distinguish among the nominal, ordinal, interval, and ratio levels of measurement. 6. Define the terms mutually exclusive and exhaustive. GOALS When you have completed this chapter, you will be able to: Chapter One: Introduction Important: This file is a modified electronic version of Statistical Techniques in Business and Economics ÂĐ The McGraw-Hill Companies, Inc., 1999
- 2. What is Meant by Statistics? ï Statistics is the science of collecting, organizing, presenting, ana lyzing, and interpreting numerical data for the purpose of assisting in making a more effective decision. 1-2
- 3. Who Uses Statistics? ï In todayâs information society, decisions are made on the basis of data. A family checks the neighborhood before purchasing a house, a company checks the labor and transportation conditions before opening a new branch, an engineer tests the tensile strength of a wire before winding it into a cable, and so on. 1-3
- 4. Types of Statistics ï Descriptive Statistics: Methods of organizing, summarizing, and presenting data in an informative way. ï EXAMPLE 1: A survey found that 49% of the people knew the name of the first book of the Bible. The statistic 49 describes the number out of every 100 persons who knew the answer. ï EXAMPLE 2: According to Consumer Reports, Whirlpool washing machine owners reported 9 problems per 100 machines during 2005. The statistic 9 describes the number of problems out of every 100 machines. 1-4
- 5. Types of Statistics ï Inferential Statistics: A decision, estimate, prediction, or generalization about a population, based on a sample. ï A population is a collection of all possible individuals, objects, or measurements of interest. ï A sample is a portion, or part, of the population of interest. 1-5
- 6. Types of Statistics (examples of inferential statistics) ï EXAMPLE 1: Measuring lifetimes of transistors ï EXAMPLE 2: Classifying air as healthy or unhealthy based on the Air Quality Index (AQI) ï EXAMPLE 3: Collecting data on the volume of traffic flow in a busy street of Manila. 1-6
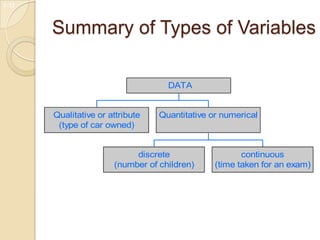
- 7. Types of Variables ï Qualitative or Attribute variable: data in the form of classifications into different groups or categories. The characteristic or variable being studied is nonnumeric. ï EXAMPLES: Gender, religious affiliation, type of automobile owned, place of birth, eye color. 1-7
- 8. Types of Variables ï Quantitative variable: data in the form of numerical measurements or counts. The variable can be reported numerically. ï EXAMPLE: ozone level of the air, minutes remaining in class, number of children in a family. 1-8
- 9. Types of Variables ï Quantitative variables can be classified as either discrete or continuous. ï Discrete variables:Variables which assume a finite or countable number of possible values. Usually obtained by counting. ï EXAMPLE: the number of bedrooms in a house. (1,2,3,..., etc...). ï Continuous variables: Variables which assume an infinite number of possible values. Usually obtained by measurement. ï EXAMPLE: The time it takes to fly from Manila to Cebu. 1-9
- 10. Summary of Types of Variables Qualitative or attribute (type of car owned) discrete (number of children) continuous (time taken for an exam) Quantitative or numerical DATA 1-11
- 11. Sources of Statistical Data ï Researching problems usually requires published data. Statistics on these problems can be found in published articles, journals, and magazines. ï Published data is not always available on a given subject. In such cases, information will have to be collected and analyzed. ï One way of collecting data is via questionnaires. 1-12
- 12. Levels of Measurement ï Nominal level (scaled): Data that can only be classified into categories and cannot be arranged in an ordering scheme. ï EXAMPLES: eye color, gender, religious affiliation. 1-13
- 13. Levels of Measurement ï Mutually exclusive: An individual or item that, by virtue of being included in one category, must be excluded from any other category. ï EXAMPLE: eye color. ï Exhaustive: each person, object, or item must be classified in at least one category. ï EXAMPLE: religious affiliation. 1-14
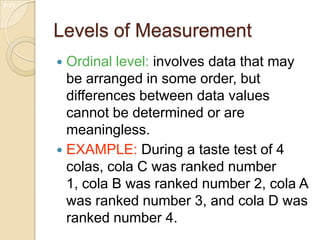
- 14. Levels of Measurement ï Ordinal level: involves data that may be arranged in some order, but differences between data values cannot be determined or are meaningless. ï EXAMPLE: During a taste test of 4 colas, cola C was ranked number 1, cola B was ranked number 2, cola A was ranked number 3, and cola D was ranked number 4. 1-15
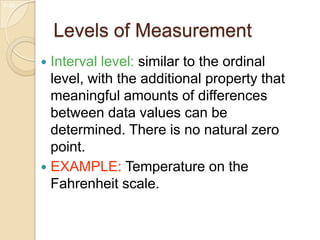
- 15. Levels of Measurement ï Interval level: similar to the ordinal level, with the additional property that meaningful amounts of differences between data values can be determined. There is no natural zero point. ï EXAMPLE: Temperature on the Fahrenheit scale. 1-16
- 16. Levels of Measurement ï Ratio level: the interval level with an inherent zero starting point. Differences and ratios are meaningful for this level of measurement. ï EXAMPLES: money, heights of NBA players. 1-17
- 17. Assessment: 1.A statistic is a. collection of values b. single value. c. The sum of several values. d. The largest value in a set of observations 17 2. In descriptive statistics our main objective is to a. Describe the population. b. Describe the data we collected. c. Infer something about the population. d.Compute an average. 3. Which of the following statements is true regarding a population? a. It must be a large number of values. b. It must refer to people. c. It is a collection individuals, objects, or measurements. d. None of the above. 4. Which of the following statements is true regarding a sample? a. It is a part of population. b. It must contain at least five observations. c. It refers to descriptive statistics. d. All of the above are correct. 5. A qualitative variable a. Always refers to a sample. b. Is nonumeric. c. Always has only two possible outcomes. d. All of the above are correct.
- 18. Assessment:6. A discrete variable a. Is an example of a qualitative variable. b.Can assume only whole number values. c. Can assume only certain clearly separated values. d. Cannot be negative. 18 7. A nominal scale variable is a. Usually the result of counting something. b. Has a meaningful zero point. c. May assume negative values. d. Cannot have more than two categories. 8. The ratio scale of measurement a. Usually involves ranking. b. Cannot assume negative values. c. Has a meaningful zero point. d. Is usually based on counting. 9. The ordinal scale of measurement a. Has a meaningful zero point. b. Is based on ranks. c. Cannot assume negative values. d. All of the above. 10. Categories are exhaustive when a. There is a meaningful zero point. b. The objects can be ranked. c. Each object must appear in at least one category. d. Each object can be included in only one category.