Program Evaluation & Review Technique for Civil Engineering
0 likes10 views

Program Evaluation & Review Technique for Civil Engineering


More Related Content
More from D. Y. Patil College of Engineering & Technology, Kolhapur, Maharastra, India (20)
Recently uploaded (20)


Program Evaluation & Review Technique for Civil Engineering
- 1. Unit no.3 Programme Evaluation & Review Technique (P.E.R.T) Mr. Kiran R. Patil Assistant Professor, Department of Civil Engineering, D. Y. Patil College of Engineering & Technology, Kolhapur
- 2. ’üČ Introduction to PERT ŌĆó PERT was developed by U.S. Navy engineers while working on the Polaris Missile Programme during 1957-58. ŌĆó PERT is used for planning and controlling the projects involving uncertainties. This technique is usually used for non-repetitive project such as launching of satellites, research and development (R & D) projects, etc. in which correct time estimation for various activities cannot be made due to lack of past data. ŌĆó PERT is an event-oriented technique. This technique uses a network diagram consisting of events which must be established to reach project objectives. ŌĆó More stress is given on time in this technique. The uncertainty in activity times is measured by using the following three time estimates, 1. The optimistic time estimate 2. The pessimistic time estimate 3. The most likely time estimate ŌĆó For computation of critical path, the three-time are converted into a single-time in network. This single time is called the expected time. 1. The Optimistic time estimate (tO):- This is the shortest possible time in which an activity can be completed under ideal conditions. It is possible when all the conditions are favor of project. 2. The Pessimistic time estimate (tP) This is the maximum time that would be required to complete the activity. It represents
- 3. the time it might take to complete a particular activity if everything went wrong about of project. 3. The Most likely time estimate (tL) ŌĆó It is the normal time required to complete an activity. It is in between the position of optimistic & pessimistic time. tO + 4tL + tP ŌĆó Expected Time, tE = 6
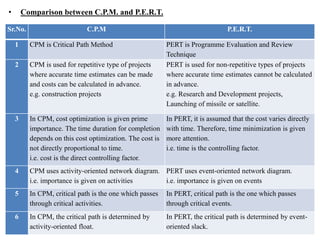
- 4. ŌĆó Comparison between C.P.M. and P.E.R.T. Sr.No. C.P.M P.E.R.T. 1 CPM is Critical Path Method PERT is Programme Evaluation and Review Technique 2 CPM is used for repetitive type of projects where accurate time estimates can be made and costs can be calculated in advance. e.g. construction projects PERT is used for non-repetitive types of projects where accurate time estimates cannot be calculated in advance. e.g. Research and Development projects, Launching of missile or satellite. 3 In CPM, cost optimization is given prime importance. The time duration for completion depends on this cost optimization. The cost is not directly proportional to time. i.e. cost is the direct controlling factor. In PERT, it is assumed that the cost varies directly with time. Therefore, time minimization is given more attention. i.e. time is the controlling factor. 4 CPM uses activity-oriented network diagram. i.e. importance is given on activities PERT uses event-oriented network diagram. i.e. importance is given on events 5 In CPM, critical path is the one which passes through critical activities. In PERT, critical path is the one which passes through critical events. 6 In CPM, the critical path is determined by activity-oriented float. In PERT, the critical path is determined by event- oriented slack.
- 5. ŌĆó Frequency Distribution ŌĆó The most likely time (tL) can also be found out by using frequency distribution curve. ŌĆó The curve is symmetrical about its apex. Such a curve is known as ŌĆśNormal Distribution CurveŌĆÖ. ŌĆó The statistical data for varying time durations for the jobs of particular type consumed in the past can be expressed in the form of a frequency distribution curve. ŌĆó The probability curve which is not symmetrical about its apex is known as ŌĆśBeta Distribution CurveŌĆÖ.
- 6. ŌĆó The beta distribution is used in PERT because it satisfies the following requirements, 1. The distribution should have a small probability of reaching the optimistic time (shortest time). 2. The distribution should have a small probability of reaching the pessimistic time (longest time) 3. The distribution should have only one most likely time which would be free to move between the two limits of to and tp. ŌĆó For beta distribution, the standard deviation is given by, ŌĆó Ø£Ä = ØæĪØæØŌłÆØæĪØæ£ 6 ŌĆó The variance Ø£Ä2 = ØæĪØæØŌłÆØæĪØæ£ 6 2 ŌĆó Ex. 1 ŌĆó On a construction project, the times required for digging 54 trenches of fixed dimensions are recorded below. The trenches were excavated by different gangs, each consisting of the same number of labours. Plot the frequency distribution curve. Times of completion of trenches (days) 8 10 12 6 9 11 10 13 15 12 11 9 8 10 14 16 12 16 15 10 14 12 7 9 13 10 8 11 17 13 9 11 13 10 14 9 12 15 14 9 10 9 11 10 7 13 11 8 12 11 8 10 9 11
- 7. Solution: ŌĆó From the above record, we find that the minimum time taken for completion of trenches is 6 days, which is the optimistic time (tO). The maximum time is 17 days which is the pessimistic time (tP). ŌĆó The following table gives the number of trenches completed in 6, 7, 8, 9, 10, 11, 12, 13, 14, 15, 16 and 17 days respectively. Days of completion No. of trenches completed during these days Days of completion No. of trenches completed during these days 6 1 12 6 7 2 13 5 8 5 14 4 9 8 15 3 10 9 16 2 11 8 17 1
- 9. ’üČ P.E.R.T.: Network Analysis ŌĆó Slack: ŌĆó Slack means ŌĆśtime to spareŌĆÖ ŌĆó It is the difference between the latest allowable occurrence time and the earliest expected time of an event ŌĆó S = TL ŌĆō TE ŌĆó Slack can be +ve, zero or ŌĆōve 1. Positive Slack: when TL > TE It is an indication of an ŌĆśahead of scheduleŌĆÖ situation (excess resources) 2. Zero Slack: when TL = TE It is an indication of ŌĆśon scheduleŌĆÖ situation (adequate resources) 3. Negative Slack: when TL < TE It is an indication of a ŌĆśbehind scheduleŌĆÖ situation (lack of resources) ŌĆó Critical Path: ŌĆó It is the one which consumes maximum time. It is time wise longest path. ŌĆó It is time wise longest path who connects the events of zero slack.
- 10. ŌĆó The network for a project is shown below. Determine the expected time for each path. Which path is critical? Solution: There are 4 paths 1. Path A: 1-2-7-8 2. Path B: 1-2-6-8 3. Path C: 1-3-6-8 4. Path D: 1-4-5-6-8 ŌĆó Expected time tE = tO + 4tL + tP 6
- 11. Path Activity tO tL tP tE Ōłæ= tE A 1-2 6 8 11 8.17 26.34 2-7 8 10 12 10.00 7-8 5 8 12 8.17 B 1-2 6 8 11 8.17 26.83 2-6 4 8 14 8.33 6-8 7 10 15 10.33 C 1-3 3 7 9 6.67 27.00 3-6 8 10 12 10.00 6-8 7 10 15 10.33 D 1-4 5 7 10 7.17 28.33 4-5 4 6 8 6.00 5-6 3 5 6 4.83 6-8 7 10 15 10.33 Path D is critical sinceŌłæ= tE for this path is maximum.= 28.33
- 12. ŌĆó Finding the probability of meeting the scheduled time of completion of a project ŌĆó Determine the standard deviation (Ø£Ä) appropriate to the critical path. ŌĆó ØØł = ØÆöØÆ¢ØÆÄ ØÆÉØÆć ØÆŚØÆéØÆōØÆŖØÆéØÆÅØÆäØÆåØÆö ØÆéØÆŹØÆÉØÆÅØÆł ØÆäØÆōØÆŖØÆĢØÆŖØÆäØÆéØÆŹ ØÆæØÆéØÆĢØÆē ŌĆó ØØł = ŌłæØØłØÆŖØÆŗØ¤É Where, Ø£ÄØæ¢ØæŚ2 = variance for the activity i-j along the critical path ØØłØÆŖØÆŗØ¤É = ØÆĢØÆæØÆŖØÆŗŌłÆØÆĢØÆÉØÆŖØÆŗ ؤö Ø¤É ŌĆó Find probability factor Z. ØÆü = Øæ╗ØÆöŌłÆØæ╗Øæ¼ ØØł = Øæ╗ØÆöŌłÆØæ╗Øæ¼ ŌłæØØłØÆŖØÆŗØ¤É Where, Ts = scheduled time of completion TE = earliest expected time of completion ŌĆó Z can be +ve, 0 or ŌĆōve. 1. When Z is +ve, the chances of completing the project in scheduled time are more than 50 %. 2. When Z is 0, the chances of completing the project in scheduled time are fifty- fifty. 3. When Z is - ve, the chances of completing the project in scheduled time are less than 50 %. ŌĆó Find % probability with respect to the normal deviation Z from the table.
- 13. Values of Standard Normal Distribution Function
- 14. Problem 1. A project is expected to take 15 months along the critical path, having a standard deviation of 3 months. What is the probability of completing the project within (i) 15 months, (ii) 18 months, (iii) 12 months? ŌĆó Solution: ŌĆó Given Data: TE= 15 months , Ø£Ä = 3 months ŌĆó Probability Factor ØæŹ = ØæćØæĀŌłÆØæćØÉĖ Ø£Ä 1) Ts = 15 months; ØæŹ = 15 ŌłÆ 15 3 = 0 ŌĆó For Z = 0, Probability = 50 % (from the Table) 2) Ts = 18 months; ØæŹ = 18 ŌłÆ 15 3 = 1 For Z = 1, Probability = 84.13 % (from the Table) 3) Ts = 12 months; ØæŹ = 12 ŌłÆ 15 3 = ŌłÆ1 ŌĆó For Z = -1, Probability = 15.87 % (from the Table)
- 15. Problem 2. With the information given in the table draw the network for a construction project. Determine, 1. Critical path and its standard deviation 2. Probability of completion of project in 40 days. 3. Time duration that will provide 95 % probability of its completion in time. ŌĆó Solution: 1. Calculate expected time for each activity, Activity Optimistic time Most likely time Pessimistic time 1-2 2 5 8 2-3 8 11 20 3-4 0 0 0 2-4 4 7 16 2-5 4 9 20 4-6 7 10 13 5-6 3 7 17 3-7 3 5 13 6-7 2 3 10 7-8 2 4 6
- 16. Activity Optimistic time tO Most likely time tL Pessimistic time tP Expected Time tE = tO + 4tL + tP 6 Ø£Ä2 = ØæĪØæØ ŌłÆ ØæĪØæ£ 6 2 1-2 2 5 8 5 1 2-3 8 11 20 12 4 3-4 0 0 0 0 0 2-4 4 7 16 8 4 2-5 4 9 20 10 7.11 4-6 7 10 13 10 1 5-6 3 7 17 8 5.44 3-7 3 5 13 6 2.78 6-7 2 3 10 4 1.77 7-8 2 4 6 4 0.44 2. Draw the Network with expected time Critical path: 1-2-3-4-6-7-8 Project duration = 35 days
- 17. 1. Standard deviation along critical path = Ø£Ä = ŌłæØ£ÄØæ¢ØæŚ2 ŌłæØ£ÄØæ¢ØæŚ2 = 1 + 4 + 0 + 1 + 1.77 + 0.44 = 8.2 ØØł = 8.21 = 2.87 ŌĆó Probability Factor Z= (Ts-TE)/Žā 2. Here, Ts = 40 days and Žā = 2.87 months ŌĆó Z= (40-35)/2.87=1.74 ŌĆó From the table, ŌĆó For Z = 1.7, Pr = 95.54 %, For Z = 1.8, Pr = 96.41 % ŌĆó For Z = 1.74, Pr = ? 1.7 = 95.54 1.8 = 96.41 0.1 = 0.87 ŌĆó 0.04 = 0.04 Øæź 0.87 0.1 = 0.35 ŌĆó For Z = 1.74, Pr = 95.54 + 0.35 = 95.89 % 3. For Pr = 95 %, Ts =? ŌĆó For 95.54 = 1.7 ŌĆó For 94.52 = 1.6 ŌĆó For 95, Z=? Pro. 95.54-94.52= 1.02 Z 1.7-1.6=0.1 (0.54x1.02)/0.1= 0.05 Z = 1.6 + 0.05 = 1.65
- 18. ŌĆó ØæŹ = ØæćØæĀŌłÆØæćØÉĖ Ø£Ä ŌĆó Ts = (Ø£Ä Øæŗ Z) + TE ŌĆó = (2.87 x 1.65) + 35 ŌĆó = 39.7 Ts = 40 days Problem 3. For the information given in the table determine the critical path and standard deviation for the network. Determine the probability of completing the project in 35 days. ŌĆó ( For Z = 0.9, Pr = 81.59 %. For Z = 1.0, Pr = 84.13 % and For Z = 1.1, Pr = 86.43 %) Activity Optimistic time tO Most likely time tL Pessimistic time tP 1-2 6 9 18 1-3 5 8 17 2-4 4 7 22 3-4 4 7 16 4-5 4 10 22 2-5 4 7 10 3-5 2 5 8
- 19. ŌĆó Solution: 1. Draw the Network 2. Find expected time & Variance Activity Optimistic time tO Most likely time tL Pessimistic time tP Expected Time tE = tO + 4tL + tP 6 Ø£Ä2 = ØæĪØæØ ŌłÆ ØæĪØæ£ 6 2 1-2 6 9 18 10 4 1-3 5 8 17 9 4 2-4 4 7 22 9 9 3-4 4 7 16 8 4 4-5 4 10 22 11 9 2-5 4 7 10 7 1 3-5 2 5 8 5 1
- 20. ŌĆó Standard deviation along critical path = Ø£Ä = ŌłæØ£ÄØæ¢ØæŚ2 ŌĆó ŌłæØ£ÄØæ¢ØæŚ2 = 4 + 9 + 9 = 22 ŌĆó Ø£Ä = 22 = 4.69 ’üČ Here, Ts = 35 days and Ø£Ä = 4.69 ŌĆó Probability Factor ØæŹ = ØæćØæĀŌłÆØæćØÉĖ Ø£Ä ŌĆó ØæŹ = 35ŌłÆ30 4.69 = 1.07 ŌĆó From the table, ŌĆó For Z = 1.0, Pr = 84.13 % ŌĆó For Z = 1.1, Pr = 86.43% ŌĆó For Z= 1.07, Pr= ? ŌĆó 0.07= 2.3 ŌĆó (0.07x 2.3)/0.1= 1.61 ŌĆó For Z = 1.07, Pr = 84.13 + 1.61 = 85.74 %
- 21. Problem 4. For the information given in the table determine the critical path and standard deviation for the network. Determine the probability of completing the project in 50 days. ( For Z = 0.7, Pr = 75.80 %. For Z = 0.8, Pr = 78.81% and For Z = 0.6, Pr = 72.57 %) 1. Find Expected time and variance Activity Optimistic time tO Most likely time tL Pessimistic time tP 1-2 4 8 18 1-3 4 5 18 2-4 3 7 23 2-5 1 11 33 3-4 6 6 18 3-5 3 9 21 4-5 7 12 35 5-6 9 8 31
- 22. Activity Optimistic time tO Most likely time tL Pessimistic time tP Expected Time TE = tO + 4tL + tP 6 Ø£Ä2 = ØæĪØæØ ŌłÆ ØæĪØæ£ 6 2 1-2 4 8 18 9 5.44 1-3 4 5 18 7 5.44 2-4 3 7 23 9 11.11 2-5 1 11 33 13 28.44 3-4 6 6 18 8 4 3-5 3 9 21 10 9 4-5 7 12 35 15 21.77 5-6 9 8 31 12 13.44 2. Draw network & find expected time 1 2 3 4 5 6 9 7 9 8 13 10 15 12 0 9 7 18 33 45 45 33 18 10 9 0 ŌĆó Critical Path 1-2-4-5-6 ŌĆó Project Duration = TE= 45 days
- 23. ŌĆó Standard deviation along critical path = Ø£Ä = ŌłæØ£ÄØæ¢ØæŚ2 ŌłæØ£ÄØæ¢ØæŚ2 = 5.44+11.11+21.77+13.44 = 51.76 Ø£Ä = 51.76 = 7.19 ŌĆó Probability of project completed in 50 days = Ts ØæŹ = ØæćØæĀ ŌłÆ ØæćØÉĖ Ø£Ä ØæŹ = 50ŌłÆ45 7.19 =0.69 ŌĆó From table Z= 0.6, Pr.= 72.57 Z= 0.7, Pr.= 75.80 0.6 72.57 0.7 75.80 0.1 3.23 0.09 x 0.1x= 0.09 X 3.23 x= 2.097 ŌĆó Probability of completing project within 50days= 72.57+2.907= 75.48%
- 24. ’üČ Precedence Networks : ŌĆó In CPM or PERT networks, activities are connected according to the finish-to-start logic, i.e. an activity starts only after its preceding activity is completed. But in reality, there will be a certain overlapping of time in between the adjoining activities. ŌĆó e.g. In a multi-housing construction project, the CPM network may show the activity of wall plastering as starting after the completion of masonry work of a particular building. In practice, however, plastering can start as soon as the first room is complete. It need not wait for completion of masonry work of all the rooms. ŌĆó The precedence network technique keeps the number of activities same as CPM networks (A-O-A networks) but eliminates the dummies. In the precedence networks nodes represent the activities and lines represent their interdependencies or precedence relationships. ’üČ Representation of nodes in Precedence Networks: Description Code EST Dur. EFT LST No. LFT Steel Fabrication C 0 5 5 0 3 5 Rebar Transport D 5 1 6 5 4 6 Rebar Fixing E 6 3 9 6 5 9
- 25. ’üČ Logic of Precedence Diagram 1. Finish to Start Activity B cannot start until activity A has been completed. 2. Start to Start Activity B can start at the same time A but not before. 3. Finish to Finish Activity B cannot be finished until activity A has been finished. 4 Start to start & Finish to Finish: A B Time lag A B A B A B Time lag Time lag Time lag Time lag
- 26. ŌĆó Activity B cannot be started and cannot be finished earlier than the stated time lag after the start and finish of activity A. This sequence is used to define overlapping independent activities. ’üČ Advantages of Precedence Networks: ŌĆó Precedence network can show activities which should be allowed to overlap each other or must be separated by a time delay. ŌĆó Precedence network is self sufficient as it contains the necessary information regarding the project. Time analysis results are incorporated in the drawing itself. This facilitates efficient project scheduling and control. ŌĆó Revisions and modifications can be carried out easily without affecting most of the activities ŌĆó No arrow is required to show the logical sequence of activities. From the drawings, it is clear that all activities on the left precede those on the right. ŌĆó Precedence network adopts simple notations similar to flow charts and can be easily understood by any person.