Project_poster_v1.4 (1)
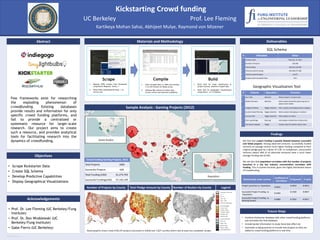
- 1. RESEARCH POSTER PRESENTATION DESIGN © 2011 www.PosterPresentations.com Geographic Visualization Tool Population Few frameworks exist for researching the exploding phenomenon of crowdfunding. Existing databases provide results and information for only specific crowd funding platforms, and fail to provide a centralized or systematic resource for larger-scale research. Our project aims to create such a resource, and provides analytical tools for facilitating research into the dynamics of crowdfunding. Abstract • Scrape Kickstarter Data • Create SQL Schema • Develop Predictive Capabilities • Display Geographical Visualizations Objectives Sample Analysis : Gaming Projects (2012) Acknowledgements • Prof. Dr. Lee Fleming (UC Berkeley/Fung Institute) • Prof. Dr. Don Wroblewski (UC Berkeley/Fung Institute) • Gabe Fierro (UC Berkeley) Game Studios Kickstarting Crowd funding Kartikeya Mohan Sahai, Abhijeet Mulye, Raymond von Mizener UC Berkeley Prof. Lee Fleming Number of Projects by County Above graphics show a total of 80,197 projects (successful or failed) over 1,827 counties which have at least one completed project • Combine Kickstarter database with other crowd funding platforms and normalize the final database • Include backer information to study home bias effect etc. • Automate scraping process to include new projects as they are added to crowd funding platforms in real time We find that project funding is greatly skewed between successful and failed projects. Among observed ventures, successfully funded ventures on average receive much higher funding compared to their original pledge goal by a factor of 2.96. In comparison, unsuccessful ventures (about 58% of all observed ventures) have a much lower average funding rate (0.4%). We see also that population correlates with the number of projects launched in a city but industry concentration correlates with funding. This is counter-intuitive, given the highly distributed nature of Crowdfunding # Feature Operation Function 1 Year Filter Selection Retains projects for given year 2 Marker Size basis Selection Select project parameter governing size of project circle marker 3 Category Filtering Toggle, Selection Filter projects excluding particular category. 4 Location based Filtering Toggle, Selection Retain projects belonging to a location 5 Success Filter Toggle, Selection Filter projects on status 6 Error Log Storage Data Log Lists projects omitted due to data errors 7 City-based mapping Toggle Creates maps for statistics about cities Relationship under scanner Coefficient of Correlation R-Squared P-value Project Launches vs. Population 0.6652 0.4552 0.0013 Successful Project Funding vs. Population 0.3356 0.1360 0.0047 Successful Project Funding vs. Gaming Studios 0.6080 0.3762 0.0017 Future Steps Findings DeliverablesMaterials and Methodology Scrape 1. Request HTML content from Kickstarter using Python Requests library <> 2. Parse HTML using Beautiful Soup <> to extract text Compile 1. Store Scraped Data in JSON and serialize it to CSV formats for Ready Access 2. Develop SQL schema for better data access control and improved availability Build 1. Build tools for ready classification of project success, based on scraped data 2. Build Tool for Geographic Visualizations using Folium - 0.1.2 (Python) Crowd funding Gaming Projects, 2012 Total Projects 1909 Successful Projects 626 Total Funding (USD) 61,274,703 Successful Funding(USD) 57,142,149 SQL Schema # Metadata Value 1 Creation Date February, 14, 2014 2 Number of Projects 105,598 3 Total Funding USD 813,139,584 4 Total Successful Funding USD 690,575,586 5 Total Successful Projects 44,272 6 Projects with Incomplete Data 1421 Total Pledge Amount by County Number of Backers by County Legend Deliverables