The ppt is a short description about how to ascertain the validity, ie; sensitivity and specificity of a screening test as well as their predictive powers. you can also find the technique to ascertain the best possible screening test through the help of an ROC curve...
Diagnosing Diagnostic describes the statistical properties of a diagnostic in an understandable way. Included in the slide are also a motivating example.
This document discusses key concepts for evaluating diagnostic tests, including sensitivity, specificity, predictive values, and likelihood ratios. Sensitivity refers to a test's ability to correctly identify individuals with the disease, while specificity refers to a test's ability to correctly identify individuals without the disease. The accuracy of a diagnostic test is determined by comparing it to a gold standard test using a 2x2 table to calculate measures like sensitivity, specificity, and predictive values. The optimal test cutoff can be selected by considering the sensitivity and specificity at different cutoff levels or by examining the overall area under the receiver operating characteristic curve.
VALIDITY AND RELIABLITY OF A SCREENING TEST seminar 2.pptxShaliniPattanayak
?
A presentation shedding some insight into the tricky concepts of validity and reliability of any screening test, used in day-to-day lives, using easy and understandable language.
Advance concept of screening_Nabaraj PaudelNabaraj Paudel
?
This document provides an overview of advanced concepts in screening tests. It discusses sequential and parallel tests, sensitivity and specificity, positive and negative predictive values, ROC curves and their interpretation, and the Youden Index. Optimal cut-off points can be determined using points closest to (0,1) on the ROC curve, the Youden Index, or by minimizing total costs. Screening tests must balance test accuracy with costs and availability of treatment.
This document discusses the evaluation of diagnostic medical tests. It defines key concepts like sensitivity, specificity, predictive values, and likelihood ratios that are used to assess diagnostic accuracy and validity. Sensitivity refers to a test's ability to correctly identify those with the disease, while specificity refers to correctly identifying those without the disease. The document contrasts screening versus diagnostic tests and explores setting cut-off points for tests with continuous results. It also compares sequential versus simultaneous use of multiple tests.
The document discusses medical testing and how to interpret test results. It explains that all medical tests have limitations and can produce false positives or false negatives. It emphasizes that the sensitivity and specificity of a test must be determined based on appropriate study populations that represent the full spectrum of disease. Most importantly, predictive values are needed to properly interpret individual test results, as these take into account the likelihood of disease before the test.
This PPT will enable you to get a comprehensive understanding related to the topic, with examples. Important topic through research point of view. Simple language used, with a slide on distinguish, for better recap of the content.
Validity refers to how accurately a screening test measures a disease. Key measures of validity include sensitivity, specificity, and predictive value. Sensitivity measures the percentage of true positives, specificity measures the percentage of true negatives, and predictive value refers to the probability that the test result correctly identifies whether someone has the disease or not. The prevalence of a disease in a population also affects the predictive power of screening tests. Combining multiple screening tests can increase overall sensitivity and specificity for more accurate disease detection.
This document discusses diagnostic testing and key terms related to test accuracy. It defines sensitivity as the ability of a test to correctly identify those with a condition, and specificity as the ability to correctly identify those without a condition. Sensitivity answers what percentage of sick people a test identifies, while specificity answers what percentage of well people a test identifies as negative. Predictive values depend on disease prevalence in the population and indicate the likelihood a positive or negative test result is correct. High sensitivity means fewer false negatives, while high specificity means fewer false positives.
The document discusses evaluating diagnostic tests and summarizes key points in 3 sentences:
Diagnostic tests are evaluated based on their sensitivity, specificity, predictive values, and likelihood ratios to determine how well they identify disease when compared to a gold standard test. The performance of diagnostic tests depends on the prior probability or prevalence of the disease in the population being tested. Receiver operating characteristic (ROC) curves can be used to visualize and compare the performance of diagnostic tests by plotting the true positive rate against the false positive rate at various threshold settings.
1. The document summarizes key concepts in diagnostic test accuracy including sensitivity, specificity, predictive values, prevalence, and likelihood ratios.
2. It discusses ROC curves and how they are used to compare diagnostic tests by assessing the area under the curve.
3. Issues around bias in studies of diagnostic accuracy are covered such as spectrum, verification, and incorporation bias.
Screening tests are used to detect disease or risk factors for disease in asymptomatic individuals. They differ from diagnostic tests in that they test large groups of people rather than single individuals, are less accurate but less expensive, and are not intended to conclusively diagnose disease. Successful screening programs require the disease to be an important public health problem, screening and early intervention to improve outcomes, reliable and valid screening tests that are safe, acceptable and cost-effective, and availability of diagnostic services and treatment for positive cases. Sensitivity measures the test's ability to correctly identify those with disease while specificity measures its ability to correctly identify those without disease. Both have implications for the predictive values of screening tests.
(20180524) vuno seminar roc and extensionKyuhwan Jung
?
This document discusses receiver operating characteristic (ROC) curves and their use in evaluating diagnostic tests. It begins by defining sensitivity and specificity as metrics for diagnostic test performance. It then explains that ROC curves plot the sensitivity vs 1-specificity for varying diagnostic thresholds. The area under the ROC curve (AUC) provides a single measure of test accuracy. Methods for calculating AUC include parametric and nonparametric approaches. The document also discusses extensions of ROC analysis like free-response ROC (FROC) curves which evaluate tests with multiple lesion detections. It concludes by outlining a study that used JAFROC analysis to evaluate the effect of a computer-aided detection (CAD) system on radiologist performance in detecting lung nodules on
This document discusses key concepts regarding diagnostic and screening tests. It covers validity measures like sensitivity, specificity, predictive values, and receiver operating characteristic curves. It also addresses reliability through percent agreement and kappa statistics. The document contrasts sequential versus simultaneous use of multiple tests and examines how prevalence impacts predictive values. Finally, it outlines important factors for evaluating screening tests such as disease characteristics, test properties, and societal considerations.
This document discusses screening and diagnostic tests. It defines screening and diagnostic tests as tools used to distinguish people who have a disease from those who do not. The quality and accuracy of these tests is important to understand. Tests are evaluated based on their sensitivity, specificity, predictive values, and likelihood ratios compared to a gold standard. Factors like disease prevalence can impact predictive values. Receiver operating characteristic curves are used to evaluate test performance across all thresholds. Screening tests aim to identify disease early but must account for biases and show effectiveness of interventions.
Epidemiological method to determine utility of a diagnostic testBhoj Raj Singh
?
The usefulness of diagnostic tests, that is their ability to detect a person with disease or exclude a person without disease, is usually described by terms such as sensitivity, specificity, positive predictive value and negative predictive value (NPV). Many clinicians are frequently unclear about the practical application of these terms (1). The traditional method for teaching these concepts is based on the 2 × 2 table (Table 1). A 2 × 2 table shows results after both a diagnostic test and a definitive test (gold standard) have been performed on a pre-determined population consisting of people with the disease and those without the disease. The definitions of sensitivity, specificity, positive predictive value and NPV as expressed by letters are provided in Table 1. While 2 × 2 tables allow the calculations of sensitivity, specificity and predictive values, many clinicians find it too abstract and it is difficult to apply what it tries to teach into clinical practice as patients do not present as ‘having disease’ and ‘not having disease’. The use of the 2 × 2 table to teach these concepts also frequently creates the erroneous impression that the positive and NPVs calculated from such tables could be generalized to other populations without regard being paid to different disease prevalence. New ways of teaching these concepts have therefore been suggested.
Diagnostic, screening tests, differences and applications and their characteristics, four pillars of screening tests, sensitivity, specificity, predictive values and accuracy
Sensitivity, specificity and likelihood ratiosChew Keng Sheng
?
A short tutorial on sensitivity, specificity and likelihood ratios. In this presentation, I demonstrate why likelihood ratios are better parameters compared to sensitivity and specificity in real world setting.
This document provides an overview of diagnostic testing and assessing diagnostic accuracy. It defines key concepts like sensitivity, specificity, predictive values, and likelihood ratios. Sensitivity measures the ability of a test to detect true positives, or people with the disease. Specificity measures the ability to detect true negatives, or people without the disease. Positive and negative predictive values depend on disease prevalence and estimate the probability of actual disease given a test result. Likelihood ratios quantify how much a test result changes the odds of disease. The document uses examples to demonstrate calculating and interpreting these performance measures.
How to read a receiver operating characteritic (ROC) curveSamir Haffar
?
1) The document discusses how to evaluate the accuracy of diagnostic tests using receiver operating characteristic (ROC) curves.
2) ROC curves plot the sensitivity of a test on the y-axis against 1-specificity on the x-axis. The area under the ROC curve (AUC) provides an overall measure of a test's accuracy, with higher values indicating better accuracy.
3) The document uses ferritin testing to diagnose iron deficiency anemia (IDA) in the elderly as a case example. The AUC for ferritin was found to be 0.91, indicating it is an excellent test for diagnosing IDA.
When diagnosing a patient's problem, doctors consider clinical data and diagnostic test results. The use of diagnostic tests is increasing due to availability and new technology, though diagnostic techniques are less rigorously evaluated than treatments. For a new diagnostic test to be relevant, it must be feasible for the community and accurately diagnose the patient's condition compared to a gold standard reference. Validity is determined by comparing the test to an acceptable reference standard using a sample of over 100 patients with an appropriate range of diseases. Sensitivity and specificity are important metrics but must be interpreted with likelihood ratios which convey how much a positive or negative test result changes the probability of disease.
Evidence based medicine is now focusing on diagnostic tests: how accurate and useful could be ? sensitivity and specificity are no longer the important criteria for a test
Cost sheet. with basics and formats of sheetsupreetk82004
?
Cost sheet. with basics and formats of sheetCost sheet. with basics and formats of sheetCost sheet. with basics and formats of sheetCost sheet. with basics and formats of sheetCost sheet. with basics and formats of sheetCost sheet. with basics and formats of sheetCost sheet. with basics and formats of sheetCost sheet. with basics and formats of sheetCost sheet. with basics and formats of sheetCost sheet. with basics and formats of sheetCost sheet. with basics and formats of sheetCost sheet. with basics and formats of sheetCost sheet. with basics and formats of sheetCost sheet. with basics and formats of sheetCost sheet. with basics and formats of sheet
Boosting MySQL with Vector Search Scale22X 2025.pdfAlkin Tezuysal
?
As the demand for vector databases and Generative AI continues to rise, integrating vector storage and search capabilities into traditional databases has become increasingly important. This session introduces the *MyVector Plugin*, a project that brings native vector storage and similarity search to MySQL. Unlike PostgreSQL, which offers interfaces for adding new data types and index methods, MySQL lacks such extensibility. However, by utilizing MySQL's server component plugin and UDF, the *MyVector Plugin* successfully adds a fully functional vector search feature within the existing MySQL + InnoDB infrastructure, eliminating the need for a separate vector database. The session explains the technical aspects of integrating vector support into MySQL, the challenges posed by its architecture, and real-world use cases that showcase the advantages of combining vector search with MySQL's robust features. Attendees will leave with practical insights on how to add vector search capabilities to their MySQL
Data Science Lectures Data Science Lectures Data Science Lectures Data Science Lectures Data Science Lectures Data Science Lectures Data Science Lectures Data Science Lectures Data Science Lectures Data Science Lectures Data Science Lectures Data Science Lectures
Analyzing Consumer Spending Trends and Purchasing Behavioromololaokeowo1
?
This project explores consumer spending patterns using Kaggle-sourced data to uncover key trends in purchasing behavior. The analysis involved cleaning and preparing the data, performing exploratory data analysis (EDA), and visualizing insights using ExcelI. Key focus areas included customer demographics, product performance, seasonal trends, and pricing strategies. The project provided actionable insights into consumer preferences, helping businesses optimize sales strategies and improve decision-making.
The truth behind the numbers: spotting statistical misuse.pptxandyprosser3
?
As a producer of official statistics, being able to define what misinformation means in relation to data and statistics is so important to us.
For our sixth webinar, we explored how we handle statistical misuse especially in the media. We were also joined by speakers from the Office for Statistics Regulation (OSR) to explain how they play an important role in investigating and challenging the misuse of statistics across government.
Design Data Model Objects for Analytics, Activation, and AIaaronmwinters
?
Explore using industry-specific data standards to design data model objects in Data Cloud that can consolidate fragmented and multi-format data sources into a single view of the customer.
Design of the data model objects is a critical first step in setting up Data Cloud and will impact aspects of the implementation, including the data harmonization and mappings, as well as downstream automations and AI processing. This session will provide concrete examples of data standards in the education space and how to design a Data Cloud data model that will hold up over the long-term as new source systems and activation targets are added to the landscape. This will help architects and business analysts accelerate adoption of Data Cloud.
3. Introduction to ROC curves
? ROC = Receiver Operating Characteristic
? Started in electronic signal detection
theory (1940s - 1950s)
? Has become very popular in biomedical
applications, particularly radiology and
imaging
? Also used in machine learning applications to
assess classifiers
? Can be used to compare tests/procedures
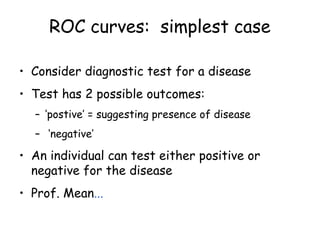
4. ROC curves: simplest case
? Consider diagnostic test for a disease
? Test has 2 possible outcomes:
– ‘postive’ = suggesting presence of disease
– ‘negative’
? An individual can test either positive or
negative for the disease
? Prof. Mean...
5. Hypothesis testing refresher
? 2 ‘competing theories’ regarding a population
parameter:
– NULL hypothesis H (‘straw man’)
– ALTERNATIVE hypothesis A (‘claim’, or
theory you wish to test)
? H: NO DIFFERENCE
– any observed deviation from what we
expect to see is due to chance variability
? A: THE DIFFERENCE IS REAL
6. Test statistic
? Measure how far the observed data are from
what is expected assuming the NULL H by
computing the value of a test statistic (TS)
from the data
? The particular TS computed depends on the
parameter
? For example, to test the population mean ?,
the TS is the sample mean (or standardized
sample mean)
? The NULL is rejected fi the TS falls in a
user-specified ‘rejection region’
7. True disease state vs. Test result
not rejected rejected
No disease
(D = 0)
?
specificity
X
Type I error
(False +) ?
Disease
(D = 1)
X
Type II error
(False -) ?
?
Power 1 - ?;
sensitivity
Disease
Test
18. Best Test: Worst test:
True
Positive
Rate
0
%
100%
False Positive
Rate
0
%
100
%
True
Positive
Rate
0
%
100%
False Positive
Rate
0
%
100
%
The distributions
don’t overlap at all
The distributions
overlap completely
ROC curve extremes
19. ‘Classical’ estimation
? Binormal model:
– X ~ N(0,1) in nondiseased population
– X ~ N(a, 1/b) in diseased population
? Then
ROC(t) = ?(a + b?-1
(t)) for 0 < t < 1
? Estimate a, b by ML using readings from
sets of diseased and nondiseased patients
20. ROC curve estimation with
continuous data
? Many biochemical measurements are in fact
continuous, e.g. blood glucose vs. diabetes
? Can also do ROC analysis for continuous (rather
than binary or ordinal) data
? Estimate ROC curve (and smooth) based on
empirical ‘survivor’ function (1 – cdf) in
diseased and nondiseased groups
? Can also do regression modeling of the test
result
? Another approach is to model the ROC curve
directlyas a function of covariates
21. Area under ROC curve (AUC)
? Overall measure of test performance
? Comparisons between two tests based on
differences between (estimated) AUC
? For continuous data, AUC equivalent to Mann-
Whitney U-statistic (nonparametric test of
difference in location between two
populations)
23. Interpretation of AUC
? AUC can be interpreted as the probability
that the test result from a randomly chosen
diseased individual is more indicative of
disease than that from a randomly chosen
nondiseased individual: P(Xi ? Xj | Di = 1, Dj = 0)
? So can think of this as a nonparametric
distance between disease/nondisease test
results
24. Problems with AUC
? No clinically relevant meaning
? A lot of the area is coming from the range of
large false positive values, no one cares what’s
going on in that region (need to examine
restricted regions)
? The curves might cross, so that there might
be a meaningful difference in performance
that is not picked up by AUC
25. Examples using ROC analysis
? Threshold selection for ‘tuning’ an already
trained classifier (e.g. neural nets)
? Defining signal thresholds in DNA microarrays
(Bilban et al.)
? Comparing test statistics for identifying
differentially expressed genes in replicated
microarray data (L?nnstedt and Speed)
? Assessing performance of different protein
prediction algorithms (Tang et al.)
? Inferring protein homology (Karwath and King)
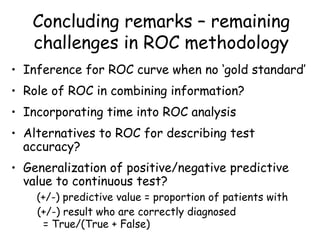
27. Concluding remarks – remaining
challenges in ROC methodology
? Inference for ROC curve when no ‘gold standard’
? Role of ROC in combining information?
? Incorporating time into ROC analysis
? Alternatives to ROC for describing test
accuracy?
? Generalization of positive/negative predictive
value to continuous test?
(+/-) predictive value = proportion of patients with
(+/-) result who are correctly diagnosed
= True/(True + False)