Scl 3401
0 likes41 views
This document outlines a group assignment for an introduction to statistics and data analysis course. Students will analyze data on 143 fish contaminated by toxic discharges from a chemical plant. The data includes the species, length, weight, and DDT level of each fish. Students must calculate measures of central tendency and variability for DDT levels and weights. They must also construct graphical displays like stem-and-leaf plots, dot plots, boxplots, relative frequency distributions, and histograms to analyze and compare the data.
1 of 1
Download to read offline
Recommended
Transforming data for inference
Transforming data for inferenceamylute
Ėý
Transforming data involves changing the scale of measurement used to collect data in order to better model relationships between variables. For example, when modeling the relationship between length and weight of fish, a power model using length cubed better fits the data than a linear model, since weight is related to the cube of length. The marine lab provided reference data that was used to find the least-squares regression line equation to predict fish weights based on their lengths.Aspects of the biology of african moony, monodactylus sebae from badagry cree...
Aspects of the biology of african moony, monodactylus sebae from badagry cree...Alexander Decker
Ėý
The document summarizes a study on the biology of the African moony fish (Monodactylus sebae) in Badagry Creek, Lagos, Nigeria. A total of 267 fish were collected from May 2012 to April 2013. The fish lengths ranged from 56-163 mm and weights ranged from 5.6-151.7 g. The length-weight relationship showed negative allometric growth. The condition factor was higher in females than males. The sex ratio was approximately 1:1 male to female.Presentation1 (3)
Presentation1 (3)Kirby Karpan
Ėý
This study analyzed variability in vertebral length among ecologically diverse populations of threespine stickleback fish. The researchers measured vertebral length and body length from x-rays of over 20 stickleback populations. They found that vertebral length declines along the vertebral column from front to back. Populations with longer bodies tended to have longer vertebrae. Limnetic populations in deep lakes had longer vertebrae than benthic/stream populations. Vertebral length also decreased with increasing vertebral number. Overall, the study uncovered patterns of vertebral length variation between stickleback populations adapted to different environments.An analysis of mortality events of the West Indian manatee
An analysis of mortality events of the West Indian manateeKatherine Saalbach
Ėý
This study analyzed data on watercraft-related deaths of West Indian manatees in Florida's coastal waters from 1974 to 2013 to determine which shipping ports correlated with the highest number of collisions. The results showed that watercraft collisions caused the majority of manatee deaths, and certain ports like Jacksonville, Tampa, and Miami had significant numbers of deaths within 10 miles. While manatee deaths have been increasing overall, some mitigation efforts around high-risk ports could help protect this threatened species from its most significant cause of mortality.Acl
Acljfroeschke
Ėý
This document discusses the calculation of acceptable biological catches (ABCs) for tier 3 Gulf of Mexico reef fish species using historical landings data. It notes that recreational landings estimates have been recalculated using MRIP data from 2004-2011, which are considered the best available scientific data. ABCs are recalculated based on these MRIP data for several species and species groups, including shallow-water grouper, deep-water grouper, tilefishes, jacks, and mid-water snapper. Changes to the ABCs are expected to minimally impact recreational fishing but could affect allowable commercial harvest.invertposter
invertposterRobert Gerzsik
Ėý
This study assessed water quality in Mormon Coulee Creek in Wisconsin by collecting Ephemeroptera, Plecoptera, and Trichoptera (EPT) insects from tile traps in the creek over three collection periods. EPT numbers were highest near the headwaters and declined further downstream, indicating higher water quality upstream. Substrate type also influenced EPT numbers, with more found in areas with pebble and cobble substrate. Overall, the data suggests that regions furthest from the mouth have the highest water quality, declining with increased distance from the headwaters.Length-weight relationship, condition factor and proportionality index of two...
Length-weight relationship, condition factor and proportionality index of two...Innspub Net
Ėý
The length-weight relationship, condition factor and proportionality index of Callinectes amnicola and Cardisoma armatum from EbriÃĐ Lagoon, Grand-Bassam, CÃīte dâIvoire, were studied. The carapace width and length were measured to the nearest millimeter (mm) while weight was measured to the nearest grams (g). The length-weight relationship of all samples collected were determined for the various sexes and mixed populations. The values of the exponent âbâ for all the sexes and mixed populations ranged from 2.01-2.69. The growth generally exhibited negative allometry in all the sexes and mixed populations. The proportionality index showed that Cardisoma armatum was longer and Callinectes amnicola was wider. Texture Classification of Sea Turtle Shell based on Color Features: Color His...
Texture Classification of Sea Turtle Shell based on Color Features: Color His...ijaia
Ėý
A collaborative system for cataloging sea turtles activity that supports picture/video content demands
automated solutions for data classification and analysis. This work assumes that the color
characteristics of the carapace are sufficient to classify each species of sea turtles, unlikely to the
traditional method that classifies sea turtles manually based on the counting of their shell scales,
and the shape of their head. Particularly, the aim of this study is to compare two features extraction
techniques based on color, Color Histograms and Chromaticity Moments, combined with two classification
methods, K-nearest neighbors (KNN) and Support Vector Machine (SVM), identifying
which combination of techniques has a higher effectiveness rate for classifying the five species of
sea turtles found along the Brazilian coast. The results showed that the combination using Chromaticity
Moments with the KNN classifier presented quantitatively better results for most species
of turtles with global accuracy value of 0.74 and accuracy of 100% for the Leatherback sea turtle,
while the descriptor of Color Histograms proved to be less precise, independent of the classifier.
This work demonstrate that is possible to use a statistical approach to assist the job of a specialist
when identifying species of sea turtle.Sweet et al._LTER-ver5-2015
Sweet et al._LTER-ver5-2015Shannan Sweet
Ėý
This study developed empirical models to predict canopy arthropod biomass in arctic tundra based on measurements of the normalized difference vegetation index (NDVI). Models were created using data across four growing seasons and four distinct tundra vegetation communities in Alaska. The overall model, across all communities, explained 63% of variance in arthropod biomass. Models for individual communities explained 74-87% of variance. This research shows NDVI can quantify spatial and temporal dynamics of arthropod biomass, and lays groundwork for using air and satellite data to assess arthropod communities at larger scales.Epigenetic variation in seagrass clones
Epigenetic variation in seagrass clonesAlexander Jueterbock
Ėý
1) The study analyzed epigenetic variation in shoots from a 1000-year old clone of the seagrass Zostera marina in the Baltic Sea.
2) While all 34 shoots sampled along a 250m transect were genetically identical based on microsatellite analysis, they showed epigenetic differences in cytosine methylation patterns.
3) Epigenetic variation between shoots was independent of their distance from shore and not correlated with geographic distance, suggesting epigenetic variation is not spatially structured within this clonal meadow.Morphometric study of banded gourami (Colisa fasciata) in Jessore, Bangladesh
Morphometric study of banded gourami (Colisa fasciata) in Jessore, BangladeshAbdullaAlAsif1
Ėý
Population morphometry including population demography, size group distribution, length weight relationship and sex ratio of an important freshwater fish, Colisafasciata was studied which collected fromJessore and Jhenaidah districts in Bangladesh during May, 2014 to April, 2015. Random samples of 201 individuals (108males and 93 females) were collected from different fish markets in Jessore (Monirampur, Borobazar, Chowgasa) and Jhenaidah (Mohespur, Barobazar, Kotchandpur) districst. The mean size of the specimen was recorded 65.08 Âą14.32 mm in length and 7.43 Âą3.09 g in body weight. Females were found little smaller than males. The specimens were larger in winter than summer and monsoon season. But in monsoon season the females were larger than males. The maximum length of the specimen collected from Jhenaidah district was smaller compare to the specimen of Jessore district. Most of the population (29%) was observed under 55-64 mm size class. Linear relationship was obtained between the log length (mm) and log weight (g) of the species in respects of sexes, seasons, and districts. The allometric coefficient âbâ of the relationship indicated negative allometric growth of the species as âbâ value was less than 3. The overall sex ratio (male: female=1:0.86)showed significant difference from the expected value 1:1. Overall males showed non-significant over females (Ï2 =1.119) in all season of both districts but in November males showed the significant (P<0.01) dominance over females. However, the findings of the present study have helped us to understand more about the species is the prerequisites in fishery management strategy and culture system.
Tarnecki et al., 2016
Tarnecki et al., 2016Joe Tarnecki
Ėý
This document describes the development of a food web matrix for the Gulf of Mexico based on combining diet data from various sources. Predators and prey were grouped into 48 functional groups. Diet data from multiple studies were statistically analyzed using Dirichlet distributions to quantify the likely contributions of prey to predator diets and the associated error ranges. A hierarchical cluster analysis was performed to identify functional groups with similar diets. The revised food web was then compared to other published Gulf of Mexico food webs. Finally, an ecosystem model simulation using the revised diet matrix showed improved model fits compared to using the previous diet matrix.Sweet et al._LTER-ver5-2015
Sweet et al._LTER-ver5-2015Shannan Sweet
Ėý
This study developed empirical models to predict canopy arthropod biomass in arctic tundra based on measurements of the normalized difference vegetation index (NDVI). Models were created using data from four distinct tundra vegetation communities in Alaska collected over four growing seasons. The overall model, which included all communities, explained 63% of the variance in arthropod biomass. Community-specific models explained 74-87% of variance. Seasonal patterns in both the NDVI and arthropod biomass varied among communities. Relationships between the NDVI and measured arthropod biomass improved when examined separately for each community.SCAS Poster Seagrass FINAL
SCAS Poster Seagrass FINALKali Staniec
Ėý
The study aimed to establish a relationship between juvenile kelp bass populations and eelgrass habitat in an MPA offshore of Catalina Island. Monthly surveys over 8 months found that kelp bass abundance increased with greater eelgrass density and length, indicating eelgrass beds promote robust fish stocks. While kelp bass numbers were not directly correlated with eelgrass abundance, seasonal changes in abundance may reflect an ontogenetic shift. Kelp bass biomass increased over time as abundance declined, consistent with their spawning cycle. Overall, the data provides a basis for further investigating how eelgrass coverage influences fish productivity in MPAs.Estimating and Classifying Spatial and Temporal Distributions of Flow Conditi...
Estimating and Classifying Spatial and Temporal Distributions of Flow Conditi...Beniamino Murgante
Ėý
Estimating and Classifying Spatial and Temporal Distributions of Flow Conditions for Fish Habitats by Using Geostatistical Approaches with Measured Flow and Fish Data, Lin Yu-Pin, Wang Cheng-LongFish Population Dynamics Lab
Fish Population Dynamics LabZakiur
Ėý
This document outlines a practical lab on fish population dynamics. It includes definitions of key terms like fish population dynamics, stock, and gonosomatic index. It also describes several common methods to estimate fish population parameters and stock abundance, like mark-recapture methods, depletion methods, and sampling surveys. Specific questions ask students to calculate growth parameters, length-weight relationships, population estimates, and compare models like the von Bertalanffy and Ford-Walford plots used for growth estimation. The document provides data to help students complete calculations and analysis for the lab.Using high-level identification of macroinvertebrates for pollution assessmen...
Using high-level identification of macroinvertebrates for pollution assessmen...International journal of scientific and technical research in engineering (IJSTRE)
Ėý
Although surveys of soft-bottom macrofauna are an important tool in assessing marine pollution,
identifying organisms to the species level is time-consuming and therefore costly. One solution is to identify
organisms to a higher taxonomic level. This study, using data from macrobenthic surveys in Gamak Bay, on the
southern coast of Korea, shows that abundances measured at higher taxonomic levels than species can be
adequate for pollution assessments. 'Second-stage' MDS and 'BIO-ENV' showed that aggregation of data to the
level of family produces results that are close to those based on species-level identification. In severely polluted
areas, a W statistic based on order-level aggregation was identical to that produced by species-level
identification.Although these results could be used to make a general recommendation that the family level, at
least, is a suitable level for faunal identification in pollution assessments, this will to a large extent depend on
the objectives of each individual investigation. In surveys to assess pollution, nonetheless, analyzing the benthic
community at a higher taxonomic level than species is efficient and cost-effective, and is sufficient to accomplish
the assessmentâs objective.LackawannaTAG_FinalReport_Sept2012
LackawannaTAG_FinalReport_Sept2012Cheryl A. Nolan
Ėý
The document provides background information on a biological survey of the Lackawanna River watershed in Pennsylvania that was conducted to assess habitat quality, benthic macroinvertebrate communities, and fish populations at 12 sampling sites. Habitat quality generally declined from optimal or suboptimal ratings upstream to marginal or poor ratings downstream. Benthic metrics and IBI scores also decreased downstream, indicating some sites did not meet standards for aquatic life. A total of 15 fish species were observed but abundances could not be determined due to sampling limitations. Overall, the study found declining biological conditions from upstream to downstream sites in the watershed.112.3 A feeling for the numbers microbes as the unseen ma.docx
112.3 A feeling for the numbers microbes as the unseen ma.docxmoggdede
Ėý
11
2.3 A feeling for the numbers: microbes as the unseen majority
(a) Use Figure 2.1 to justify the assumption that a typical bacterial cell (that
is, E. coli) has a surface area of 6Âĩm2 and a volume of 1Âĩm3. Also, express
this volume in femtoliters. Make a corresponding estimate of the mass of such
a bacterium.
(b) Roughly 2â3 kg of bacteria are harbored in your large intestine. Make an
estimate of the total number of bacteria inhabiting your intestine. Estimate
the total number of human cells in your body and compare the two figures.
(c) The claim is made (see Whitman et al., 1998) that in the top 200m of
the worldâs oceans, there are roughly 1028 prokaryotes. Work out the total
volume taken up by these cells in m3 and km3. Compute their mean spacing.
How many such cells are there per milliliter of ocean water?
(a) E. coli has (roughly) the shape of a cylinder that is 2 Âĩm in length and 0.5 Âĩm
in radius. For those that are so inclined, the bacterium can alternatively be
treated as a spherocylinder, though the results will not change in any interesting
way. Using these numbers we calculate the area of an E. coli to be:
Acell = ⥠âĨ 1 ÂĩmâĨ 2 Âĩm ⥠6 Âĩm2. (2.28)
Its volume is:
Vcell = ⥠âĨ
â
1
2
Âĩm
â2
âĨ (2Âĩm) ⥠1Âĩm3 (2.29)
= 1 fL. (2.30)
If we assume that the density of a bacterium is the same as that of water, the
mass of one bacterium is 103kg/m3 âĨ 10ïŋ―18 m3 ⥠10ïŋ―15 kg = 1 pg.
(b) The fact that each bacterium has a mass of 1 pg implies that 2ïŋ―3 kg worth
of bacteria in the intestines of one person amounts to 2 â 3âĨ 1015 bacteria.
Assume that the size of a typical human cell is roughly 10 Âĩm in diameter and
has a spherical shape with the same density as that of water. Letâs assume that
the mass of a âtypicalâ human body is roughly 80 kg. Further, letâs assume
that thirty percent of the human mass corresponds to cells. On the basis of
these assumptions, we find that the number of the cells in a human body is
approximately
Mhuman
VcellâĒH2O
=
1
3 âĨ 80 kg
4/3⥠âĨ (5âĨ 10ïŋ―6 m)3 âĨ 1000 kg/m3
' 5âĨ 1013. (2.31)
By this estimate, the number of bacterial cells outnumbers the number of human
cells by more than a factor of ten.
(c) Using (a) we can estimate the volume of 1028 prokaryotes to be about
10ïŋ―18 m3 âĨ 1028 = 1010 m3, which is equal to 10 km3.
HW 1
27
section of this cylinder with the same cross-sectional area. The schematic of
the mature virion in fig. 2.31(C) shows that the CA proteins come together to
form the capsid with inward pointing âspokes,â in the same way that the GAG
polyproteins form the initial outer shell of the virion. This means that CA and
GAG have the same surface areas per protein. Because the surface area of the
capsid is less than that of the virion and because each CA protein is cleaved oâĩ
a GAG polyprotein, this fact immediately implies that not all the CA proteins
can be used up to form the capsid.
From the micrographs, the capsid can be approximated as a cone with base
radius r = 25 nm and side length s = 1 ...1996 hossainfs62 350 (2)
1996 hossainfs62 350 (2)Dr Moazzem Hossain
Ėý
The document summarizes a study on the density, biomass, and community structure of megabenthos in Ise Bay, Japan from 1993 to 1994. Five species dominated the megabenthos communities: Oratosquilla oratoria, Carcinoplax vestita, Charybdis bimaculata, Luidia quinaria, and Repomucenus valenciennei. The community structure changed seasonally, closely related to the development and disappearance of low-oxygen water in the bay each summer. A total of 132 megabenthos species were identified, with crustaceans, mollusks, echinoderms, and fishes being the most commonRe-evaluating models to take on new challenges in ecology and evolution
Re-evaluating models to take on new challenges in ecology and evolutionLiliana Davalos
Ėý
This document discusses models used to analyze ecological and evolutionary relationships in the Caribbean region. It summarizes species-area relationships for three Caribbean archipelagos at the last glacial maximum and present day, finding highly significant relationships. It also examines how changes in species numbers relate to changes in island area from the last glacial maximum to present. Additionally, it analyzes evolutionary relationships among bat species based on DNA sequences and anatomical features, finding some discordant relationships. The document explores various models for understanding these relationships and incorporating multiple data types.Size distribution and biometric relationships of little tunny Euthynnus allet...
Size distribution and biometric relationships of little tunny Euthynnus allet...inventy
Ėý
This study is taken from data of commercial fishing of the little tunny, Euthynnus alletteratus (Rafinesque, 1810) caught in the Algerian coast, sampled between november 2011 and april 2016. Data were collected in order to determine size distributions of the population and biometric relationships of species including the size - weight relationships. A total of 601 fish ranged from 30.9 and 103 cm fork length (FL) were observed. The size distribution of Euthynnus alletteratus shows multiple modal values witch the most important cohort corresponds to the age class 2 (42-46 cm). The value of the allometric coefficient (b) of the FL/TW relationship is lower than 3, indicating a negative allometric growth.Lab3
Lab3joy000 renojo
Ėý
This document provides instructions for conducting point-centered quarter sampling to compare upper and lower slope forest communities. Students will establish transects with sampling points along upper and lower slopes. At each point, they will identify the nearest tree and sapling in each quarter and record species, distance, and diameter. Students will then calculate diversity indices and importance values to determine if species composition differs between slopes and how the future community may change. Results will be presented in tables and figures comparing community structure across slopes.fsac229.pdf
fsac229.pdfAproximacionAlFuturo
Ėý
Effects of fishing on the trophic structure of carnivorous
fish assemblages from shallow rocky bottoms of the
Mediterranean Sea and the temperate Atlantic OceanComparative study of the estimated sample size for benthic intertidal species...
Comparative study of the estimated sample size for benthic intertidal species...Jose VÃĐlez Tacuri
Ėý
The study aimed to determine the minimum sample size needed for studies of benthic intertidal communities and dominant species at different heights on a rocky shore in Rio de Janeiro, Brazil. Sample size requirements varied depending on the height and criteria used. For community studies, minimum quadrat sizes ranged from 100-800 cm2, number of profiles from 2-8, and number of sampling points from 20-80 depending on the height. For dominant species, minimum quadrat sizes ranged from 100-800 cm2 depending on the species and height. Different sample sizes were required due to variations in species abundances and spatial distributions with height related to environmental stress.Southern Spirits
Southern SpiritsJulian Vesty
Ėý
This document summarizes revisions made to the distribution maps and database of New Zealand mayflies held at Canterbury Museum. Over 10,800 records from 161 collectors were incorporated, largely based on the museum's collection. Distribution maps for 39 previously mapped species now include many additional data points. Eleven newly described species also have new distribution maps. The database is being expanded to include uncertainty estimates for location data and specimens are being added to the museum's collection management system. Some mayfly species, such as Aupouriella pohei and Nesameletus vulcanus, appear to have sufficiently restricted distributions that they may be potentially endangered.Population dynamics of 15 fish species in Grand-Lahou lagoon (West Africa, CÃī...
Population dynamics of 15 fish species in Grand-Lahou lagoon (West Africa, CÃī...Open Access Research Paper
Ėý
This study described growth, mortality, recruitment patterns and exploitation rates of 15 fish species in Grand-Lahou lagoon (CÃīte dâIvoire). Monthly length-frequency data collected from artisanal fisheries from November 2013 to October 2014 were analyzed with FiSAT software using the ELEFAN package to estimate the population parameters of fishes. Asymptotic values for total length (Lâ) ranged from 15.75 cm for Synodontis schall to 59.80 cm for Trachinotus teraia. Growth rate (k) varied from 0.19 for Coptodon guineensis to 0.98 for Caranx hippos. The growth performance index estimates were close to the values found by other authors for most of the fish species. The total mortality (Z) high values were recorded for Synodontis schall (Z= 4.15 year-1; M = 2.50 year-1) Schilbe mandibularis (Z= 2.19 year-1; M=1.33 year-1). Fishing mortality (F) and exploitation rate (E) were found to be less than the optimum levels of exploitation for most fish species. The exploitation rate (E) was higher than the maximum sustainable yield (Emax) for Caranx hippos and higher than E0.5 for Eucinostomus melanopterus, Elops lacerta and Synodontis schall. Recruitment was noted as year-round and bimodal for most studied populations. These results demonstrate that some fish stocks necessitate effective management measures particularly C. hippos, E. melanopterus, E. lacerta and S. schall.
Science the hell out if - K. Stergiou
Science the hell out if - K. StergiouBlue BRIDGE
Ėý
K. Sergiou's presentation at Datathon for fisheries and aquaculture, 15-16 June, Heraklion, Crete.
www.bluebridge-vres.eu Mth3401 tutorial 1
Mth3401 tutorial 1SHALINIAPVIJAYAKUMAR
Ėý
This document provides an overview of graphical and descriptive methods for quantitative data analysis. It discusses histograms, ogives, stem-and-leaf plots, box plots, measures of location including mean, mode and median, and measures of variability such as variance, standard deviation, percentiles and coefficient of variation. These statistical techniques can be used to graphically display and describe the central tendency and spread of quantitative data.
More Related Content
Similar to Scl 3401 (20)
Sweet et al._LTER-ver5-2015
Sweet et al._LTER-ver5-2015Shannan Sweet
Ėý
This study developed empirical models to predict canopy arthropod biomass in arctic tundra based on measurements of the normalized difference vegetation index (NDVI). Models were created using data across four growing seasons and four distinct tundra vegetation communities in Alaska. The overall model, across all communities, explained 63% of variance in arthropod biomass. Models for individual communities explained 74-87% of variance. This research shows NDVI can quantify spatial and temporal dynamics of arthropod biomass, and lays groundwork for using air and satellite data to assess arthropod communities at larger scales.Epigenetic variation in seagrass clones
Epigenetic variation in seagrass clonesAlexander Jueterbock
Ėý
1) The study analyzed epigenetic variation in shoots from a 1000-year old clone of the seagrass Zostera marina in the Baltic Sea.
2) While all 34 shoots sampled along a 250m transect were genetically identical based on microsatellite analysis, they showed epigenetic differences in cytosine methylation patterns.
3) Epigenetic variation between shoots was independent of their distance from shore and not correlated with geographic distance, suggesting epigenetic variation is not spatially structured within this clonal meadow.Morphometric study of banded gourami (Colisa fasciata) in Jessore, Bangladesh
Morphometric study of banded gourami (Colisa fasciata) in Jessore, BangladeshAbdullaAlAsif1
Ėý
Population morphometry including population demography, size group distribution, length weight relationship and sex ratio of an important freshwater fish, Colisafasciata was studied which collected fromJessore and Jhenaidah districts in Bangladesh during May, 2014 to April, 2015. Random samples of 201 individuals (108males and 93 females) were collected from different fish markets in Jessore (Monirampur, Borobazar, Chowgasa) and Jhenaidah (Mohespur, Barobazar, Kotchandpur) districst. The mean size of the specimen was recorded 65.08 Âą14.32 mm in length and 7.43 Âą3.09 g in body weight. Females were found little smaller than males. The specimens were larger in winter than summer and monsoon season. But in monsoon season the females were larger than males. The maximum length of the specimen collected from Jhenaidah district was smaller compare to the specimen of Jessore district. Most of the population (29%) was observed under 55-64 mm size class. Linear relationship was obtained between the log length (mm) and log weight (g) of the species in respects of sexes, seasons, and districts. The allometric coefficient âbâ of the relationship indicated negative allometric growth of the species as âbâ value was less than 3. The overall sex ratio (male: female=1:0.86)showed significant difference from the expected value 1:1. Overall males showed non-significant over females (Ï2 =1.119) in all season of both districts but in November males showed the significant (P<0.01) dominance over females. However, the findings of the present study have helped us to understand more about the species is the prerequisites in fishery management strategy and culture system.
Tarnecki et al., 2016
Tarnecki et al., 2016Joe Tarnecki
Ėý
This document describes the development of a food web matrix for the Gulf of Mexico based on combining diet data from various sources. Predators and prey were grouped into 48 functional groups. Diet data from multiple studies were statistically analyzed using Dirichlet distributions to quantify the likely contributions of prey to predator diets and the associated error ranges. A hierarchical cluster analysis was performed to identify functional groups with similar diets. The revised food web was then compared to other published Gulf of Mexico food webs. Finally, an ecosystem model simulation using the revised diet matrix showed improved model fits compared to using the previous diet matrix.Sweet et al._LTER-ver5-2015
Sweet et al._LTER-ver5-2015Shannan Sweet
Ėý
This study developed empirical models to predict canopy arthropod biomass in arctic tundra based on measurements of the normalized difference vegetation index (NDVI). Models were created using data from four distinct tundra vegetation communities in Alaska collected over four growing seasons. The overall model, which included all communities, explained 63% of the variance in arthropod biomass. Community-specific models explained 74-87% of variance. Seasonal patterns in both the NDVI and arthropod biomass varied among communities. Relationships between the NDVI and measured arthropod biomass improved when examined separately for each community.SCAS Poster Seagrass FINAL
SCAS Poster Seagrass FINALKali Staniec
Ėý
The study aimed to establish a relationship between juvenile kelp bass populations and eelgrass habitat in an MPA offshore of Catalina Island. Monthly surveys over 8 months found that kelp bass abundance increased with greater eelgrass density and length, indicating eelgrass beds promote robust fish stocks. While kelp bass numbers were not directly correlated with eelgrass abundance, seasonal changes in abundance may reflect an ontogenetic shift. Kelp bass biomass increased over time as abundance declined, consistent with their spawning cycle. Overall, the data provides a basis for further investigating how eelgrass coverage influences fish productivity in MPAs.Estimating and Classifying Spatial and Temporal Distributions of Flow Conditi...
Estimating and Classifying Spatial and Temporal Distributions of Flow Conditi...Beniamino Murgante
Ėý
Estimating and Classifying Spatial and Temporal Distributions of Flow Conditions for Fish Habitats by Using Geostatistical Approaches with Measured Flow and Fish Data, Lin Yu-Pin, Wang Cheng-LongFish Population Dynamics Lab
Fish Population Dynamics LabZakiur
Ėý
This document outlines a practical lab on fish population dynamics. It includes definitions of key terms like fish population dynamics, stock, and gonosomatic index. It also describes several common methods to estimate fish population parameters and stock abundance, like mark-recapture methods, depletion methods, and sampling surveys. Specific questions ask students to calculate growth parameters, length-weight relationships, population estimates, and compare models like the von Bertalanffy and Ford-Walford plots used for growth estimation. The document provides data to help students complete calculations and analysis for the lab.Using high-level identification of macroinvertebrates for pollution assessmen...
Using high-level identification of macroinvertebrates for pollution assessmen...International journal of scientific and technical research in engineering (IJSTRE)
Ėý
Although surveys of soft-bottom macrofauna are an important tool in assessing marine pollution,
identifying organisms to the species level is time-consuming and therefore costly. One solution is to identify
organisms to a higher taxonomic level. This study, using data from macrobenthic surveys in Gamak Bay, on the
southern coast of Korea, shows that abundances measured at higher taxonomic levels than species can be
adequate for pollution assessments. 'Second-stage' MDS and 'BIO-ENV' showed that aggregation of data to the
level of family produces results that are close to those based on species-level identification. In severely polluted
areas, a W statistic based on order-level aggregation was identical to that produced by species-level
identification.Although these results could be used to make a general recommendation that the family level, at
least, is a suitable level for faunal identification in pollution assessments, this will to a large extent depend on
the objectives of each individual investigation. In surveys to assess pollution, nonetheless, analyzing the benthic
community at a higher taxonomic level than species is efficient and cost-effective, and is sufficient to accomplish
the assessmentâs objective.LackawannaTAG_FinalReport_Sept2012
LackawannaTAG_FinalReport_Sept2012Cheryl A. Nolan
Ėý
The document provides background information on a biological survey of the Lackawanna River watershed in Pennsylvania that was conducted to assess habitat quality, benthic macroinvertebrate communities, and fish populations at 12 sampling sites. Habitat quality generally declined from optimal or suboptimal ratings upstream to marginal or poor ratings downstream. Benthic metrics and IBI scores also decreased downstream, indicating some sites did not meet standards for aquatic life. A total of 15 fish species were observed but abundances could not be determined due to sampling limitations. Overall, the study found declining biological conditions from upstream to downstream sites in the watershed.112.3 A feeling for the numbers microbes as the unseen ma.docx
112.3 A feeling for the numbers microbes as the unseen ma.docxmoggdede
Ėý
11
2.3 A feeling for the numbers: microbes as the unseen majority
(a) Use Figure 2.1 to justify the assumption that a typical bacterial cell (that
is, E. coli) has a surface area of 6Âĩm2 and a volume of 1Âĩm3. Also, express
this volume in femtoliters. Make a corresponding estimate of the mass of such
a bacterium.
(b) Roughly 2â3 kg of bacteria are harbored in your large intestine. Make an
estimate of the total number of bacteria inhabiting your intestine. Estimate
the total number of human cells in your body and compare the two figures.
(c) The claim is made (see Whitman et al., 1998) that in the top 200m of
the worldâs oceans, there are roughly 1028 prokaryotes. Work out the total
volume taken up by these cells in m3 and km3. Compute their mean spacing.
How many such cells are there per milliliter of ocean water?
(a) E. coli has (roughly) the shape of a cylinder that is 2 Âĩm in length and 0.5 Âĩm
in radius. For those that are so inclined, the bacterium can alternatively be
treated as a spherocylinder, though the results will not change in any interesting
way. Using these numbers we calculate the area of an E. coli to be:
Acell = ⥠âĨ 1 ÂĩmâĨ 2 Âĩm ⥠6 Âĩm2. (2.28)
Its volume is:
Vcell = ⥠âĨ
â
1
2
Âĩm
â2
âĨ (2Âĩm) ⥠1Âĩm3 (2.29)
= 1 fL. (2.30)
If we assume that the density of a bacterium is the same as that of water, the
mass of one bacterium is 103kg/m3 âĨ 10ïŋ―18 m3 ⥠10ïŋ―15 kg = 1 pg.
(b) The fact that each bacterium has a mass of 1 pg implies that 2ïŋ―3 kg worth
of bacteria in the intestines of one person amounts to 2 â 3âĨ 1015 bacteria.
Assume that the size of a typical human cell is roughly 10 Âĩm in diameter and
has a spherical shape with the same density as that of water. Letâs assume that
the mass of a âtypicalâ human body is roughly 80 kg. Further, letâs assume
that thirty percent of the human mass corresponds to cells. On the basis of
these assumptions, we find that the number of the cells in a human body is
approximately
Mhuman
VcellâĒH2O
=
1
3 âĨ 80 kg
4/3⥠âĨ (5âĨ 10ïŋ―6 m)3 âĨ 1000 kg/m3
' 5âĨ 1013. (2.31)
By this estimate, the number of bacterial cells outnumbers the number of human
cells by more than a factor of ten.
(c) Using (a) we can estimate the volume of 1028 prokaryotes to be about
10ïŋ―18 m3 âĨ 1028 = 1010 m3, which is equal to 10 km3.
HW 1
27
section of this cylinder with the same cross-sectional area. The schematic of
the mature virion in fig. 2.31(C) shows that the CA proteins come together to
form the capsid with inward pointing âspokes,â in the same way that the GAG
polyproteins form the initial outer shell of the virion. This means that CA and
GAG have the same surface areas per protein. Because the surface area of the
capsid is less than that of the virion and because each CA protein is cleaved oâĩ
a GAG polyprotein, this fact immediately implies that not all the CA proteins
can be used up to form the capsid.
From the micrographs, the capsid can be approximated as a cone with base
radius r = 25 nm and side length s = 1 ...1996 hossainfs62 350 (2)
1996 hossainfs62 350 (2)Dr Moazzem Hossain
Ėý
The document summarizes a study on the density, biomass, and community structure of megabenthos in Ise Bay, Japan from 1993 to 1994. Five species dominated the megabenthos communities: Oratosquilla oratoria, Carcinoplax vestita, Charybdis bimaculata, Luidia quinaria, and Repomucenus valenciennei. The community structure changed seasonally, closely related to the development and disappearance of low-oxygen water in the bay each summer. A total of 132 megabenthos species were identified, with crustaceans, mollusks, echinoderms, and fishes being the most commonRe-evaluating models to take on new challenges in ecology and evolution
Re-evaluating models to take on new challenges in ecology and evolutionLiliana Davalos
Ėý
This document discusses models used to analyze ecological and evolutionary relationships in the Caribbean region. It summarizes species-area relationships for three Caribbean archipelagos at the last glacial maximum and present day, finding highly significant relationships. It also examines how changes in species numbers relate to changes in island area from the last glacial maximum to present. Additionally, it analyzes evolutionary relationships among bat species based on DNA sequences and anatomical features, finding some discordant relationships. The document explores various models for understanding these relationships and incorporating multiple data types.Size distribution and biometric relationships of little tunny Euthynnus allet...
Size distribution and biometric relationships of little tunny Euthynnus allet...inventy
Ėý
This study is taken from data of commercial fishing of the little tunny, Euthynnus alletteratus (Rafinesque, 1810) caught in the Algerian coast, sampled between november 2011 and april 2016. Data were collected in order to determine size distributions of the population and biometric relationships of species including the size - weight relationships. A total of 601 fish ranged from 30.9 and 103 cm fork length (FL) were observed. The size distribution of Euthynnus alletteratus shows multiple modal values witch the most important cohort corresponds to the age class 2 (42-46 cm). The value of the allometric coefficient (b) of the FL/TW relationship is lower than 3, indicating a negative allometric growth.Lab3
Lab3joy000 renojo
Ėý
This document provides instructions for conducting point-centered quarter sampling to compare upper and lower slope forest communities. Students will establish transects with sampling points along upper and lower slopes. At each point, they will identify the nearest tree and sapling in each quarter and record species, distance, and diameter. Students will then calculate diversity indices and importance values to determine if species composition differs between slopes and how the future community may change. Results will be presented in tables and figures comparing community structure across slopes.fsac229.pdf
fsac229.pdfAproximacionAlFuturo
Ėý
Effects of fishing on the trophic structure of carnivorous
fish assemblages from shallow rocky bottoms of the
Mediterranean Sea and the temperate Atlantic OceanComparative study of the estimated sample size for benthic intertidal species...
Comparative study of the estimated sample size for benthic intertidal species...Jose VÃĐlez Tacuri
Ėý
The study aimed to determine the minimum sample size needed for studies of benthic intertidal communities and dominant species at different heights on a rocky shore in Rio de Janeiro, Brazil. Sample size requirements varied depending on the height and criteria used. For community studies, minimum quadrat sizes ranged from 100-800 cm2, number of profiles from 2-8, and number of sampling points from 20-80 depending on the height. For dominant species, minimum quadrat sizes ranged from 100-800 cm2 depending on the species and height. Different sample sizes were required due to variations in species abundances and spatial distributions with height related to environmental stress.Southern Spirits
Southern SpiritsJulian Vesty
Ėý
This document summarizes revisions made to the distribution maps and database of New Zealand mayflies held at Canterbury Museum. Over 10,800 records from 161 collectors were incorporated, largely based on the museum's collection. Distribution maps for 39 previously mapped species now include many additional data points. Eleven newly described species also have new distribution maps. The database is being expanded to include uncertainty estimates for location data and specimens are being added to the museum's collection management system. Some mayfly species, such as Aupouriella pohei and Nesameletus vulcanus, appear to have sufficiently restricted distributions that they may be potentially endangered.Population dynamics of 15 fish species in Grand-Lahou lagoon (West Africa, CÃī...
Population dynamics of 15 fish species in Grand-Lahou lagoon (West Africa, CÃī...Open Access Research Paper
Ėý
This study described growth, mortality, recruitment patterns and exploitation rates of 15 fish species in Grand-Lahou lagoon (CÃīte dâIvoire). Monthly length-frequency data collected from artisanal fisheries from November 2013 to October 2014 were analyzed with FiSAT software using the ELEFAN package to estimate the population parameters of fishes. Asymptotic values for total length (Lâ) ranged from 15.75 cm for Synodontis schall to 59.80 cm for Trachinotus teraia. Growth rate (k) varied from 0.19 for Coptodon guineensis to 0.98 for Caranx hippos. The growth performance index estimates were close to the values found by other authors for most of the fish species. The total mortality (Z) high values were recorded for Synodontis schall (Z= 4.15 year-1; M = 2.50 year-1) Schilbe mandibularis (Z= 2.19 year-1; M=1.33 year-1). Fishing mortality (F) and exploitation rate (E) were found to be less than the optimum levels of exploitation for most fish species. The exploitation rate (E) was higher than the maximum sustainable yield (Emax) for Caranx hippos and higher than E0.5 for Eucinostomus melanopterus, Elops lacerta and Synodontis schall. Recruitment was noted as year-round and bimodal for most studied populations. These results demonstrate that some fish stocks necessitate effective management measures particularly C. hippos, E. melanopterus, E. lacerta and S. schall.
Science the hell out if - K. Stergiou
Science the hell out if - K. StergiouBlue BRIDGE
Ėý
K. Sergiou's presentation at Datathon for fisheries and aquaculture, 15-16 June, Heraklion, Crete.
www.bluebridge-vres.eu Estimating and Classifying Spatial and Temporal Distributions of Flow Conditi...
Estimating and Classifying Spatial and Temporal Distributions of Flow Conditi...Beniamino Murgante
Ėý
Using high-level identification of macroinvertebrates for pollution assessmen...
Using high-level identification of macroinvertebrates for pollution assessmen...International journal of scientific and technical research in engineering (IJSTRE)
Ėý
Comparative study of the estimated sample size for benthic intertidal species...
Comparative study of the estimated sample size for benthic intertidal species...Jose VÃĐlez Tacuri
Ėý
Population dynamics of 15 fish species in Grand-Lahou lagoon (West Africa, CÃī...
Population dynamics of 15 fish species in Grand-Lahou lagoon (West Africa, CÃī...Open Access Research Paper
Ėý
More from SHALINIAPVIJAYAKUMAR (10)
Mth3401 tutorial 1
Mth3401 tutorial 1SHALINIAPVIJAYAKUMAR
Ėý
This document provides an overview of graphical and descriptive methods for quantitative data analysis. It discusses histograms, ogives, stem-and-leaf plots, box plots, measures of location including mean, mode and median, and measures of variability such as variance, standard deviation, percentiles and coefficient of variation. These statistical techniques can be used to graphically display and describe the central tendency and spread of quantitative data.
Walpole ch01
Walpole ch01SHALINIAPVIJAYAKUMAR
Ėý
This document outlines chapters and sections from a statistics textbook. It introduces topics like statistical inference, measures of central tendency and variability, sampling procedures, discrete and continuous data, and different types of statistical studies. Examples and figures are provided to illustrate key concepts from the textbook such as using stem-and-leaf plots, box-and-whisker plots, and scatter plots to represent and analyze sample data. Copyright information is displayed at the beginning of each page.Walpole ch02
Walpole ch02SHALINIAPVIJAYAKUMAR
Ėý
This document contains a chapter on probability from a textbook. It includes definitions of key probability concepts like sample space, events, counting sample points, probability of events, conditional probability, independence, Bayes' rule. It contains examples and exercises demonstrating these concepts. Figures include tree diagrams, Venn diagrams and diagrams of systems to calculate probabilities.Walpole ch03 edit
Walpole ch03 editSHALINIAPVIJAYAKUMAR
Ėý
This chapter discusses random variables and probability distributions. It begins by defining a random variable and giving an example of counting the number of red balls drawn from an urn. The chapter then covers discrete and continuous probability distributions. Discrete distributions are defined and an example is given involving the number of cars with airbags sold from an inventory. The chapter illustrates probability mass functions, histograms, and cumulative distribution functions. It also introduces continuous distributions and defines probability density functions and cumulative distribution functions.Lecture 3 Penaksiran Akademik
Lecture 3 Penaksiran AkademikSHALINIAPVIJAYAKUMAR
Ėý
This document discusses classroom assessment and authentic assessment. It begins with a glossary of key terms and then discusses integrating needs analysis and authentic assessment. Authentic assessment involves real-world tasks that demonstrate application of essential knowledge and skills. It describes the four steps of authentic assessment and compares traditional and authentic assessment. Authentic assessment drives the curriculum by first determining tasks students will perform to demonstrate mastery. The document then covers defining attributes, alternative names, benefits, and types of authentic tasks including constructed response, products, and performances. It concludes by discussing rubrics and portfolios as assessment tools.Lecture 2 Penaksiran Akademik
Lecture 2 Penaksiran AkademikSHALINIAPVIJAYAKUMAR
Ėý
Teachers play many roles in realizing the National Philosophy of Education, including being mentors, role models, resource providers, instructionals specialists, curriculum specialists, learning facilitators, advocates for high-order thinking skills, classroom supporters, school leaders, and agents of change. There should be a constructive alignment between the National Philosophy of Education and the Philosophy of Teacher Education to achieve quality education. Learning should be assessed on an ongoing basis through various approaches, including periodic assessments of individual progress, key milestones, and holistic judgements, to gather evidence of students' knowledge, skills, and attributes from their experiences and determine next steps.Lecture 4 Penaksiran Akademik
Lecture 4 Penaksiran AkademikSHALINIAPVIJAYAKUMAR
Ėý
This document provides information on learning outcomes and how to write them effectively. It begins with definitions of learning outcomes and discusses how they differ from teaching objectives by focusing on what students can do upon completion of learning. Bloom's Taxonomy of educational objectives is introduced as a useful framework for writing outcomes across cognitive, affective, and psychomotor domains. Verbs associated with different levels of Bloom's Taxonomy are provided. The document also discusses linking learning outcomes to teaching and learning activities as well as assessment, providing examples of how to align the three. Overall, the document offers guidance on conceptualizing and implementing a learning outcomes approach in an educational context.Penaksiran Akademik
Penaksiran AkademikSHALINIAPVIJAYAKUMAR
Ėý
This document provides an overview of learning assessment concepts and frameworks. It defines key terms like test, measurement, assessment and evaluation. It also outlines different types of tests like proficiency, achievement and diagnostic tests. The document discusses three main purposes of assessment: assessment of learning, for learning, and as learning. It describes teachers' roles in facilitating these different assessment purposes. Finally, it discusses the Malaysian education context and school-based assessment approaches under the Malaysian curriculum framework.Recently uploaded (20)

Eng7-Q4-Lesson 1 Part 1 Understanding Discipline-Specific Words, Voice, and T...
Eng7-Q4-Lesson 1 Part 1 Understanding Discipline-Specific Words, Voice, and T...sandynavergas1
Ėý
Understanding Discipline-Specific Words, Voice, and Technical Terms

A PPT Presentation on The Princess and the God: A tale of ancient India by A...
A PPT Presentation on The Princess and the God: A tale of ancient India by A...Beena E S
Ėý
A PPT Presentation on The Princess and the God: A tale of ancient India by Aaron ShepardYear 10 The Senior Phase Session 3 Term 1.pptx
Year 10 The Senior Phase Session 3 Term 1.pptxmansk2
Ėý
Year 10 The Senior Phase Session 3 Term 1.pptx
Computer Application in Business (commerce)
Computer Application in Business (commerce)Sudar Sudar
Ėý
The main objectives
1. To introduce the concept of computer and its various parts. 2. To explain the concept of data base management system and Management information system.
3. To provide insight about networking and basics of internet
Recall various terms of computer and its part
Understand the meaning of software, operating system, programming language and its features
Comparing Data Vs Information and its management system Understanding about various concepts of management information system
Explain about networking and elements based on internet
1. Recall the various concepts relating to computer and its various parts
2 Understand the meaning of softwareâs, operating system etc
3 Understanding the meaning and utility of database management system
4 Evaluate the various aspects of management information system
5 Generating more ideas regarding the use of internet for business purpose Essentials of a Good PMO, presented by Aalok Sonawala
Essentials of a Good PMO, presented by Aalok SonawalaAssociation for Project Management
Ėý
APM event hosted by the South Wales and West of England Network (SWWE Network)
Speaker: Aalok Sonawala
The SWWE Regional Network were very pleased to welcome Aalok Sonawala, Head of PMO, National Programmes, Rider Levett Bucknall on 26 February, to BAWA for our first face to face event of 2025. Aalok is a member of APMâs Thames Valley Regional Network and also speaks to members of APMâs PMO Interest Network, which aims to facilitate collaboration and learning, offer unbiased advice and guidance.
Tonight, Aalok planned to discuss the importance of a PMO within project-based organisations, the different types of PMO and their key elements, PMO governance and centres of excellence.
PMOâs within an organisation can be centralised, hub and spoke with a central PMO with satellite PMOs globally, or embedded within projects. The appropriate structure will be determined by the specific business needs of the organisation. The PMO sits above PM delivery and the supply chain delivery teams.
For further information about the event please click here.Information Technology for class X CBSE skill Subject
Information Technology for class X CBSE skill SubjectVEENAKSHI PATHAK
Ėý
These questions are based on cbse booklet for 10th class information technology subject code 402. these questions are sufficient for exam for first lesion. This subject give benefit to students and good marks. if any student weak in one main subject it can replace with these marks.FESTIVAL: SINULOG & THINGYAN-LESSON 4.pptx
FESTIVAL: SINULOG & THINGYAN-LESSON 4.pptxDanmarieMuli1
Ėý
Sinulog Festival of Cebu City, and Thingyan Festival of Myanmar.POWERPOINT-PRESENTATION_DM-NO.017-S.2025.pptx
POWERPOINT-PRESENTATION_DM-NO.017-S.2025.pptxMarilenQuintoSimbula
Ėý
Rubric level Summary for Teacher 1 to 3, Proficient Teacher. Guide in assessing MOV presented.

Rass MELAI : an Internet MELA Quiz Prelims - El Dorado 2025
Rass MELAI : an Internet MELA Quiz Prelims - El Dorado 2025Conquiztadors- the Quiz Society of Sri Venkateswara College
Ėý
Prelims of Rass MELAI : a Music, Entertainment, Literature, Arts and Internet Culture Quiz organized by Conquiztadors, the Quiz society of Sri Venkateswara College under their annual quizzing fest El Dorado 2025. 
Blind spots in AI and Formulation Science, IFPAC 2025.pdf
Blind spots in AI and Formulation Science, IFPAC 2025.pdfAjaz Hussain
Ėý
The intersection of AI and pharmaceutical formulation science highlights significant blind spotsâsystemic gaps in pharmaceutical development, regulatory oversight, quality assurance, and the ethical use of AIâthat could jeopardize patient safety and undermine public trust. To move forward effectively, we must address these normalized blind spots, which may arise from outdated assumptions, errors, gaps in previous knowledge, and biases in language or regulatory inertia. This is essential to ensure that AI and formulation science are developed as tools for patient-centered and ethical healthcare.
How to Modify Existing Web Pages in Odoo 18
How to Modify Existing Web Pages in Odoo 18Celine George
Ėý
In this slide, weâll discuss on how to modify existing web pages in Odoo 18. Web pages in Odoo 18 can also gather user data through user-friendly forms, encourage interaction through engaging features. APM People Interest Network Conference - Tim Lyons - The neurological levels ...
APM People Interest Network Conference - Tim Lyons - The neurological levels ...Association for Project Management
Ėý
APM People Interest Network Conference 2025
-Autonomy, Teams and Tension: Projects under stress
-Tim Lyons
-The neurological levels of
team-working: Harmony and tensions
With a background in projects spanning more than 40 years, Tim Lyons specialised in the delivery of large, complex, multi-disciplinary programmes for clients including Crossrail, Network Rail, ExxonMobil, Siemens and in patent development. His first career was in broadcasting, where he designed and built commercial radio station studios in Manchester, Cardiff and Bristol, also working as a presenter and programme producer. Tim now writes and presents extensively on matters relating to the human and neurological aspects of projects, including communication, ethics and coaching. He holds a Masterâs degree in NLP, is an NLP Master Practitioner and International Coach. He is the Deputy Lead for APMâs People Interest Network.
Session | The Neurological Levels of Team-working: Harmony and Tensions
Understanding how teams really work at conscious and unconscious levels is critical to a harmonious workplace. This session uncovers what those levels are, how to use them to detect and avoid tensions and how to smooth the management of change by checking you have considered all of them.Rass MELAI : an Internet MELA Quiz Prelims - El Dorado 2025
Rass MELAI : an Internet MELA Quiz Prelims - El Dorado 2025Conquiztadors- the Quiz Society of Sri Venkateswara College
Ėý
APM People Interest Network Conference - Tim Lyons - The neurological levels ...
APM People Interest Network Conference - Tim Lyons - The neurological levels ...Association for Project Management
Ėý
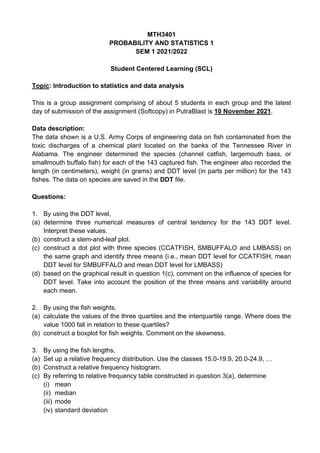
Scl 3401
- 1. MTH3401 PROBABILITY AND STATISTICS 1 SEM 1 2021/2022 Student Centered Learning (SCL) Topic: Introduction to statistics and data analysis This is a group assignment comprising of about 5 students in each group and the latest day of submission of the assignment (Softcopy) in PutraBlast is 10 November 2021. Data description: The data shown is a U.S. Army Corps of engineering data on fish contaminated from the toxic discharges of a chemical plant located on the banks of the Tennessee River in Alabama. The engineer determined the species (channel catfish, largemouth bass, or smallmouth buffalo fish) for each of the 143 captured fish. The engineer also recorded the length (in centimeters), weight (in grams) and DDT level (in parts per million) for the 143 fishes. The data on species are saved in the DDT file. Questions: 1. By using the DDT level, (a) determine three numerical measures of central tendency for the 143 DDT level. Interpret these values. (b) construct a stem-and-leaf plot. (c) construct a dot plot with three species (CCATFISH, SMBUFFALO and LMBASS) on the same graph and identify three means (i.e., mean DDT level for CCATFISH, mean DDT level for SMBUFFALO and mean DDT level for LMBASS) (d) based on the graphical result in question 1(c), comment on the influence of species for DDT level. Take into account the position of the three means and variability around each mean. 2. By using the fish weights, (a) calculate the values of the three quartiles and the interquartile range. Where does the value 1000 fall in relation to these quartiles? (b) construct a boxplot for fish weights. Comment on the skewness. 3. By using the fish lengths, (a) Set up a relative frequency distribution. Use the classes 15.0-19.9, 20.0-24.9, âĶ (b) Construct a relative frequency histogram. (c) By referring to relative frequency table constructed in question 3(a), determine (i) mean (ii) median (iii) mode (iv) standard deviation