Segundo bimestre2009
0 likes186 views

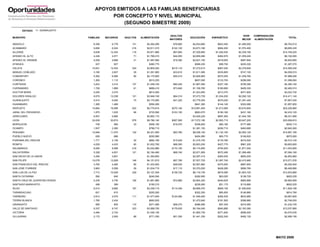
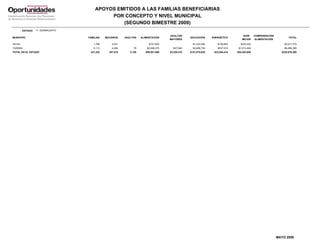
This document provides data on government assistance to families in the state of Guanajuato, Mexico for the second bimester of 2009 broken down by municipality. It shows the number of families and students receiving assistance, amounts provided for food, education, utilities and other categories, and totals for each municipality and the overall state total. Over 227,000 families in Guanajuato received over 320 million pesos in total assistance across various programs for things like food, education, utilities and compensation during this time period.
Segundo bimestre2009
- 1. APOYOS EMITIDOS A LAS FAMILIAS BENEFICIARIAS POR CONCEPTO Y NIVEL MUNICIPAL (SEGUNDO BIMESTRE 2009) ESTADO: 11 GUANAJUATO ADULTOS VIVIR COMPENSACI?N MUNICIPIO FAMILIAS BECARIOS ADULTOS ALIMENTACI?N EDUCACI?N ENERG?TICO TOTAL MAYORES MEJOR ALIMENTACI?N ABASOLO 6,356 6,778 131 $2,494,290 $76,660 $4,053,660 $653,400 $1,485,000 $8,763,010 ACAMBARO 6,690 6,024 216 $2,611,515 $122,130 $3,673,190 $684,200 $1,574,400 $8,665,435 ALLENDE 9,838 12,434 119 $3,971,880 $67,850 $7,329,800 $1,040,535 $2,339,160 $14,749,225 APASEO EL ALTO 4,436 4,571 71 $1,766,415 $44,050 $2,859,490 $462,870 $1,059,240 $6,192,065 APASEO EL GRANDE 4,059 4,666 31 $1,597,680 $19,390 $2,827,100 $418,655 $957,840 $5,820,665 ATARJEA 937 927 $380,775 $586,225 $99,750 $220,320 $1,287,070 CELAYA 10,001 12,434 324 $3,805,020 $215,110 $7,272,615 $997,045 $2,279,640 $14,569,430 MANUEL DOBLADO 3,180 2,827 29 $1,281,900 $33,610 $1,611,085 $335,800 $747,120 $4,009,515 COMONFORT 5,362 6,566 80 $2,175,905 $55,410 $3,826,965 $570,255 $1,259,760 $7,888,295 CORONEO 1,260 1,112 $510,225 $657,050 $133,705 $298,080 $1,599,060 CORTAZAR 3,203 3,310 137 $1,248,720 $80,240 $1,967,590 $327,190 $756,360 $4,380,100 CUERAMARO 1,726 1,869 61 $689,410 $73,840 $1,108,760 $180,680 $409,320 $2,462,010 DOCTOR MORA 2,000 2,570 $814,260 $1,523,500 $213,370 $471,600 $3,022,730 DOLORES HIDALGO 9,570 12,238 121 $3,946,745 $64,310 $7,073,735 $1,034,230 $2,292,120 $14,411,140 GUANAJUATO 5,514 6,550 75 $2,175,060 $41,220 $3,779,305 $570,020 $1,291,440 $7,857,045 HUANIMARO 1,385 1,468 $550,260 $841,365 $144,145 $322,080 $1,857,850 IRAPUATO 15,664 18,589 522 $5,775,815 $270,140 $10,991,505 $1,513,560 $3,675,840 $22,226,860 JARAL DEL PROGRESO 1,875 1,635 96 $725,580 $103,150 $983,070 $190,160 $431,160 $2,433,120 JERECUARO 6,507 5,885 $2,662,110 $3,428,220 $697,400 $1,544,160 $8,331,890 LEON 24,639 30,674 978 $9,786,140 $587,560 $17,072,195 $2,565,715 $5,647,200 $35,658,810 MOROLEON 749 584 33 $306,150 $19,470 $348,820 $80,190 $177,480 $932,110 OCAMPO 1,937 2,382 $788,715 $1,381,155 $206,710 $463,680 $2,840,260 PENJAMO 10,946 11,070 142 $4,321,065 $83,780 $6,538,120 $1,132,100 $2,592,120 $14,667,185 PUEBLO NUEVO 626 686 $250,980 $404,590 $65,770 $148,920 $870,260 PURISIMA DEL RINCON 1,771 2,136 30 $682,185 $15,930 $1,216,725 $178,780 $416,520 $2,510,140 ROMITA 4,029 4,433 60 $1,632,795 $68,300 $2,603,530 $427,775 $961,200 $5,693,600 SALAMANCA 8,090 8,588 219 $3,032,880 $170,100 $5,174,850 $794,930 $1,871,040 $11,043,800 SALVATIERRA 5,328 4,831 121 $2,184,490 $68,740 $2,971,955 $572,495 $1,266,480 $7,064,160 SAN DIEGO DE LA UNION 3,394 3,851 $1,394,800 $2,287,415 $365,545 $805,200 $4,852,960 SAN FELIPE 10,078 12,828 148 $4,151,815 $87,790 $7,527,725 $1,087,745 $2,415,960 $15,271,035 SAN FRANCISCO DEL RINCON 3,760 4,482 90 $1,433,000 $48,930 $2,567,860 $375,550 $867,600 $5,292,940 SAN JOSE ITURBIDE 3,983 5,558 29 $1,634,715 $17,110 $3,370,020 $428,285 $956,760 $6,406,890 SAN LUIS DE LA PAZ 7,712 10,529 229 $3,127,305 $136,720 $6,116,735 $819,380 $1,803,720 $12,003,860 SANTA CATARINA 582 640 $240,540 $382,950 $63,025 $138,720 $825,235 SANTA CRUZ DE JUVENTINO ROSAS 4,235 4,730 126 $1,681,860 $72,880 $2,804,320 $440,625 $983,880 $5,983,565 SANTIAGO MARAVATIO 498 399 $195,210 $239,260 $51,175 $116,880 $602,525 SILAO 8,214 9,682 197 $3,236,715 $114,340 $5,689,370 $848,130 $1,940,640 $11,829,195 TARANDACUAO 621 610 $250,050 $352,355 $65,505 $146,880 $814,790 TARIMORO 2,812 2,570 111 $1,077,645 $124,260 $1,549,400 $282,535 $633,960 $3,667,800 TIERRA BLANCA 1,785 2,434 $692,835 $1,472,840 $181,500 $398,880 $2,746,055 URIANGATO 956 835 110 $371,580 $58,370 $486,090 $97,345 $219,360 $1,232,745 VALLE DE SANTIAGO 9,337 8,747 323 $3,589,755 $179,830 $5,164,040 $940,880 $2,163,360 $12,037,865 VICTORIA 2,494 2,743 $1,036,145 $1,665,730 $271,640 $596,520 $3,570,035 VILLAGRAN 2,172 2,505 88 $771,250 $51,250 $1,441,330 $202,245 $492,120 $2,958,195 MAYO 2009
- 2. APOYOS EMITIDOS A LAS FAMILIAS BENEFICIARIAS POR CONCEPTO Y NIVEL MUNICIPAL (SEGUNDO BIMESTRE 2009) ESTADO: 11 GUANAJUATO ADULTOS VIVIR COMPENSACI?N MUNICIPIO FAMILIAS BECARIOS ADULTOS ALIMENTACI?N EDUCACI?N ENERG?TICO TOTAL MAYORES MEJOR ALIMENTACI?N XICHU 1,798 2,041 $747,600 $1,243,480 $195,855 $430,440 $2,617,375 YURIRIA 5,113 4,494 79 $2,049,275 $47,940 $2,608,730 $537,010 $1,213,440 $6,456,395 TOTAL EN EL ESTADO 227,222 257,515 5,126 $89,851,060 $3,220,410 $151,075,820 $23,545,410 $53,283,600 $320,976,300 MAYO 2009