Segundo bimestre2011
0 likes184 views

This document provides a summary of economic support provided to families in the state of Guanajuato, Mexico for the second bimester of 2011 broken down by municipality. It shows the number of families receiving support, beneficiaries of various programs providing food, education, living assistance and more. The total economic support provided to families across the state for the period was 392,260,005 Mexican pesos.
Segundo bimestre2011
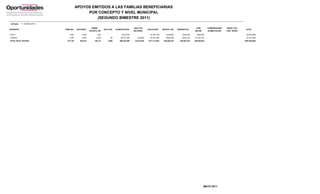
- 1. APOYOS EMITIDOS A LAS FAMILIAS BENEFICIARIAS POR CONCEPTO Y NIVEL MUNICIPAL (SEGUNDO BIMESTRE 2011) ESTADO: 11 GUANAJUATO BENEF. ADULTOS VIVIR COMPENSACI?N REEXP. PAL MUNICIPIO FAMILIAS BECARIOS ADULTOS ALIMENTACI?N EDUCACI?N INFANTIL VM ENERG?TICO TOTAL INFANTIL VM MAYORES MEJOR ALIMENTACI?N FAM. TRANS. ABASOLO 6,750 6,667 3,726 35 $2,689,300 $21,420 $4,579,120 $726,435 $717,360 $1,578,840 $10,312,475 ACAMBARO 6,192 5,360 2,005 185 $2,569,750 $105,210 $3,851,945 $400,215 $685,240 $1,460,280 $9,072,640 ALLENDE 10,404 12,768 5,871 105 $4,404,125 $66,740 $8,819,335 $1,131,625 $1,175,140 $2,473,800 $18,070,765 APASEO EL ALTO 4,594 4,480 1,831 28 $2,060,610 $26,040 $3,438,530 $559,780 $551,080 $1,199,400 $7,835,440 APASEO EL GRANDE 4,665 4,806 2,482 10 $2,012,020 $7,440 $3,440,055 $683,390 $538,060 $1,141,560 $7,822,525 ATARJEA 925 886 360 $396,420 $607,705 $66,260 $105,720 $219,360 $1,395,465 CELAYA 12,666 12,841 9,143 456 $5,336,035 $285,150 $10,043,355 $1,772,975 $1,424,880 $3,042,960 $21,905,355 MANUEL DOBLADO 2,938 2,626 1,378 8 $1,193,345 $-1,020 $1,714,725 $274,100 $318,240 $688,200 $4,187,590 COMONFORT 6,555 7,432 4,640 32 $2,955,005 $26,200 $5,572,480 $1,166,895 $790,490 $1,667,040 $12,178,110 CORONEO 1,136 1,043 280 $456,375 $689,135 $55,285 $121,730 $258,720 $1,581,245 CORTAZAR 3,634 3,244 2,130 230 $1,489,305 $145,430 $2,292,565 $407,340 $397,200 $837,360 $5,569,200 CUERAMARO 1,756 1,805 939 15 $686,280 $9,430 $1,186,290 $185,035 $182,940 $403,800 $2,653,775 DOCTOR MORA 2,155 2,802 1,523 $894,390 $1,847,165 $274,610 $238,500 $515,400 $3,770,065 DOLORES HIDALGO 8,978 11,881 5,302 98 $3,749,485 $62,330 $7,756,730 $935,825 $1,000,220 $2,139,840 $15,644,430 GUANAJUATO 5,655 6,522 3,738 74 $2,365,795 $42,210 $4,500,785 $703,005 $631,320 $1,334,760 $9,577,875 HUANIMARO 1,355 1,466 603 $537,670 $957,185 $115,410 $143,340 $309,360 $2,062,965 IRAPUATO 18,951 18,529 13,617 714 $7,979,420 $444,110 $13,548,045 $2,663,730 $2,129,520 $4,492,680 $31,257,505 JARAL DEL PROGRESO 2,029 1,545 1,062 24 $1,003,920 $16,200 $1,439,060 $571,575 $269,210 $587,760 $3,887,725 JERECUARO 5,907 5,361 1,406 $2,393,005 $3,534,090 $265,585 $638,220 $1,389,240 $8,220,140 LEON 23,258 30,425 18,520 1,767 $9,519,190 $1,074,300 $19,891,110 $3,556,585 $2,539,860 $5,361,240 $41,942,285 MOROLEON 960 574 518 42 $380,140 $25,830 $413,330 $103,380 $101,400 $215,280 $1,239,360 OCAMPO 1,892 2,341 1,106 $748,755 $1,501,665 $196,175 $199,620 $440,640 $3,086,855 PENJAMO 11,620 10,685 5,708 154 $4,653,770 $95,660 $7,484,785 $1,160,805 $1,241,125 $2,747,760 $17,383,905 PUEBLO NUEVO 590 599 260 $241,085 $381,935 $52,190 $64,320 $137,160 $876,690 PURISIMA DEL RINCON 2,439 2,276 2,026 36 $1,435,230 $42,100 $2,289,985 $833,365 $385,420 $801,600 $5,787,700 ROMITA 4,478 4,412 2,613 23 $1,846,400 $11,460 $3,056,575 $515,750 $492,420 $1,061,520 $6,984,125 SALAMANCA 7,454 7,481 3,233 180 $2,999,315 $107,890 $5,380,200 $636,620 $800,880 $1,770,480 $11,695,385 SALVATIERRA 4,841 4,185 1,984 112 $1,921,225 $72,370 $2,905,165 $392,985 $512,280 $1,121,880 $6,925,905 SAN DIEGO DE LA UNION 3,499 4,024 1,571 $1,545,505 $2,643,215 $295,625 $412,620 $864,240 $5,761,205 SAN FELIPE 9,937 12,690 5,959 42 $4,210,600 $24,000 $8,267,575 $1,064,275 $1,123,060 $2,362,320 $17,051,830 SAN FRANCISCO DEL RINCON 4,298 4,388 3,281 106 $1,804,230 $60,480 $2,877,220 $625,755 $481,440 $994,800 $6,843,925 SAN JOSE ITURBIDE 3,791 5,437 2,240 9 $1,546,695 $5,040 $3,987,625 $374,730 $412,380 $894,120 $7,220,590 SAN LUIS DE LA PAZ 9,403 11,137 7,432 310 $4,010,945 $198,290 $7,631,990 $1,368,205 $1,070,070 $2,229,480 $16,508,980 SANTA CATARINA 597 678 317 $265,230 $485,375 $57,930 $70,800 $145,680 $1,025,015 SANTA CRUZ DE JUVENTINO ROSAS 5,117 5,258 3,300 198 $2,107,670 $113,360 $3,438,035 $637,935 $562,140 $1,183,560 $8,042,700 SANTIAGO MARAVATIO 424 339 104 $165,980 $226,910 $20,195 $44,280 $100,320 $557,685 SILAO 8,747 9,784 5,330 284 $3,575,835 $183,600 $6,611,790 $1,035,240 $953,690 $2,065,320 $14,425,475 TARANDACUAO 602 595 185 $236,300 $402,185 $35,435 $63,000 $133,800 $870,720 TARIMORO 2,661 2,310 1,032 39 $1,035,975 $21,420 $1,590,330 $198,815 $276,180 $607,320 $3,730,040 TIERRA BLANCA 2,063 2,643 958 $899,345 $1,833,625 $176,300 $239,880 $486,960 $3,636,110 URIANGATO 1,370 842 612 109 $557,400 $65,520 $642,795 $120,680 $148,670 $308,400 $1,843,465 VALLE DE SANTIAGO 8,777 7,663 4,099 324 $3,407,865 $193,960 $5,160,050 $792,545 $908,860 $1,985,160 $12,448,440 VICTORIA 2,348 2,598 1,006 $1,006,010 $1,741,435 $173,700 $268,320 $562,320 $3,751,785 VILLAGRAN 2,305 2,457 821 32 $1,199,545 $38,440 $2,611,555 $369,915 $321,780 $700,560 $5,241,795 MAYO 2011
- 2. APOYOS EMITIDOS A LAS FAMILIAS BENEFICIARIAS POR CONCEPTO Y NIVEL MUNICIPAL (SEGUNDO BIMESTRE 2011) ESTADO: 11 GUANAJUATO BENEF. ADULTOS VIVIR COMPENSACI?N REEXP. PAL MUNICIPIO FAMILIAS BECARIOS ADULTOS ALIMENTACI?N EDUCACI?N INFANTIL VM ENERG?TICO TOTAL INFANTIL VM MAYORES MEJOR ALIMENTACI?N FAM. TRANS. XICHU 1,684 2,028 833 $732,305 $1,367,720 $136,920 $195,300 $402,840 $2,835,085 YURIRIA 4,795 4,097 2,028 28 $2,077,295 $19,880 $3,072,355 $609,280 $555,130 $1,203,720 $7,537,660 TOTAL EN EL ESTADO 237,195 254,010 139,112 5,809 $99,302,095 $3,610,490 $177,714,835 $28,500,410 $26,503,335 $56,628,840 $392,260,005 MAYO 2011