Spruce up your ggplot2 visualizations with formatted text
Download as PPTX, PDF5 likes1,183 views

The document discusses how to add formatted text like italics, bold, colors and images to ggplot2 visualizations using the ggtext and gridtext packages. It provides examples of labeling bars and points with formatted text, adding correlation values alongside a scatter plot faceted by species, and controlling font properties and alignments. The key package that enables rich text formatting in plots is gridtext.


![Formal Methods: Whence and Whither? [Martin Fr?nzle Festkolloquium, 2025]](https://cdn.slidesharecdn.com/ss_thumbnails/mf2025-250305164811-a0930761-thumbnail.jpg?width=560&fit=bounds)

More Related Content
Similar to Spruce up your ggplot2 visualizations with formatted text (20)
Recently uploaded (20)


Spruce up your ggplot2 visualizations with formatted text
- 1. Spruce up your ggplot2 visualizations with formatted text Claus O. Wilke The University of Texas at Austin https://wilkelab.org/ggtext @clauswilke clauswilke
- 2. A common problem: Mixing italics and normal text in ggplot
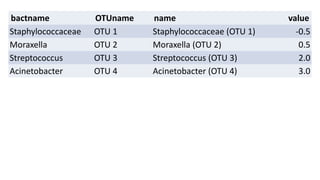
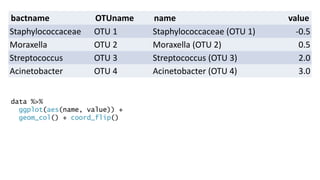
- 4. bactname OTUname name value Staphylococcaceae OTU 1 Staphylococcaceae (OTU 1) -0.5 Moraxella OTU 2 Moraxella (OTU 2) 0.5 Streptococcus OTU 3 Streptococcus (OTU 3) 2.0 Acinetobacter OTU 4 Acinetobacter (OTU 4) 3.0
- 5. bactname OTUname name value Staphylococcaceae OTU 1 Staphylococcaceae (OTU 1) -0.5 Moraxella OTU 2 Moraxella (OTU 2) 0.5 Streptococcus OTU 3 Streptococcus (OTU 3) 2.0 Acinetobacter OTU 4 Acinetobacter (OTU 4) 3.0 data %>% ggplot(aes(name, value)) + geom_col() + coord_flip()
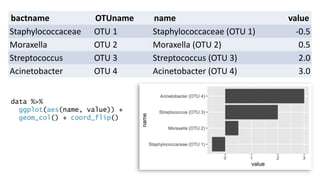
- 6. bactname OTUname name value Staphylococcaceae OTU 1 Staphylococcaceae (OTU 1) -0.5 Moraxella OTU 2 Moraxella (OTU 2) 0.5 Streptococcus OTU 3 Streptococcus (OTU 3) 2.0 Acinetobacter OTU 4 Acinetobacter (OTU 4) 3.0 data %>% ggplot(aes(name, value)) + geom_col() + coord_flip()
- 8. How should we specify formatted text?
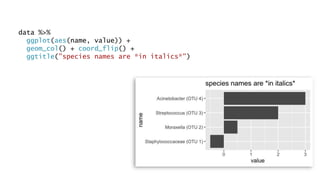
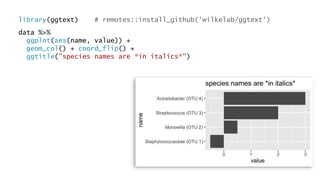
- 9. data %>% ggplot(aes(name, value)) + geom_col() + coord_flip() + ggtitle("species names are *in italics*")
- 10. data %>% ggplot(aes(name, value)) + geom_col() + coord_flip() + ggtitle("species names are *in italics*") library(ggtext) # remotes::install_github('wilkelab/ggtext')
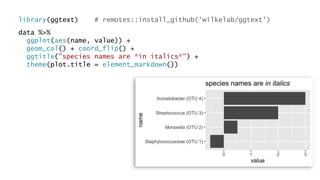
- 11. data %>% ggplot(aes(name, value)) + geom_col() + coord_flip() + ggtitle("species names are *in italics*") + theme(plot.title = element_markdown()) library(ggtext) # remotes::install_github('wilkelab/ggtext')
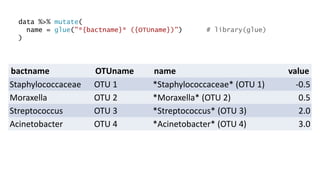
- 12. data %>% mutate( name = glue("*{bactname}* ({OTUname})") # library(glue) )
- 13. data %>% mutate( name = glue("*{bactname}* ({OTUname})") # library(glue) ) bactname OTUname name value Staphylococcaceae OTU 1 *Staphylococcaceae* (OTU 1) -0.5 Moraxella OTU 2 *Moraxella* (OTU 2) 0.5 Streptococcus OTU 3 *Streptococcus* (OTU 3) 2.0 Acinetobacter OTU 4 *Acinetobacter* (OTU 4) 3.0
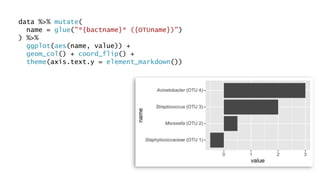
- 14. data %>% mutate( name = glue("*{bactname}* ({OTUname})") ) %>% ggplot(aes(name, value)) + geom_col() + coord_flip() + theme(axis.text.y = element_markdown())
- 15. Your plots are boring. DonˇŻt you ever use color?
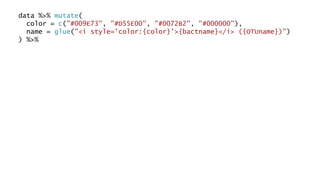
- 16. data %>% mutate( color = c("#009E73", "#D55E00", "#0072B2", "#000000"), name = glue("<i style='color:{color}'>{bactname}</i> ({OTUname})") ) %>%
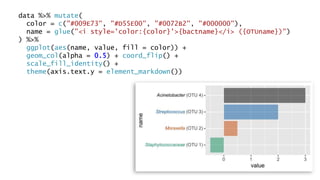
- 17. data %>% mutate( color = c("#009E73", "#D55E00", "#0072B2", "#000000"), name = glue("<i style='color:{color}'>{bactname}</i> ({OTUname})") ) %>% ggplot(aes(name, value, fill = color)) + geom_col(alpha = 0.5) + coord_flip() + scale_fill_identity() + theme(axis.text.y = element_markdown())
- 18. What else can you do?
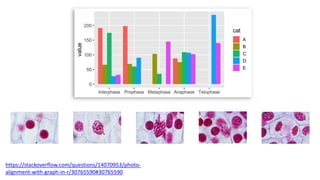
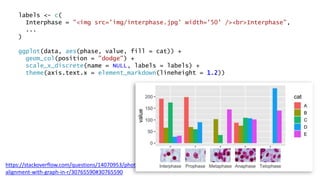
- 20. labels <- c( Interphase = "<img src=/slideshow/spruce-up-your-ggplot2-visualizations-with-formatted-text/226199668/& width='50' /><br>Interphase", Prophase = "<img src='img/prophase.jpg' width='50' /><br>Prophase", Metaphase = "<img src='img/metaphase.jpg' width='50' /><br>Metaphase", Anaphase = "<img src='img/anaphase.jpg' width='50' /><br>Anaphase", Telophase = "<img src='img/telophase.jpg' width='50' /><br>Telophase" ) https://stackoverflow.com/questions/14070953/photo- alignment-with-graph-in-r/30765590#30765590
- 21. https://stackoverflow.com/questions/14070953/photo- alignment-with-graph-in-r/30765590#30765590 labels <- c( Interphase = "<img src=/slideshow/spruce-up-your-ggplot2-visualizations-with-formatted-text/226199668/& width='50' /><br>Interphase", ... ) ggplot(data, aes(phase, value, fill = cat)) + geom_col(position = "dodge") + scale_x_discrete(name = NULL, labels = labels) + theme(axis.text.x = element_markdown(lineheight = 1.2))
- 22. https://stackoverflow.com/questions/14070953/photo- alignment-with-graph-in-r/30765590#30765590 labels <- c( Interphase = "<img src=/slideshow/spruce-up-your-ggplot2-visualizations-with-formatted-text/226199668/& width='50' /><br>Interphase", ... ) ggplot(data, aes(phase, value, fill = cat)) + geom_col(position = "dodge") + scale_x_discrete(name = NULL, labels = labels) + theme(axis.text.x = element_markdown(lineheight = 1.2))
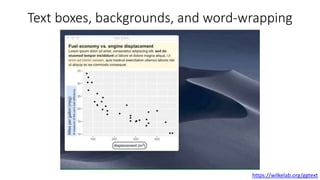
- 23. Text boxes, backgrounds, and word-wrapping https://wilkelab.org/ggtext
- 24. Does this only work for theme elements?
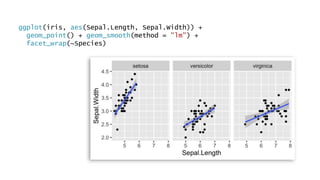
- 25. ggplot(iris, aes(Sepal.Length, Sepal.Width)) + geom_point() + geom_smooth(method = "lm") + facet_wrap(~Species)
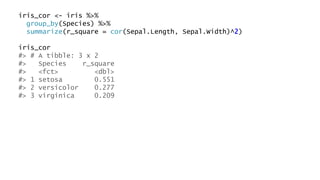
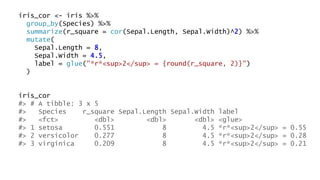
- 26. iris_cor <- iris %>% group_by(Species) %>% summarize(r_square = cor(Sepal.Length, Sepal.Width)^2) iris_cor #> # A tibble: 3 x 2 #> Species r_square #> <fct> <dbl> #> 1 setosa 0.551 #> 2 versicolor 0.277 #> 3 virginica 0.209
- 27. iris_cor <- iris %>% group_by(Species) %>% summarize(r_square = cor(Sepal.Length, Sepal.Width)^2) %>% mutate( Sepal.Length = 8, Sepal.Width = 4.5, label = glue("*r*<sup>2</sup> = {round(r_square, 2)}") ) iris_cor #> # A tibble: 3 x 5 #> Species r_square Sepal.Length Sepal.Width label #> <fct> <dbl> <dbl> <dbl> <glue> #> 1 setosa 0.551 8 4.5 *r*<sup>2</sup> = 0.55 #> 2 versicolor 0.277 8 4.5 *r*<sup>2</sup> = 0.28 #> 3 virginica 0.209 8 4.5 *r*<sup>2</sup> = 0.21
- 28. ggplot(iris, aes(Sepal.Length, Sepal.Width)) + geom_point() + geom_smooth(method = "lm") + geom_richtext( data = iris_cor, aes(label = label), hjust = 1, vjust = 1 ) + facet_wrap(~Species)
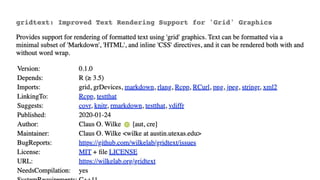
- 29. The package that makes it all possible
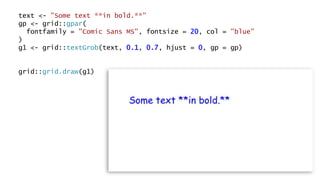
- 31. text <- "Some text **in bold.**" gp <- grid::gpar( fontfamily = "Comic Sans MS", fontsize = 20, col = "blue" ) g1 <- grid::textGrob(text, 0.1, 0.7, hjust = 0, gp = gp) grid::grid.draw(g1)
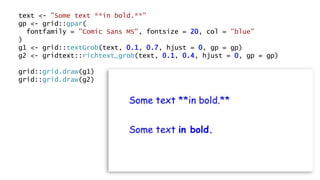
- 32. text <- "Some text **in bold.**" gp <- grid::gpar( fontfamily = "Comic Sans MS", fontsize = 20, col = "blue" ) g1 <- grid::textGrob(text, 0.1, 0.7, hjust = 0, gp = gp) g2 <- gridtext::richtext_grob(text, 0.1, 0.4, hjust = 0, gp = gp) grid::grid.draw(g1) grid::grid.draw(g2)