TDC TRAINING
?Download as PPTX, PDF?
2 likes?928 views

The document provides information about a training program conducted at the Talent Development Centre (TDC) of the Indian Institute of Science (IISC) located in Kudapura, Challakere, Karnataka, India. The training program was aimed at high school science teachers and covered topics in biology, chemistry, and other sciences through lectures and practical sessions from November 23rd to December 13th. Several professors from IISC Bangalore served as resource persons to teach various topics. The training aimed to impart IISC's culture of rigorous learning to the participating teachers.


TDC TRAINING
- 1. TDC TRAINING IISC, KUDAPURA CAMPUS, CHALLAKERE, KARNATAKA, INDIA Coordinator Prof. M.S. Hegde Biology Coordinators Prof. S.Shishupala, HOD, Dept of Microbiology, Davangere University, Davangere & Dr. Aravinda, Crystallographer, IISC, Bangalore Trainee Dr. Mousumi Das Asst Professor, Dept of Biotechnology, SIT, Tumkur
- 2. WHY TDC, IISC Challakerere ? ? Indian Institute of Science - Challakere Campus at Kudapura ? Indian Institute of Science Bangalore celebrated its centenary in the year 2009. To expand its activities, need for a second campus was felt at that time. ? Indian Institute of Science has acquired a second campus at Kudapura, Challakere, Chitradurga district of Karnataka. ? The creation of the second campus has been greatly facilitated by the Government of Karnataka. ? The campus is located at Kudapura 15 Km from Challakere on the Challakere - Nayakanahatti Road. Kudapura campus is 220 Km away from the Bangalore campus.
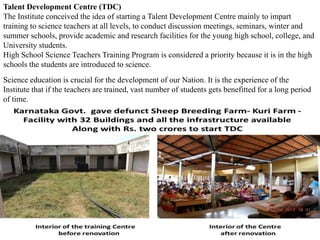
- 3. Talent Development Centre (TDC) The Institute conceived the idea of starting a Talent Development Centre mainly to impart training to science teachers at all levels, to conduct discussion meetings, seminars, winter and summer schools, provide academic and research facilities for the young high school, college, and University students. High School Science Teachers Training Program is considered a priority because it is in the high schools the students are introduced to science. Science education is crucial for the development of our Nation. It is the experience of the Institute that if the teachers are trained, vast number of students gets benefitted for a long period of time.
- 5. Vision of High School teachers Training The primary vision of this program is teaching and training teachers to teach students with passion. Motivating them to have higher level of intellectual activity is more important than just giving lectures to the participating teachers and covering the course syllabus. The hallmark of the IISc academic program is in its rigor, honesty of purpose, simplicity, humility, sincerity, time consciousness, hard work and delivery. It is the research and the research attitude that drives the Institute. If an event is announced in IISc it takes place at the scheduled time. Can we inculcate IISc's culture of learning in these teachers ?
- 15. Non Teaching Staffs , TDC, IISC, Kudapura Campus,Challakere
- 16. IISC , TDC , Kudapura Outside and Inside Classrooms and Well Facilitated Lab with all necessaru basic amenities Biology and Chemistry Lab Entrance IISC , TDC , Kudapura campus ;Outside view Biology and Chemistry Lab Biology Lab Biology Lab with a trainee TDC Entrance
- 17. Theory lectures scheduled from 23rd Nov to 13th Dec.,2016
- 18. Practicals scheduled from 23rd Nov to 13th Dec.,2016 represented in a Lab Manual
- 19. List of Practicals Carried out from 23rd Nov to 13th Dec,2016
- 21. Topics covered in theory lectures by resource persons
- 22. Topics covered in theory lectures by resource persons
- 23. Topics covered in theory lectures by resource persons
- 24. List of experiments covered in practicals
- 25. List of experiments covered in practicals
- 26. Dr. S. Shishupala, HOD, Dept of Microbiology, Davangede Univ. Davangede; Biology Coordinator at TDC Prof. Dipak Saini , Dept of Biological Sciences, IISC, Bangalore
- 27. Prof. D.N Rao, Dept of Biochemistry IISC, Bangalore Prof. P.Kondaiah, Dept of Reproductive Biology and Gene Expression Unit IISC, Bangalore Prof. P.Kondaiah, Cancer Biologist IISC, Bangalore Prof. M.R.N. Murthy, IISC, Bangalore Some of the Resource Personsˇ In camera
- 28. Prof. Upendra Nongthomba, DBGL Lab, IISC, Bangalore Prof. R .Manjunath, Associate Professor, Dept of Biochemistry, IISC Bangalore Associate Professor JNCASR ,Jakkur, Bangalore 560 064, India Dr. Hemalatha Balaram
- 29. Persons behind the hardships of training being conducted in TDC,IISC,Kudapura, Challakere
- 30. Brief Glimpses of TDC , IISC, Kudapura, Challakere from 23rd Nov to 13th Dec,2016
- 31. ESTABLISHMENT OF LAB FOR BIOTECHNOLOGY WITH BASIC AND HIGHEND INFRASTUCTURE WITH A NOMINAL COSTING
- 32. Instruments Approximat e Costing (Rupees) Glasswares Miscellaneous ( Rupees) Funds and Collaborative agencies suggested Total costin g Microscopes and Autoclave and pressure cooker 50,000 Conical flasks -50 ml to 1000 ml (Borosil) Micro Pippettes (0.0 to 5 ml) Tarsons - 5,000 CSR ¨Ccorporate Social Research funds from near industries 4.0 - 6.0 lakhs Hot Air Oven 8,000 Beakers (10-1000 ml; Borosil), Pippette stand, Cuvette stand, Testtube stand ,Eppendorfs tubes (1 ml to 5 ml) and stands, micropippete tips and (0-5 ml),rubber bands, dialysis bag,forceps, needles, spatula, centrifuge tubes, , etc India Bioscience KSITBT VGST Plastic beakers (500 to 1000 ml) - Tarsons Shaker Incubator/ Vortex mixers 10,000 Glass pippettes (1 ml to 10 ml)-Borosil Disposable autoclavable bags, LAF/pH meter (digital) 48,000 Funnels (small, medium and big size) ¨C glass and plastic made micropippete tip boxes Cooling Centrifuge/ Table top centrifuge and microcentrifuge 65,000 BOD bottles (100 ml ¨C 1000 ml) gel staining and destaining box, Dessicators for chemical storage 8,000 Storage bottles Blubber for acid pippeting PCR or Thermocycler and Powerpack combined PAGE unit 30,000- 40,000 Volumetric flask Columns for chromatography Spectrophotometer/ Colorimeter 47,000 Separating funnel Blotting papers, Whattmann Filetre paper, pH strips (core and decibel range 1.0 to 14.0) DNA gel running machine or Gelrocker and illuminator Glass slides, cavity slides, coverslips etc Total- 1.0to 4.5 lakhs Total-1.5 lakhs Total-¨C 30,000 to 50,000
- 34. Some lab amenities starting from very basic to highend Fluorescence Microscope StereoBinocular Microscope Sterilization efficiency checking materials for autoclave Filter sterilization and bacteriophage filter elements Eppendorf tube stand to keep in waterbath SDS PAGE UNIT
- 36. Arrangements and designing of feasible accomodation of chemicals and glasswares with a brief systematic planning
- 37. Infrastucture facilities with maximum utilization in minimum space
- 38. Glimpses of theory lectures on some basic theoretical issues ¨C common perspective of Lifesciences including all branches
- 50. Mass is the amount of matter in an object. Difference Between Mass and Weight Students of physics often confuse mass and weight of an object and many also feel that there is no difference between the two, while the fact is that there is a lot of difference between the two. Mass is the amount of matter present in a body and is an intrinsic property of the body. Mass of an object remains the same always at any place. Weight on the other hand is the force which a given mass feels due to the gravity at its place. Weight is measured in units of Force like Newton (which is the SI unit of Force). If your mass is 60 kgs then your weight is approximately 60 x 10 = 600 Newtons. This is because Force = mass x acceleration (From Newton's second Law) Thus, weight = mass x acceleration due to gravity If you go to moon your mass remains same, i.e 60 kgs, but your weight becomes less by 1/6 amount, since moon's gravity is 1/6 that of earth. Mass of a body is measured by balancing it equally with another known amount of mass. You keep known amount of masses like blocks of 1 kg, 2 kg etc on one side till both the sides balance and then add up the numbers on the known side of mass and thus calculate the unknown mass. This works because, when the masses are equal on both the sides of the balance the effect of gravity cancels out for both (i.e weight cancels out) and hence we can calculate the mass on one side of the balance if we know the mass on the other side of the balance. Weight is measured using a scale which effectively measures the pull on the mass exerted by the gravity of the earth.
- 52. Ion type Composition M/z ratio Frequency A ¦˛ +H ¨CCO S-27 quitecommon B ¦˛ +H S+1 common C ¦˛ +H +NH +H +H S+18 rare X ¦˛ +OH +CO S+45 rare Y ¦˛ +OH +H +H S+19 verycommon Z ¦˛ +OH ¨CNH very rare doubly-chargedparent parent ion +H+ (parent M/z + 1) /2 verycommon trebly-chargedparent parent ion +H++H+ (parent M/z + 2) /3 rare internal ion ¦˛ +OH +H +H S+19 rare immonium ion ¦˛ +H -CO S-27 rare Table 1. Masses of ions found in tandem spectra. '¦˛' here denotes the total mass of the constituent amino acids, as given in table 2. The Frequency column applies to low-energy collisions in a modern QTOF spectrometer, higher-energy collisions in older spectrometers gave rise to a greater variety of ions. S+2
- 53. letter name mass,Da G glycine 57.02 A alanine 71.04 S serine 87.03 P proline 97.05 V valine 99.07 T threonine 101.05 C cysteine 103.01 I isoleucine 113.08 L leucine 113.08 N asparagine 114.04 D aspartic acid 115.03 Q glutamine 128.06 K lysine 128.09 E glutamic acid 129.04 M methionine 131.04 H histidine 137.06 F phenylalanine 147.07 R arginine 156.10 Y tyrosine 163.06 W tryptophan 186.08 carboxymethyl cysteine 161.05 carbamidated cysteine 160.03 oxidised methionine 147.04 Table 2. Masses of amino acids to two decimal places.
- 54. Parent ion mass 1275.67
- 55. Parent++ Step 1. Identify doubly charged parent ion (1275.67 + 1)/2 = 638.33 We do this to just eliminate this peak and not associate it with a fragment ion. This has no other purpose
- 56. Parent++ Yn-1 Y ?Step 2. Identify high mass peaks at right end of spectrum ?These could be Y ions ?1112.70 ¨C could be Yn-1 arising from cleavage of amino terminal amino acid from parent ion Yn ?Parent ion is ?+19 (18+1(singly charged)) ?1275.67-1112.70 = 162.97 ?162.97 could correspond to a single amino acid or the sum of masses of a small number of amino acids. ?162.97 = mass of tyrosine
- 57. Parent++ Yn-1 Y G Yn-2 Yn-3 Yn-4 Yn-5 I/L V T ?Identify Yn-2 and Yn-3 ?1112.70-1055.67 = 57.03 G ?1055.67 ¨C 1014.52 = 41.15 not consistent with any amino acid, peak small, we skip it. ?1055.67 ¨C 947.67 = 113.05 I/L ?Similarly the next two are valine and threonine ?942.62-843.48 = 99.14 Valine ?843.48 ¨C 742.46 = 101.02 threonine
- 58. Ion Sequence predicted mass A1 Y 136.08 A2 YG 193.10 A3 YGI 306.18 A4 YGIV 405.25 A5 YGIVT 506.30 B2 YG 221.09 B3 YGI 334.18 B4 YGIV 433.25 B5 YGIVT 534.29 Table 3. B1 cannot form
- 61. Parent++ Yn-1 Y G Yn-2 Yn-3 Yn-4 Yn-5 I/L V T A1 A5 A3 A2 A4 B2 B3 B4 B5 Y0 Y0 Y0 ?Peaks at 843, 942, 1055 all have peaks 18 Da to the left of them ?Due to loss of water ?These are designated as Y0 ?Ser or Thr following(?) YGIVT
- 62. Parent++ Yn-1 Y G Yn-2 Yn-3 Yn-4 Yn-5 I/L V T A1 A5 A3 A2 A4 B2 B3 B4 B5 Y0 Y0 Y0 ++ Parent0 ++ Parent* ?Small peaks at 629.33 and 629.87 ?Other doubly charged ions Parent0/parentˇŻ ?Drop of water (-18) (S or T) ?Drop of ammonia (-17) (Q, N, K, R) ?Tryptic peptides contain K/R
- 63. Chemistry for Biology Problems and solutions derivations on pH, pka, % dissociation, molarity, molality, preparation of buffers ; evaluation of kw etc.
- 69. HOW DOCK WORKS Step 1: Start with crystal coordinates of target receptor In this example, HIV-1 protease is the target receptor, with its active site aspartyl groups identified in red.
- 70. Step 2: Generate molecular surface for receptor This is performed using Mike Connolly's ms program. Note that only the surface for the active site needs to be generated
- 71. For the rest of this overview, we'll use a a blow up of the active site
- 72. Step 3: Generate spheres to fill the active site The shape of cavities in the receptor is used to define spheres; the centers of the spheres become potential localtions for ligand atoms. In the following picture, the sphere centers are identified by cyan triangles, and the sphere surfaces are shown:
- 73. Side view of spheres
- 74. Step 5: Scoring Each oriented molecule is then scored for fit. There are currently 3 scoring schemes: ?Shape scoring -- which uses a loose approximation to the Lennard-Jones potential ?Electrostatic scoring -- which uses the program DELPHI to calculate electrostatic potential ?Force-field scoring, which uses the AMBER potential In this example, this is the top-scoring orientation for the molecule thioketal in the HIV1-protease active site, using force-field scoring. (please note, this is a different orientation than previously published, as those runs were done using the shape scoring scheme, and a different version of the protease crystal structure
- 75. Final notes Here is a comparison of the top scoring orientation of the molecule thioketal with the orientation found in the crystal structure.
- 76. The journey of Labˇˇˇˇfrom 23rd Nov. to13th Dec,2016 At Biology Training in TDC, IISC,Kudapura, Challakere
- 77. Pollen germination test represented by bud formation as observed Under 40X in Light Microscope Pollen germination Employing Catharanthus roseus Pollens Initiation of bud formation Maturation and elongation of bud from pollen
- 78. SEED HEALTH TESTING INFECTED SEED INFESTED WITH FUNGAL HYPHAE
- 79. Negative stainining Catalase test Stages of mitosis from Onion root tip Bacterial Motility testing 3% KOH test for preliminary identification of Gram +Ve and Gram ¨CVe Bacterial colony şÝşÝߣ with mashed root tip after staining with acetocarmine
- 80. Principles of biology experiments meet the end at real life exposures ˇˇ. Pregnancy detection kit - Sugar and protein estimation by urine detection kit the presence or absence of hCG hormone in urine sample by immonodiffusion VISIPREG strip sandwich immune assay which uses anti-hCG in both native and conjugated forms Sugar normally is not found in urine. But when blood sugar level rise well above a target range which can occur in type 1 and type 2 diabetes, the kidneys sometimes releases sugar into the urine even when blood sugar levels are within a range
- 81. ODD assay in iimunotechnology Different anitgen and antibody samples used for ODD assay in iimunotechnology Ring of precipitation depends on conc. of antigen and antibody Agarose gel Distance of the wells leads to time dependent Precipitation ring development AntigenAntibody Antibody
- 82. Determination of ESR count ESR is represented as fall of RBCs in mm per hour
- 83. Determination of heamoglobin conc. In blood in terms of percentage
- 84. Blood grouping Total count of WBC And RBC in different chambers Of Newbauer slide in Haemocytometer Neutrophil Basophil Neutrophil Lymphocyte Monocyte Differential count of WBC by Giemsa staining
- 85. Thymus in dissected mouse White transparent lobes above heart Thymus, spleen and bonemarrow after dissection T cells and undiffrentiated lymphocyrte cel In bonemarrow extrafct after differential staining WBCˇŻs in thymus extract after differential staining
- 86. Ammonification in soil employing different soil sample Control Test
- 87. After 15 days Callus culture Conductance of Callus culture
- 88. Amplified DNA after PCR Purity checking of DNA after PCR in agarose gel electrophoresis Development of peak employing MS software to check purity of amplified DNAPCR in progress Polymerase chain reaction Non amplified DNA as control
- 89. Bacterial growth curve şÝşÝߣ culture for study of autotrophs Methyl Red test
- 90. Cell immobilization and inveratse assay from immobilized yeast cells on calcium alginate
- 91. SDS PAGE PROCESS AND DETERMINATION OF Mr FROM GRAPHICAL CALCULATIONS
- 92. Study of Barr Body from human cheek cells Sterilized spatula Staining of cheek cells (saliva samples) Saliva sample from male ¨C barr body absent As one X chromosome absent Sterilized spatula Saliva sample from female ¨C barr body present As two X chromosomes present Barr body Nucleus with no barr body Nucleus Barr body Nucleus
- 93. Study of Drosophila, polytene chromosome and mitotic chromosome Drosophila culturing Chloroform application Collected Drosophila after chloroform applied Identification of male and female Drosophila
- 94. Microtomy of Drosophila 3rd Instar larvae for salivary gland dissection Male and female Drosophila under Sterio Binocular Microscope at 4X S Salivary gland Neural Lobes ( frontal)
- 95. Poytene chromosome followed by saivary gland mashing and staining Poytene chromosome Mitotic chromosome followed by neural lobe mashing and staining All cells are in metaphase stage
- 96. Qualitative estimation of Proteins
- 97. Quantitative estimation of Proteins Lowry Method Colorimeter
- 98. Quantitative estimation of carbohydrate DNS Method
- 99. Study of protease activity from bromelein obtained form pine apple juice emplpying gelatinase test Control Test ¨C Liquification of gelatin followed by incubation at 250C
- 100. Estimation of Microbial load on handscrubbing method
- 102. Study of fungi Colony of Rhodotorula an yeast Branched fungal hyphae
- 104. Agarose gel electrophoresis, restriction digestion, ligation of DNA Pla B P R L Pla- Plant DNA B- Bacterial DNA P- Plasmid DNA R- Restriction Digestion markers L- Ligated DNA
- 105. First test before initiation of the training (Answer key) date: 23.11.2016 Assignments based on each day lectures delivered by resource persons
- 106. Assignments based on each day lectures delivered by resource persons (key answers with questions)
- 107. Post training evaluation ( questions with key answers of test II) 12.12.2016
- 109. ACKNOWLEDGEMENT The training would not be successful even initiated by me ˇ If I donˇŻt thank the following personaˇˇˇˇ.. TDC Training centre, IISC, Challakere for selecting me 1. Dr. B.S. Gowrishankar, HOD, Dept of Biotechnology, SIT , Tumkur 2. Dr. Shivakumaraiah, Principal , SIT,. Tumkur and Management of SIT, Tumkur 3. Faculty Staffs of Dept of Biotechnology, SIT, Tumkur 4. Non teaching staffs 5. My Family for support all the time invisibly 6. All my well wishers