


Telling the Story: Transforming Data & Evidence into a Compelling Narrative to Support Decision Making at Metrolinx
- 1. OCTOBER 23, 2018 SMART TRANSPORTATION FOR INTELLIGENT CITIES Director, Research & Planning Analytics, Metrolinx Joshua Engel-Yan Telling the Story: Transforming Data & Evidence into a Compelling Narrative to Support Decision Making at Metrolinx
- 2. 2 Q: Who is the Most Famous Transportation Planner of All Time?
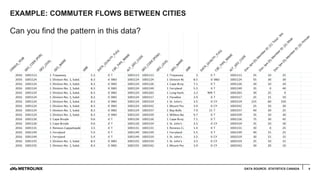
- 4. EXAMPLE: COMMUTER FLOWS BETWEEN CITIES 4 Can you find the pattern in this data? DATA SOURCE: STATISTICS CANADA
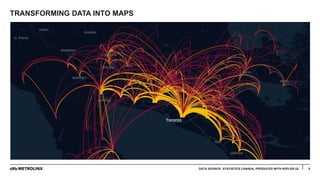
- 5. TRANSFORMING DATA INTO MAPS 5DATA SOURCE: STATISTICS CANADA, PRODUCED WITH KEPLER.GL
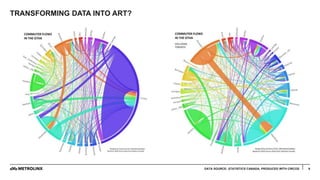
- 6. TRANSFORMING DATA INTO ART? 6DATA SOURCE: STATISTICS CANADA, PRODUCED WITH CIRCOS
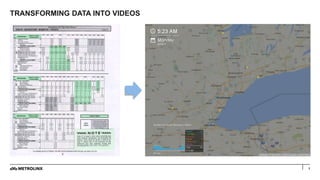
- 7. TRANSFORMING DATA INTO VIDEOS 7
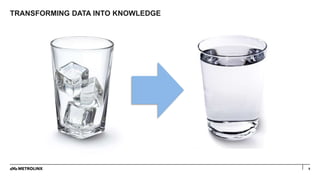
- 8. TRANSFORMING DATA INTO KNOWLEDGE 8
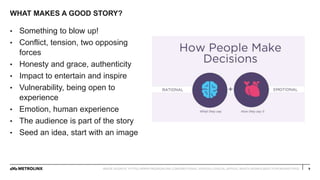
- 9. WHAT MAKES A GOOD STORY? 9 ŌĆó Something to blow up! ŌĆó Conflict, tension, two opposing forces ŌĆó Honesty and grace, authenticity ŌĆó Impact to entertain and inspire ŌĆó Vulnerability, being open to experience ŌĆó Emotion, human experience ŌĆó The audience is part of the story ŌĆó Seed an idea, start with an image IMAGE SOURCE: HTTPS://WWW.PM360ONLINE.COM/EMOTIONAL-VERSUS-LOGICAL-APPEAL-WHICH-WORKS-BEST-FOR-MARKETERS/
- 10. 10 Hi, IŌĆÖm Josh from Metrolinx. Today I would like to tell you a storyŌĆ”
- 11. 11SMART TRANSPORTATION FOR INTELLIGENT CITIES PROLOGUE Introduction to Research & Planning Analytics
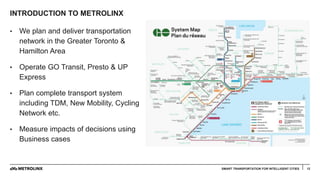
- 12. INTRODUCTION TO METROLINX 12 ŌĆó We plan and deliver transportation network in the Greater Toronto & Hamilton Area ŌĆó Operate GO Transit, Presto & UP Express ŌĆó Plan complete transport system including TDM, New Mobility, Cycling Network etc. ŌĆó Measure impacts of decisions using Business cases SMART TRANSPORTATION FOR INTELLIGENT CITIES
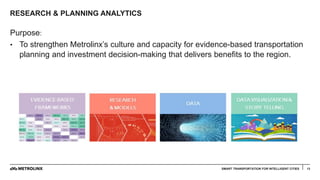
- 13. RESEARCH & PLANNING ANALYTICS Purpose: ŌĆó To strengthen MetrolinxŌĆÖs culture and capacity for evidence-based transportation planning and investment decision-making that delivers benefits to the region. 13SMART TRANSPORTATION FOR INTELLIGENT CITIES
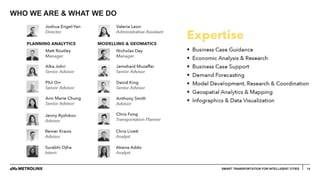
- 14. WHO WE ARE & WHAT WE DO 14SMART TRANSPORTATION FOR INTELLIGENT CITIES
- 15. WORLD PREMIERE
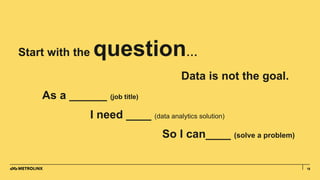
- 16. 1616 Start with the questionŌĆ” Data is not the goal. As a ______ (job title) I need ____ (data analytics solution) So I can____ (solve a problem)
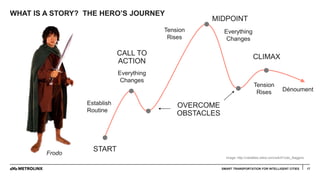
- 17. WHAT IS A STORY? THE HEROŌĆÖS JOURNEY 17SMART TRANSPORTATION FOR INTELLIGENT CITIES START CALL TO ACTION OVERCOME OBSTACLES MIDPOINT CLIMAX Establish Routine Everything Changes Tension Rises Tension Rises Everything Changes D├®noument Frodo Image: http://vsbattles.wikia.com/wiki/Frodo_Baggins
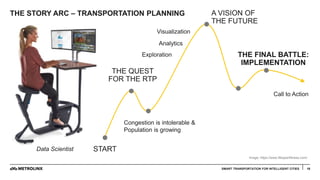
- 18. THE STORY ARC ŌĆō TRANSPORTATION PLANNING 18SMART TRANSPORTATION FOR INTELLIGENT CITIES 18 START THE QUEST FOR THE RTP A VISION OF THE FUTURE THE FINAL BATTLE: IMPLEMENTATION Congestion is intolerable & Population is growing Call to Action Data Scientist Image: https://www.lifespanfitness.com/ Visualization Analytics Exploration
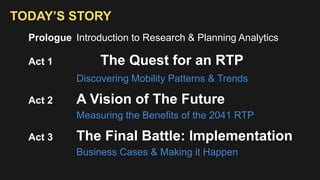
- 19. 19 TODAYŌĆÖS STORY Prologue Introduction to Research & Planning Analytics Act 1 The Quest for an RTP Discovering Mobility Patterns & Trends Act 2 A Vision of The Future Measuring the Benefits of the 2041 RTP Act 3 The Final Battle: Implementation Business Cases & Making it Happen
- 20. 20 Hi, IŌĆÖm Josh from Metrolinx. Today I would like to tell you a storyŌĆ”
- 21. 21 About how we used data, analytics & story telling to help create the 2041 Regional Transportation Plan
- 22. 22 How do create a transportation system that is safe, convenient, reliable and sustainable for a region that is rapidly growing & changing?
- 23. 23SMART TRANSPORTATION FOR INTELLIGENT CITIES It all began, a short time ago, In Union Station not so far awayŌĆ”
- 25. 2525SMART TRANSPORTATION FOR INTELLIGENT CITIES ACT ONE: The Quest for the 2041 Regional Transportation Plan Discovering Mobility Patterns & Trends
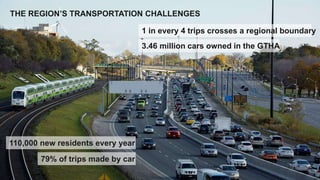
- 26. THE REGIONŌĆÖS TRANSPORTATION CHALLENGES 26 110,000 new residents every year 1 in every 4 trips crosses a regional boundary 79% of trips made by car 3.46 million cars owned in the GTHA
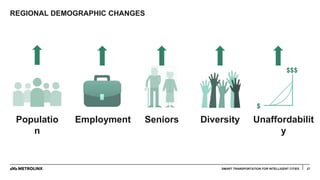
- 27. REGIONAL DEMOGRAPHIC CHANGES 27 $ $$$ Populatio n Employment Seniors Diversity Unaffordabilit y SMART TRANSPORTATION FOR INTELLIGENT CITIES
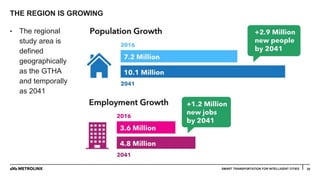
- 28. THE REGION IS GROWING 28 ŌĆó The regional study area is defined geographically as the GTHA and temporally as 2041 SMART TRANSPORTATION FOR INTELLIGENT CITIES
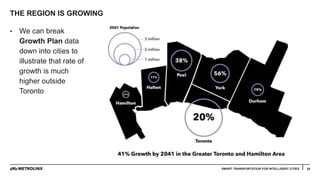
- 29. THE REGION IS GROWING 29 ŌĆó We can break Growth Plan data down into cities to illustrate that rate of growth is much higher outside Toronto SMART TRANSPORTATION FOR INTELLIGENT CITIES
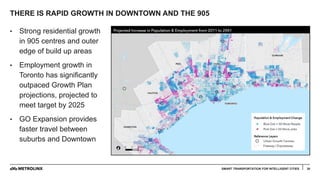
- 30. THERE IS RAPID GROWTH IN DOWNTOWN AND THE 905 30 ŌĆó Strong residential growth in 905 centres and outer edge of build up areas ŌĆó Employment growth in Toronto has significantly outpaced Growth Plan projections, projected to meet target by 2025 ŌĆó GO Expansion provides faster travel between suburbs and Downtown SMART TRANSPORTATION FOR INTELLIGENT CITIES
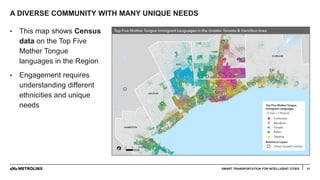
- 31. A DIVERSE COMMUNITY WITH MANY UNIQUE NEEDS 31 ŌĆó This map shows Census data on the Top Five Mother Tongue languages in the Region ŌĆó Engagement requires understanding different ethnicities and unique needs SMART TRANSPORTATION FOR INTELLIGENT CITIES
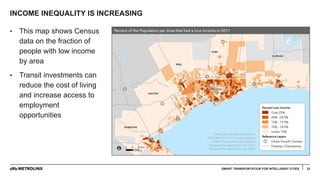
- 32. INCOME INEQUALITY IS INCREASING 32 ŌĆó This map shows Census data on the fraction of people with low income by area ŌĆó Transit investments can reduce the cost of living and increase access to employment opportunities SMART TRANSPORTATION FOR INTELLIGENT CITIES
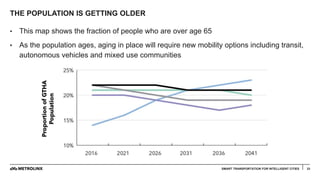
- 33. THE POPULATION IS GETTING OLDER 33 ŌĆó This map shows the fraction of people who are over age 65 ŌĆó As the population ages, aging in place will require new mobility options including transit, autonomous vehicles and mixed use communities SMART TRANSPORTATION FOR INTELLIGENT CITIES
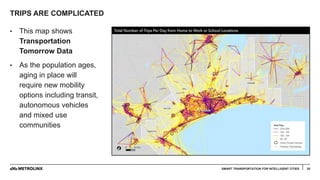
- 34. TRIPS ARE COMPLICATED 35 ŌĆó This map shows Transportation Tomorrow Data ŌĆó As the population ages, aging in place will require new mobility options including transit, autonomous vehicles and mixed use communities SMART TRANSPORTATION FOR INTELLIGENT CITIES
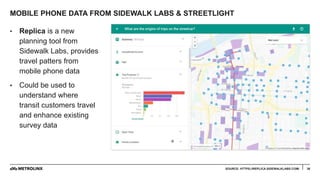
- 35. MOBILE PHONE DATA FROM SIDEWALK LABS & STREETLIGHT 36 ŌĆó Replica is a new planning tool from Sidewalk Labs, provides travel patters from mobile phone data ŌĆó Could be used to understand where transit customers travel and enhance existing survey data SOURCE: HTTPS://REPLICA.SIDEWALKLABS.COM/
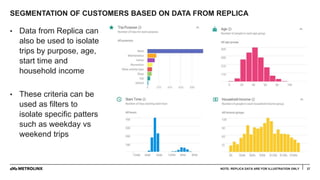
- 36. SEGMENTATION OF CUSTOMERS BASED ON DATA FROM REPLICA 37 ŌĆó Data from Replica can also be used to isolate trips by purpose, age, start time and household income ŌĆó These criteria can be used as filters to isolate specific patters such as weekday vs weekend trips NOTE: REPLICA DATA ARE FOR ILLUSTRATION ONLY
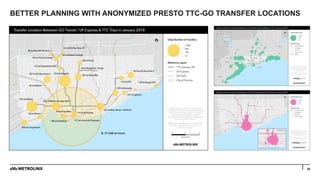
- 37. BETTER PLANNING WITH ANONYMIZED PRESTO TTC-GO TRANSFER LOCATIONS 38 ŌĆó Locations of population and employment have significant impacts on travel patterns
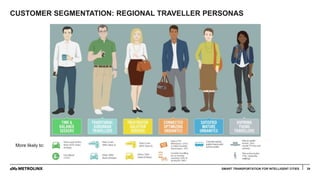
- 38. CUSTOMER SEGMENTATION: REGIONAL TRAVELLER PERSONAS 39SMART TRANSPORTATION FOR INTELLIGENT CITIES More likely to:
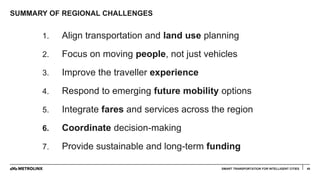
- 39. SUMMARY OF REGIONAL CHALLENGES 40 1. Align transportation and land use planning 2. Focus on moving people, not just vehicles 3. Improve the traveller experience 4. Respond to emerging future mobility options 5. Integrate fares and services across the region 6. Coordinate decision-making 7. Provide sustainable and long-term funding SMART TRANSPORTATION FOR INTELLIGENT CITIES
- 40. 4141SMART TRANSPORTATION FOR INTELLIGENT CITIES ACT TWO: A Vision of the Future Measuring the Benefits of the 2041 RTP
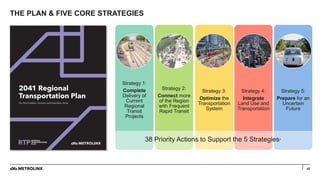
- 41. 42 THE PLAN & FIVE CORE STRATEGIES Strategy 1: Complete Delivery of Current Regional Transit Projects Strategy 2: Connect more of the Region with Frequent Rapid Transit Strategy 3: Optimize the Transportation System Strategy 4: Integrate Land Use and Transportation Strategy 5: Prepare for an Uncertain Future 38 Priority Actions to Support the 5 Strategies*
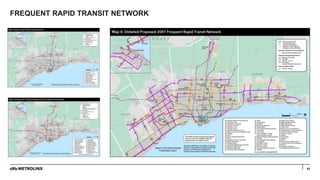
- 42. FREQUENT RAPID TRANSIT NETWORK 43
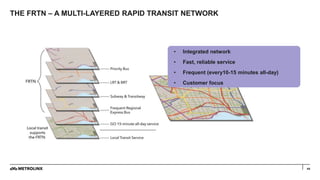
- 43. 44 THE FRTN ŌĆō A MULTI-LAYERED RAPID TRANSIT NETWORK ŌĆó Integrated network ŌĆó Fast, reliable service ŌĆó Frequent (every10-15 minutes all-day) ŌĆó Customer focus
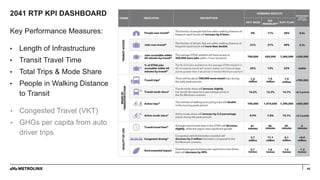
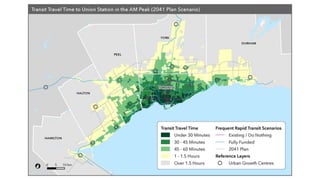
- 44. 2041 RTP KPI DASHBOARD 45 Key Performance Measures: ŌĆó Length of Infrastructure ŌĆó Transit Travel Time ŌĆó Total Trips & Mode Share ŌĆó People in Walking Distance to Transit ŌĆó Congested Travel (VKT) ŌĆó GHGs per capita from auto driver trips
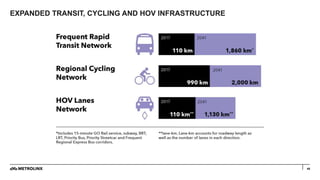
- 45. 46 EXPANDED TRANSIT, CYCLING AND HOV INFRASTRUCTURE
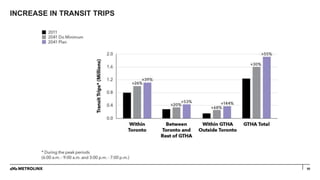
- 49. INCREASE IN TRANSIT TRIPS 50
- 50. 51
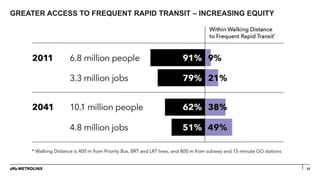
- 51. 52 GREATER ACCESS TO FREQUENT RAPID TRANSIT ŌĆō INCREASING EQUITY
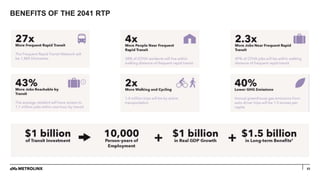
- 52. BENEFITS OF THE 2041 RTP 53
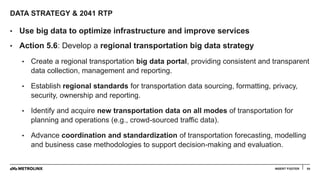
- 53. DATA STRATEGY & 2041 RTP 54 ŌĆó Use big data to optimize infrastructure and improve services ŌĆó Action 5.6: Develop a regional transportation big data strategy ŌĆó Create a regional transportation big data portal, providing consistent and transparent data collection, management and reporting. ŌĆó Establish regional standards for transportation data sourcing, formatting, privacy, security, ownership and reporting. ŌĆó Identify and acquire new transportation data on all modes of transportation for planning and operations (e.g., crowd-sourced traffic data). ŌĆó Advance coordination and standardization of transportation forecasting, modelling and business case methodologies to support decision-making and evaluation. INSERT FOOTER
- 54. 5555INSERT FOOTER ACT THREE The Final Battle: Implementation Business Cases & Making It Happen
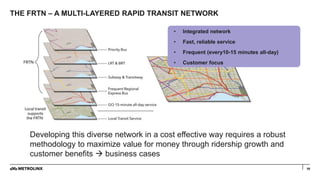
- 55. 56 THE FRTN ŌĆō A MULTI-LAYERED RAPID TRANSIT NETWORK ŌĆó Integrated network ŌĆó Fast, reliable service ŌĆó Frequent (every10-15 minutes all-day) ŌĆó Customer focus Developing this diverse network in a cost effective way requires a robust methodology to maximize value for money through ridership growth and customer benefits ’āĀ business cases
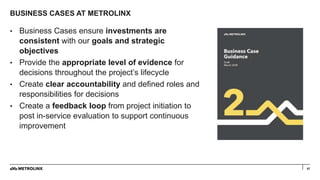
- 56. BUSINESS CASES AT METROLINX 57 ŌĆó Business Cases ensure investments are consistent with our goals and strategic objectives ŌĆó Provide the appropriate level of evidence for decisions throughout the projectŌĆÖs lifecycle ŌĆó Create clear accountability and defined roles and responsibilities for decisions ŌĆó Create a feedback loop from project initiation to post in-service evaluation to support continuous improvement
- 57. WORLD PREMIERE
- 58. 59INSERT FOOTER
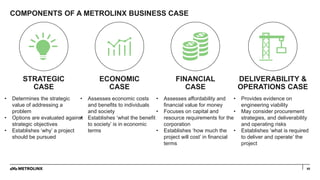
- 59. COMPONENTS OF A METROLINX BUSINESS CASE FINANCIAL CASE STRATEGIC CASE ECONOMIC CASE DELIVERABILITY & OPERATIONS CASE ŌĆó Determines the strategic value of addressing a problem ŌĆó Options are evaluated against strategic objectives ŌĆó Establishes ŌĆśwhyŌĆÖ a project should be pursued ŌĆó Assesses economic costs and benefits to individuals and society ŌĆó Establishes ŌĆśwhat the benefit to societyŌĆÖ is in economic terms ŌĆó Assesses affordability and financial value for money ŌĆó Focuses on capital and resource requirements for the corporation ŌĆó Establishes ŌĆśhow much the project will costŌĆÖ in financial terms ŌĆó Provides evidence on engineering viability ŌĆó May consider procurement strategies, and deliverability and operating risks ŌĆó Establishes ŌĆśwhat is required to deliver and operateŌĆÖ the project 60
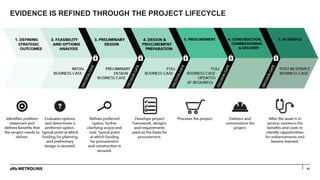
- 60. EVIDENCE IS REFINED THROUGH THE PROJECT LIFECYCLE 61
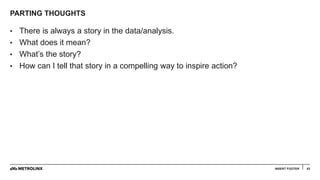
- 62. PARTING THOUGHTS 63 ŌĆó There is always a story in the data/analysis. ŌĆó What does it mean? ŌĆó WhatŌĆÖs the story? ŌĆó How can I tell that story in a compelling way to inspire action? INSERT FOOTER
- 63. 64
- 64. Research & Planning Analytics, Planning & Development, Metrolinx Joshua.Engel-Yan@Metrolinx.com Thank You
Editor's Notes
- #11: Say hello, introduce yourself and say
- #14: Planning transit projects requires robust and accessible evidence to develop and evaluate options A recent survey of the region found that ŌĆśmaking fact-based decisionsŌĆÖ is a top driver of trust in Metrolinx Public trust is built and maintained by the timely publication of relevant and reasonable evidence
- #17: Say hello, introduce yourself and say what the question for the RTP was: how do we plan to improve mobility in a growing region?
- #20: This presentation will follow a three act structure, like
- #21: Say hello, introduce yourself and say
- #22: Say hello, introduce yourself and say
- #23: Say hello, introduce yourself and say what the question for the RTP was: how do we plan to improve mobility in a growing region?
- #26: Act 1 The Quest for a Regional Transportation Plan Discovering Regional Mobility Patterns & Trends Act 2 A Vision of The Future Measuring the Benefits of the 2041 RTP Act 2 The Final Battle: Implementation Business Cases & Making it Happen
- #27: Check stats**
- #28: As we know, the GTHAŌĆÖs population is rapidly growing, and is expected to reach 10.1 million people compared to 7.2 million today. The majority of this growth is happening outside of Toronto, in the suburbs with less access to transit. In addition to a growing population, the region is seeing a growing senior population and increasing ethnic diversity. The cost of living in the GTHA is also increasing, all while income becomes more polarized. This changing socioeconomic landscape increases the need for an inclusive and equitable transportation system: to support the diverse backgrounds and needs of its riders and to maintain and increase ridership
- #42: Act 1 The Quest for a Regional Transportation Plan Discovering Regional Mobility Patterns & Trends Act 2 A Vision of The Future Measuring the Benefits of the 2041 RTP Act 2 The Final Battle: Implementation Business Cases & Making it Happen
- #45: The transit system of the future must rethink how services are delivered if transit is to serve a wide range of needs across the Region. The RTP introduces the concept of a FRTN to meet the regionŌĆÖs long-term needs. The FRTN is a strategic approach to moving people efficiently by transit in a region with multiple population and employment concentrations. The vision for the FRTN is a network of Priority Bus, Frequent Regional Express Bus, Subway, BRT, LRT, and heavy rail corridors that function as a seamless system of frequent rapid transit. The layering of multiple modes in the network enables expansive coverage across the region. The FRTN incorporates a new concept called ŌĆ£Priority busŌĆØ - an approach to enhance and transform how rapid transit is delivered and operates in the GTHA, by leveraging intelligent transportation systems technologies with minimal infrastructure investment. The prioritization framework aims at looking at all these types of projects, and evaluating them to see where the investment most strengthens the FRTN, through ridership and customer value. This requires state-of-the-art analysis to forecast the impacts of these very different projects, which Mx is trying to embed in the business case methodology.
- #55: Big Data and the RTP 2041 Use big data to optimize infrastructure and improve services ŌĆō page 92 Action 5.6: Develop a regional transportation big data strategy ŌĆō page 94 Develop a regional transportation big data strategy: Create a regional transportation big data portal, providing consistent and transparent data collection, management and reporting. Establish regional standards for transportation data sourcing, formatting, privacy, security, ownership and reporting. [NOTE: Or champion the use of new and relevant international standards] Identify and acquire new transportation data on all modes of transportation for planning and operations (e.g., crowd-sourced traffic data). Advance coordination and standardization of transportation forecasting, modelling and business case methodologies to support decision-making and evaluation. Big Data and the Making it Happen Paper ŌĆō page 30 Develop a coordinated regional data collection program and observatory, including approaches to real-time data, ridership, big data and goods movement data; Develop a more consistent approach to travel demand modelling across GTHA municipalities, provincial ministries, and academic institutions; Develop performance targets for 2041 RTP that inform the implementation process; and Building on existing practices, identify the ideal governance and funding sources for collecting, analyzing and sharing regional transportation data and insights. In addition Develop protocols to identify and collect key data that our equipment and services produce, and identify new sources of data based on the information we need. As we increase the number of contracts and partnerships, establish policies around data collection and sharing to ensure that we receive and can analyze and leverage data collected by our partners. For example, cities and agencies that have partnered with Uber have sometimes found it difficult to gain access to the data produced. All agreements with our providers and partners should include clauses around data to enable future access to these data sources. Develop the internal capacity to analyze data. Analytics experts are in high demand and may require a specific attraction and retention strategy. Continue to work with the province on Open Government with an emphasis on sharing data to better achieve our objectives.
- #56: Act 1 The Quest for a Regional Transportation Plan Discovering Regional Mobility Patterns & Trends Act 2 A Vision of The Future Measuring the Benefits of the 2041 RTP Act 2 The Final Battle: Implementation Business Cases & Making it Happen
- #57: The transit system of the future must rethink how services are delivered if transit is to serve a wide range of needs across the Region. The RTP introduces the concept of a FRTN to meet the regionŌĆÖs long-term needs. The FRTN is a strategic approach to moving people efficiently by transit in a region with multiple population and employment concentrations. The vision for the FRTN is a network of Priority Bus, Frequent Regional Express Bus, Subway, BRT, LRT, and heavy rail corridors that function as a seamless system of frequent rapid transit. The layering of multiple modes in the network enables expansive coverage across the region. The FRTN incorporates a new concept called ŌĆ£Priority busŌĆØ - an approach to enhance and transform how rapid transit is delivered and operates in the GTHA, by leveraging intelligent transportation systems technologies with minimal infrastructure investment. The prioritization framework aims at looking at all these types of projects, and evaluating them to see where the investment most strengthens the FRTN, through ridership and customer value. This requires state-of-the-art analysis to forecast the impacts of these very different projects, which Mx is trying to embed in the business case methodology.
- #61: Metrolinx has a clear framework for appraising, developing and planning projects that deliver the best possible value to the public Business Cases support collaboration and documentation among diverse cross-functional teams, and provide evidence for decision makers Comprehensive guidance and training materials are being developed to assist in the development of business cases A three day training session was delivered in September 2015, in collaboration with the Institute for Transport Studies at the University of Leeds
- #63: Act 1 The Quest for a Regional Transportation Plan Discovering Regional Mobility Patterns & Trends Act 2 A Vision of The Future Measuring the Benefits of the 2041 RTP Act 2 The Final Battle: Implementation Business Cases & Making it Happen