The Gila-Salt-Verde River System: Improving River Forecasts and Emergency Management through Visualization
Download as PPTX, PDF0 likes818 views

The document proposes developing a prototype mash-up using visual analytics concepts to enhance river operations forecasting for the Gila-Salt-Verde River System in Arizona. The goals are to provide a one-stop source for web-based forecasts and increase efficiency for operators. The methodology involves creating an interactive map with the Google Maps API that integrates stream gauge, dam and hydrologic data. Operators will test the prototype versus existing tools to evaluate if it reduces time to access forecast data. If successful, the concepts could be expanded to other river systems for improved emergency management and decision making.

The Gila-Salt-Verde River System: Improving River Forecasts and Emergency Management through Visualization
- 1. The Gila-Salt-Verde River System: Improving River Forecasts and Emergency Management through Visualization Douglas Blatchford, PE Pennsylvania State MGIS Program Advisors: Dr. Miller, Dr. Reed, Dr. Kollat Geography 596A, Summer 2013
- 2. Overview ’āś Background ’āś Colorado River/Gila River Systems ’āś Operation and emergency management forecast web apps in the Phoenix metropolitan area ’āś Visual Analytics ’āś Goals and objectives ’āś Enhance existing web-based tools through visualization ’āś Proposed methodology ’āś Develop mash-up based on Google Map API ’āś Project timeline
- 3. Background ’āś Gila is a major tributary to the Colorado River System ’āś Flows through southern Arizona ’āś Dams provide water supply and flood protection for Phoenix metro area ’āś Dams operated by Salt River Project (SRP) and the United States Army Corp of Engineers (USACE) ’āś Operations forecast is key to managing water resources
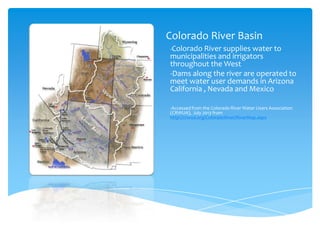
- 4. Colorado River Basin -Colorado River supplies water to municipalities and irrigators throughout the West -Dams along the river are operated to meet water user demands in Arizona California , Nevada and Mexico -Accessed from the Colorado River Water Users Association (CRWUA), July 2013 from http://crwua.org/ColoradoRiver/RiverMap.aspx
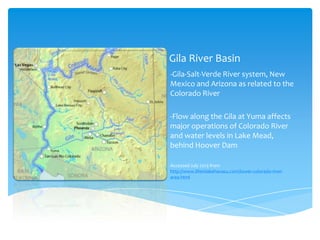
- 5. Gila River Basin -Gila-Salt-Verde River system, New Mexico and Arizona as related to the Colorado River -Flow along the Gila at Yuma affects major operations of Colorado River and water levels in Lake Mead, behind Hoover Dam Accessed July 2013 from http://www.lifeinlakehavasu.com/lower-colorado-riverarea.html
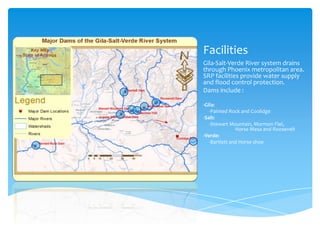
- 6. Facilities Gila-Salt-Verde River system drains through Phoenix metropolitan area. SRP facilities provide water supply and flood control protection. Dams include : -Gila: -Painted Rock and Coolidge -Salt: -Stewart Mountain, Mormon Flat, Horse Mesa and Roosevelt -Verde: -Bartlett and Horse shoe
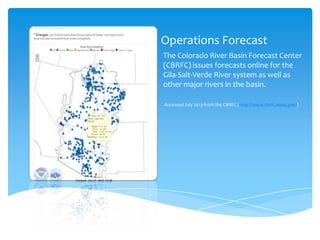
- 7. Operations Forecast The Colorado River Basin Forecast Center (CBRFC) issues forecasts online for the Gila-Salt-Verde River system as well as other major rivers in the basin. Accessed July 2013 from the CBRFC (http://www.cbrfc.noaa.gov/)
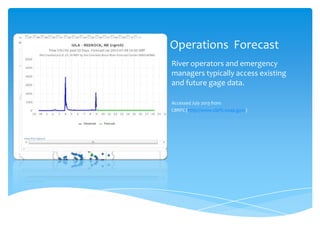
- 8. Operations Forecast River operators and emergency managers typically access existing and future gage data. Accessed July 2013 from CBRFC (http://www.cbrfc.noaa.gov/)
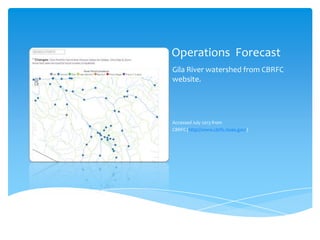
- 9. Operations Forecast Gila River watershed from CBRFC website. Accessed July 2013 from CBRFC (http://www.cbrfc.noaa.gov/)
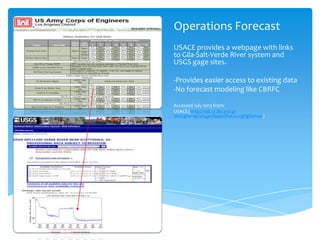
- 10. Operations Forecast USACE provides a webpage with links to Gila-Salt-Verde River system and USGS gage sites. -Provides easier access to existing data -No forecast modeling like CBRFC Accessed July 2013 from: USACE (http://198.17.86.43/cgibin/cgiwrap/zinger/basinStatus.cgi?gilariver)
- 11. Visual Analytics Visual analytics is an outgrowth of the fields of: Information visualization Scientific visualization Analytical reasoning Facilitated by interactive visual interfaces Goal is to process data for analytic discourse Constructive evaluation, correction, and rapid development of processes and models This ultimately improves our knowledge and decisions
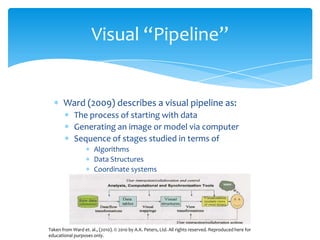
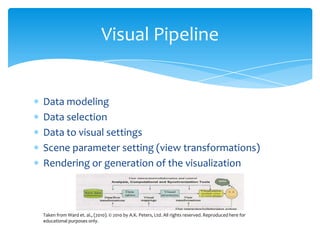
- 12. Visual ŌĆ£PipelineŌĆØ Ward (2009) describes a visual pipeline as: The process of starting with data Generating an image or model via computer Sequence of stages studied in terms of Algorithms Data Structures Coordinate systems Taken from Ward et. al., (2010). ┬® 2010 by A.K. Peters, Ltd. All rights reserved. Reproduced here for educational purposes only.
- 13. Visual Pipeline Data modeling Data selection Data to visual settings Scene parameter setting (view transformations) Rendering or generation of the visualization Taken from Ward et. al., (2010). ┬® 2010 by A.K. Peters, Ltd. All rights reserved. Reproduced here for educational purposes only.
- 14. Goals and Objectives ’āś Develop a ŌĆ£one-stopŌĆØ source of web-based forecasts for the Gila-Salt-Verde system ’āś Implement web-based prototype and tool using the concepts of visual analytics ’āś Increase SRP and USACE operational efficiency
- 15. Proposed Methodology ’āś Develop mash-up to be tested by operators at USACE and SRP ’āś Use a Google Map API, with Fusion Tables ’āś Includes gage, dam and other hydrographic information ’āś Visual analysis will be tested by timing access to information ’āś Questionnaire developed for operators, asking to access gage data from the prototype or from the CBRFC or USACE websites
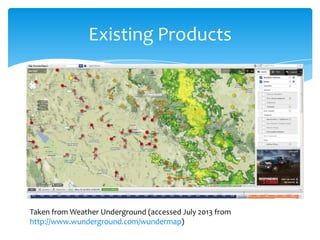
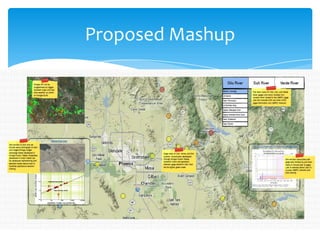
- 16. Proposed Mash-up Geographic extent: Painted Rock Dam on the west to Coolidge on the east Designed as a prototype specific to SRP/USACE Further work will be necessary to offer more capabilities Anticipated outcome: will take less time to access forecast data Existing mash-ups already use National Climatic Database (NCDB) such as WunderMap (http://www.wunderground.com/wundermap/)
- 17. Existing Products Taken from Weather Underground (accessed July 2013 from http://www.wunderground.com/wundermap)
- 18. Proposed Mashup
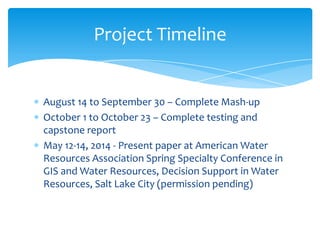
- 19. Project Timeline August 14 to September 30 ŌĆō Complete Mash-up October 1 to October 23 ŌĆō Complete testing and capstone report May 12-14, 2014 - Present paper at American Water Resources Association Spring Specialty Conference in GIS and Water Resources, Decision Support in Water Resources, Salt Lake City (permission pending)
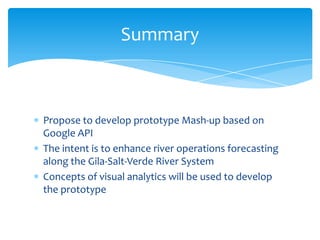
- 20. Summary Propose to develop prototype Mash-up based on Google API The intent is to enhance river operations forecasting along the Gila-Salt-Verde River System Concepts of visual analytics will be used to develop the prototype
- 21. References Andrienko, G., Andrienko, N., Dykes, J., Kraak, M., & Schumann, H. (2010). GeoVA(t)-geospatial visual analytics: focus on time. International Journal of Geographical Information Science, 24:10, 1453-1457. Andrienko, G., Andrienko, N., Ursaka, D., Dransch, D., Jason, D., Fabrikant, S.I., Mikail, J., Kraak, M., Schumann, H. & Tominski, C. (2010). Space, time, and visual analytics. International Journal of Geographical Information Science, 24:10, 1577-1600. CBRFC (accessed July 2013 from http://www.cbrfc.noaa.gov/) Kasprzyk, J., Nataraj, S., Reed, P.M., & Lempert, R.J. (2013). Many objective robust decision making for complex environmental systems undergoing change. Environmental Modeling & Software, 42, 55-71. Keim, D.A. (2002). Information visualization and visual data mining. IEEE transactions on visualization and computer graphics, 8:1, 18. Keim, D., Andrienko, G., Fekete, J., Carsten, G., Kohlhammer, J., & Melancon, G. (2008). Visual analytics: definition, process, and challenges. Information Visualization, LNCS 4950, 154-175. Kollat, J. B., & Reed, P.M. (2006). Comparing state-of-the-art evolutionary multi-objective algorithms for long-term groundwater monitoring design. Advances in Water Resources, 29, 792-807. Kollat, J.B., & Reed, P. (2007). A framework for visually interactive decision-making and design using evolutionary multi-objective optimization (VIDEO). Environmental Modeling & Software, 22, 1691-1704. MacEachren, A.M., & Kraak, M. (1997). Exploratory cartographic visualization: advancing the agenda. Computers & Geosciences, 23:4, 335-343.
- 22. References (cont) Reed, P.M., Hadka, D., Herman, J.D., Kasprzyk, J.R., & Kollat, J.B. (2013). Evolutionary multiobjective optimization in water resources: the past, present, and future. Advances in Water Resources, 51, 438-456. Tang, Y., Reed, P.M., & Kollat, J. B. (2007). Parallelization strategies for rapid and robust evolutionary multiobjective optimization in water resources applications. Advances in Water Resources 30, 335-353. USACE (accessed July 2013 from http://198.17.86.43/cgi-bin/cgiwrap/zinger/basinStatus.cgi?gilariver). Ward, M., Grinstein, G., & Keim, D. (2010). Interactive data visualization: Foundations, techniques, and applications. Natick, MA: A K Peters, Ltd. Xie, X., & Zhang, D. (2010). Data assimilation for distributed hydrological catchment modeling via ensemble Kalman filter. Advances in Water Resources, 33, 678-690.
- 23. Questions ?