What's Inside Intellectual Ventures' Patent Portfolio
- 1. Intellectual Ventures Portfolio Analysis - Preview Erik Oliver and Kent Richardson March 2014 Copyright 2014 ROL Group 1
- 2. Notes This is a preview of a longer analysis that ROL Group is undertaking The final results will appear in IAM Magazine later in 2014 Sources (when not otherwise noted) ŌĆó IV public patent list ŌĆó Patent metadata from Thomson Innovation Still finalizing data, please do not redistribute this version outside the Gathering Copyright 2014 ROL Group 2
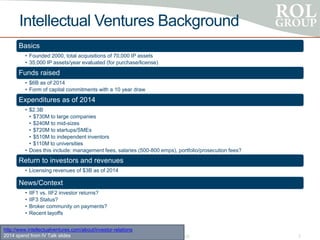
- 3. Intellectual Ventures Background Basics ŌĆó Founded 2000, total acquisitions of 70,000 IP assets ŌĆó 35,000 IP assets/year evaluated (for purchase/license) Funds raised ŌĆó $6B as of 2014 ŌĆó Form of capital commitments with a 10 year draw Expenditures as of 2014 ŌĆó $2.3B ŌĆó $730M to large companies ŌĆó $240M to mid-sizes ŌĆó $720M to startups/SMEs ŌĆó $510M to independent inventors ŌĆó $110M to universities ŌĆó Does this include: management fees, salaries (500-800 emps), portfolio/prosecution fees? Return to investors and revenues ŌĆó Licensing revenues of $3B as of 2014 News/Context ŌĆó IIF1 vs. IIF2 investor returns? ŌĆó IIF3 Status? ŌĆó Broker community on payments? ŌĆó Recent layoffs Copyright 2014 ROL Group 3 http://www.intellectualventures.com/about/investor-relations 2014 spend from IV Talk slides
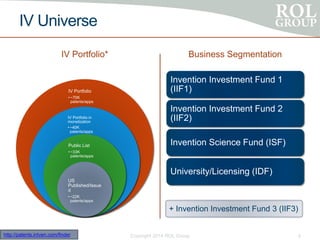
- 4. IV Universe IV Portfolio* IV Portfolio ŌĆó ~70K patents/apps IV Portfolio in monetization ŌĆó ~40K patents/apps Public List ŌĆó ~33K patents/apps US Published/Issue d ŌĆó ~22K patents/apps Business Segmentation Invention Investment Fund 1 (IIF1) Invention Investment Fund 2 (IIF2) Invention Science Fund (ISF) University/Licensing (IDF) Copyright 2014 ROL Group 4http://patents.intven.com/finder + Invention Investment Fund 3 (IIF3)
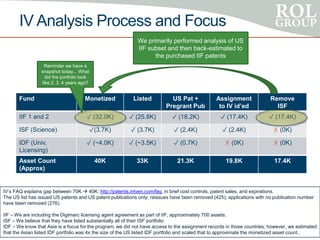
- 5. IV Analysis Process and Focus Copyright 2014 ROL Group 5 Fund Monetized Listed US Pat + Pregrant Pub Assignment to IV idŌĆÖed Remove ISF IIF 1 and 2 Ō£ō (32.0K) Ō£ō (25.8K) Ō£ō (18.2K) Ō£ō (17.4K) Ō£ō (17.4K) ISF (Science) Ō£ō(3.7K) Ō£ō (3.7K) Ō£ō (2.4K) Ō£ō (2.4K) Ō£Ś (0K) IDF (Univ. Licensing) Ō£ō (~4.0K) Ō£ō (~3.5K) Ō£ō (0.7K) Ō£Ś (0K) Ō£Ś (0K) Asset Count (Approx) 40K 33K 21.3K 19.8K 17.4K IVŌĆÖs FAQ explains gap between 70K ’āĀ 40K: http://patents.intven.com/faq, in brief cost controls, patent sales, and expirations. The US list has issued US patents and US patent publications only; reissues have been removed (425); applications with no publication number have been removed (276). IIF ŌĆō We are including the Digimarc licensing agent agreement as part of IIF, approximately 700 assets. ISF ŌĆō We believe that they have listed substantially all of their ISF portfolio IDF ŌĆō We know that Asia is a focus for the program, we did not have access to the assignment records in those countries; however, we estimated that the Asian listed IDF portfolio was 4x the size of the US listed IDF portfolio and scaled that to approximate the monetized asset count.. We primarily performed analysis of US IIF subset and then back-estimated to the purchased IIF patents Reminder we have a snapshot today... What did the portfolio look like 2, 3, 4 years ago?
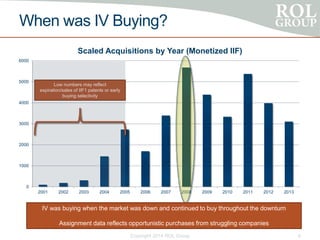
- 6. When was IV Buying? Copyright 2014 ROL Group 6 0 1000 2000 3000 4000 5000 6000 2001 2002 2003 2004 2005 2006 2007 2008 2009 2010 2011 2012 2013 Scaled Acquisitions by Year (Monetized IIF) IV was buying when the market was down and continued to buy throughout the downturn Assignment data reflects opportunistic purchases from struggling companies Low numbers may reflect expiration/sales of IIF1 patents or early buying selectivity
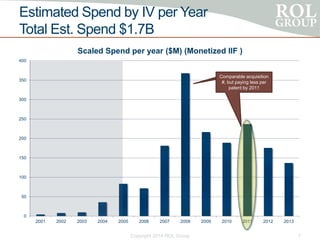
- 7. Estimated Spend by IV per Year Total Est. Spend $1.7B Copyright 2014 ROL Group 7 0 50 100 150 200 250 300 350 400 2001 2002 2003 2004 2005 2006 2007 2008 2009 2010 2011 2012 2013 Scaled Spend per year ($M) (Monetized IIF ) Comparable acquisition #, but paying less per patent by 2011
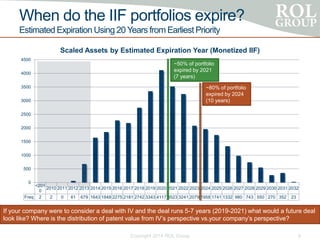
- 8. When do the IIF portfolios expire? Estimated Expiration Using 20 Years from Earliest Priority Copyright 2014 ROL Group 8 <201 0 2010 2011 2012 2013 2014 2015 2016 2017 2018 2019 2020 2021 2022 2023 2024 2025 2026 2027 2028 2029 2030 2031 2032 Freq 2 2 0 61 679 1643 1848 2275 2181 2742 3343 4117 3523 3241 2079 1958 1741 1332 980 743 550 270 352 23 0 500 1000 1500 2000 2500 3000 3500 4000 4500 Scaled Assets by Estimated Expiration Year (Monetized IIF) ~50% of portfolio expired by 2021 (7 years) ~80% of portfolio expired by 2024 (10 years) If your company were to consider a deal with IV and the deal runs 5-7 years (2019-2021) what would a future deal look like? Where is the distribution of patent value from IVŌĆÖs perspective vs.your companyŌĆÖs perspective?
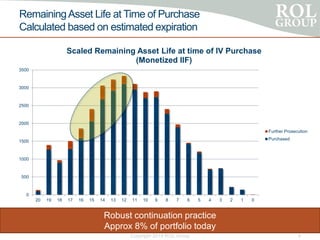
- 9. RemainingAsset Life at Time of Purchase Calculated based on estimated expiration Copyright 2014 ROL Group 9 Robust continuation practice Approx 8% of portfolio today 0 500 1000 1500 2000 2500 3000 3500 20 19 18 17 16 15 14 13 12 11 10 9 8 7 6 5 4 3 2 1 0 Scaled Remaining Asset Life at time of IV Purchase (Monetized IIF) Further Prosecution Purchased
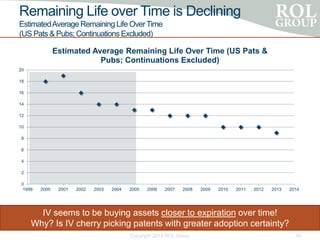
- 10. Remaining Life over Time is Declining EstimatedAverage Remaining Life OverTime (US Pats & Pubs; Continuations Excluded) Copyright 2014 ROL Group 10 IV seems to be buying assets closer to expiration over time! Why? Is IV cherry picking patents with greater adoption certainty? 0 2 4 6 8 10 12 14 16 18 20 1999 2000 2001 2002 2003 2004 2005 2006 2007 2008 2009 2010 2011 2012 2013 2014 Estimated Average Remaining Life Over Time (US Pats & Pubs; Continuations Excluded)
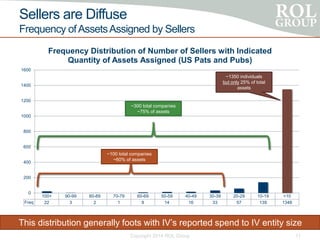
- 11. Sellers are Diffuse Frequency ofAssetsAssigned by Sellers Copyright 2014 ROL Group 11 100+ 90-99 80-89 70-79 60-69 50-59 40-49 30-39 20-29 10-19 <10 Freq 22 3 2 1 8 14 16 33 57 139 1348 0 200 400 600 800 1000 1200 1400 1600 Frequency Distribution of Number of Sellers with Indicated Quantity of Assets Assigned (US Pats and Pubs) ~100 total companies ~60% of assets ~300 total companies ~75% of assets ~1350 individuals but only 25% of total assets This distribution generally foots with IVŌĆÖs reported spend to IV entity size
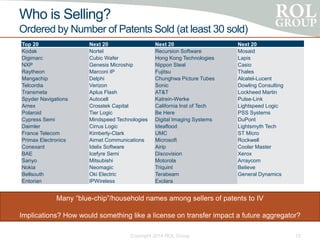
- 12. Who is Selling? Ordered by Number of Patents Sold (at least 30 sold) Top 20 Next 20 Next 20 Next 20 Kodak Nortel Recursion Software Mosaid Digimarc Cubic Wafer Hong Kong Technologies Lapis NXP Genesis Microship Nippon Steal Casio Raytheon Marconi IP Fujitsu Thales Mangachip Delphi Chunghwa Picture Tubes Alcatel-Lucent Telcordia Verizon Sonic Dowling Consulting Transmeta Aplus Flash AT&T Lockheed Martin Spyder Navigations Autocell Katrein-Werke Pulse-Link Amex Crosstek Capital California Inst of Tech Lightspeed Logic Polaroid Tier Logic Be Here PSS Systems Cypress Semi Mindspeed Technologies Digital Imaging Systems DuPont Daimler Cirrus Logic Ideaflood Lightsmyth Tech France Telecom Kimberly-Clark UMC ST Micro Primax Electronics Airnet Communications Microsoft Rockwell Conexant Idelix Software Airip Cooler Master BAE Icefyre Semi Discovision Xerox Sanyo Mitsubishi Motorola Arraycom Nokia Neomagic Triquint Believe Bellsouth Oki Electric Terabeam General Dynamics Entorian IPWireless Exclara Copyright 2014 ROL Group 12 Many ŌĆ£blue-chipŌĆØ/household names among sellers of patents to IV Implications? How would something like a license on transfer impact a future aggregator?
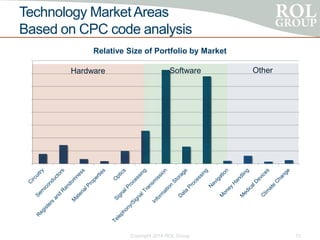
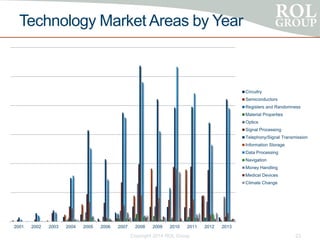
- 13. Technology MarketAreas Based on CPC code analysis Copyright 2014 ROL Group 13 0 1000 2000 3000 4000 5000 6000 7000 8000 Relative Size of Portfolio by Market Hardware Software Other
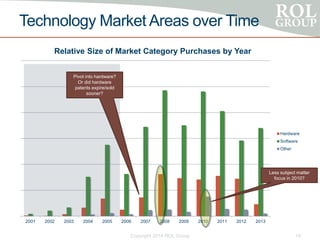
- 14. 2001 2002 2003 2004 2005 2006 2007 2008 2009 2010 2011 2012 2013 Relative Size of Market Category Purchases by Year Hardware Software Other Technology Market Areas over Time Copyright 2014 ROL Group 14 Less subject matter focus in 2010? Pivot into hardware? Or did hardware patents expire/sold sooner?
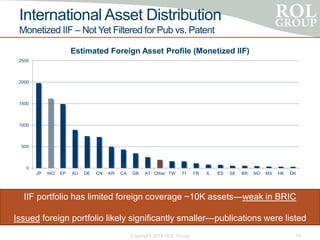
- 15. International Asset Distribution Monetized IIF ŌĆō Not Yet Filtered for Pub vs. Patent Copyright 2014 ROL Group 15 IIF portfolio has limited foreign coverage ~10K assetsŌĆöweak in BRIC Issued foreign portfolio likely significantly smallerŌĆöpublications were listed 0 500 1000 1500 2000 2500 JP WO EP AU DE CN KR CA GB AT Other TW FI FR IL ES SE BR NO MX HK DK Estimated Foreign Asset Profile (Monetized IIF)
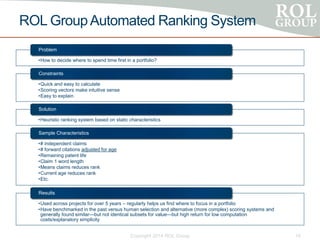
- 16. ROL GroupAutomated Ranking System ŌĆóHow to decide where to spend time first in a portfolio? Problem ŌĆóQuick and easy to calculate ŌĆóScoring vectors make intuitive sense ŌĆóEasy to explain Constraints ŌĆóHeuristic ranking system based on static characteristics Solution ŌĆó# independent claims ŌĆó# forward citations adjusted for age ŌĆóRemaining patent life ŌĆóClaim 1 word length ŌĆóMeans claims reduces rank ŌĆóCurrent age reduces rank ŌĆóEtc. Sample Characteristics ŌĆóUsed across projects for over 5 years ŌĆō regularly helps us find where to focus in a portfolio ŌĆóHave benchmarked in the past versus human selection and alternative (more complex) scoring systems and generally found similarŌĆöbut not identical subsets for valueŌĆöbut high return for low computation costs/explanatory simplicity Results Copyright 2014 ROL Group 16
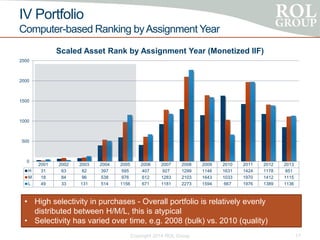
- 17. IV Portfolio Computer-based Ranking byAssignment Year Copyright 2014 ROL Group 17 2001 2002 2003 2004 2005 2006 2007 2008 2009 2010 2011 2012 2013 H 31 63 82 397 595 407 927 1299 1146 1631 1424 1178 851 M 18 84 96 538 976 612 1283 2103 1643 1033 1970 1412 1115 L 49 33 131 514 1156 671 1181 2273 1594 667 1976 1389 1136 0 500 1000 1500 2000 2500 Scaled Asset Rank by Assignment Year (Monetized IIF) ŌĆó High selectivity in purchases - Overall portfolio is relatively evenly distributed between H/M/L, this is atypical ŌĆó Selectivity has varied over time, e.g. 2008 (bulk) vs. 2010 (quality)
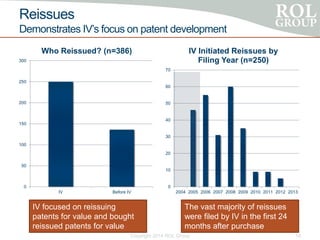
- 18. Reissues Demonstrates IVŌĆÖs focus on patent development Copyright 2014 ROL Group 18 0 50 100 150 200 250 300 IV Before IV Who Reissued? (n=386) 0 10 20 30 40 50 60 70 2004 2005 2006 2007 2008 2009 2010 2011 2012 2013 IV Initiated Reissues by Filing Year (n=250) IV focused on reissuing patents for value and bought reissued patents for value The vast majority of reissues were filed by IV in the first 24 months after purchase
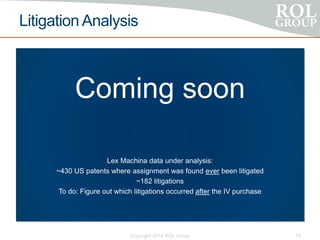
- 19. Litigation Analysis Coming soon Lex Machina data under analysis: ~430 US patents where assignment was found ever been litigated ~182 litigations To do: Figure out which litigations occurred after the IV purchase Copyright 2014 ROL Group 19
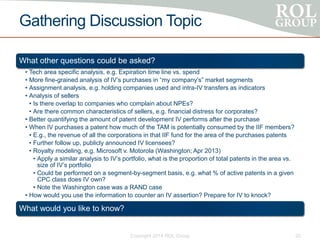
- 20. Gathering Discussion Topic What other questions could be asked? ŌĆó Tech area specific analysis, e.g. Expiration time line vs. spend ŌĆó More fine-grained analysis of IVŌĆÖs purchases in ŌĆ£my companyŌĆÖsŌĆØ market segments ŌĆó Assignment analysis, e.g. holding companies used and intra-IV transfers as indicators ŌĆó Analysis of sellers ŌĆó Is there overlap to companies who complain about NPEs? ŌĆó Are there common characteristics of sellers, e.g. financial distress for corporates? ŌĆó Better quantifying the amount of patent development IV performs after the purchase ŌĆó When IV purchases a patent how much of the TAM is potentially consumed by the IIF members? ŌĆó E.g., the revenue of all the corporations in that IIF fund for the area of the purchases patents ŌĆó Further follow up, publicly announced IV licensees? ŌĆó Royalty modeling, e.g. Microsoft v. Motorola (Washington; Apr 2013) ŌĆó Apply a similar analysis to IVŌĆÖs portfolio, what is the proportion of total patents in the area vs. size of IVŌĆÖs portfolio ŌĆó Could be performed on a segment-by-segment basis, e.g. what % of active patents in a given CPC class does IV own? ŌĆó Note the Washington case was a RAND case ŌĆó How would you use the information to counter an IV assertion? Prepare for IV to knock? What would you like to know? Copyright 2014 ROL Group 20
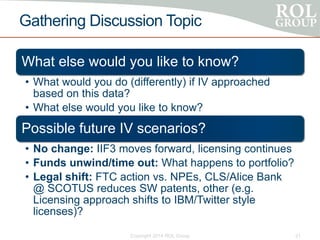
- 21. Gathering Discussion Topic What else would you like to know? ŌĆó What would you do (differently) if IV approached based on this data? ŌĆó What else would you like to know? Possible future IV scenarios? ŌĆó No change: IIF3 moves forward, licensing continues ŌĆó Funds unwind/time out: What happens to portfolio? ŌĆó Legal shift: FTC action vs. NPEs, CLS/Alice Bank @ SCOTUS reduces SW patents, other (e.g. Licensing approach shifts to IBM/Twitter style licenses)? Copyright 2014 ROL Group 21
- 22. BACKUP Copyright 2014 ROL Group 22
- 23. Technology Market Areas by Year Copyright 2014 ROL Group 23 2001 2002 2003 2004 2005 2006 2007 2008 2009 2010 2011 2012 2013 Circuitry Semiconductors Registers and Randomness Material Properties Optics Signal Processing Telephony/Signal Transmission Information Storage Data Processing Navigation Money Handling Medical Devices Climate Change
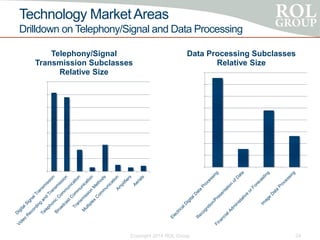
- 24. Technology MarketAreas Drilldown on Telephony/Signal and Data Processing Copyright 2014 ROL Group 24 0 500 1000 1500 2000 2500 3000 3500 4000 Data Processing Subclasses Relative Size 0 500 1000 1500 2000 2500 3000 3500 Telephony/Signal Transmission Subclasses Relative Size

